INTRODUCTION

edited by me in canvas.com
Let me start by saying a big thank you to God for granting us the privilege to be part of this season's Academy. And also for the provision of life and our daily needs. I must say I am really happy to be once again back once more to gain more knowledge from this season's Academy session.
I will say it has been being a long run for us to get to this part phase of academy work. So having been able to have gotten good knowledge on various cryptocurrencies in other seasons, this season is therefore a guide on how to trade these cryptocurrencies without being lost in the crypto market.
Hence, this, therefore, brings us to the topic of this week's two academy work which states "Crypto Trading Strategy with Triple Exponential Moving Average (TEMA) Indicator".
When talking about the TEMA indicator, what simply comes to mind is the fact this is simply one of the most important Technical Analysis Tools which is been utilized in the crypto market and other stock markets. This is one among other indicators that are simply used to access the crypto market which in turn serve as a guide with easy understanding to the trader/investor.

What is your understanding of Triple Exponential Moving Average (TEMA)?

To start with, I will say that the Triple Exponential Moving Average (TEMA) is simply one of the various Technical analysis tools that is been used by the trader for a clear understanding of the crypto market. The application of this tool simply gives a clearer picture of how the crypto market trends.
On the other hand, the utilization of the Triple Exponential Moving Average simply enables the trader or investor to identify the various trend formation that is present in the crypto market.
With the proper utilization of this indicator or technical analysis tool, it can simply help make trading go smoothly by stabilizing the fluctuation of larger prices.
Furthermore, the TEMA is one of these analyst tool that was created in the 1990s by a man called PATRICK MULLOY. This was brought into existence as a result of the lags or errors that come in as a result of the utilization of other MAs such as; The Exponential Moving Average, Oscillators. Therefore the advent of this TEMA brought stability and balance and hence bridge the gaps and lags of the already existing MAs. This, therefore, gave access to smooth price fluctuations in the process of trading cryptocurrencies or the crypto market.
There are key points to be noted for the utilization of the TEMA (what advantageous part it plays).
The TEMA (Triple Exponential Moving Average) was introduced to cover/bridge the gaps and lags from other already existing MAs.
Also, the TEMA does provide clear trend identification, support lines, resistance line, etc.
One also important point is the ability of the TEMA to be able to adjust lagging during calculation and utilization of the formula.
The utilization of the TEMA also helps the trader or market analyst to identify and interpret price fluctuations and hence evaluate vitality.

How is TEMA calculated? Add TEMA to the crypto chart and explain its settings. (Screenshots required)?`

Based on the fact that name Triple Exponential Moving Average, it, therefore, means that the calculation is done based on three phases.
Hence, before anything is done, the analyst/trader simply has to choose a period. Then, the initial EMA is therefore calculated which is followed by the Second EMA, and lastly, double EMA is therefore calculated.
From the conclusion drawn that the TEMA is a 3 phase calculation, this is therefore shown below.
TEMA=(3∗EMA1)−(3∗EMA2 )+EMA3
where:
EMA1 = Exponential Moving Average (EMA)
EMA2 = EMA of EMA1
EMA3 = EMA of EMA2
Hence, through this simple computation done, the TEMA is therefore calculated, and note that it is done over an already chosen period.
HOW TO ADD TEMA TO A CRYPTO CHART WITH LISTED STEPS.For this exercise, I will be making use of the official https://www.tradingview.com/chart/ site to showcase this practical. Hence, the list steps are below.
The first thing to be done is to visit the official trading view site. https://www.tradingview.com/chart/.
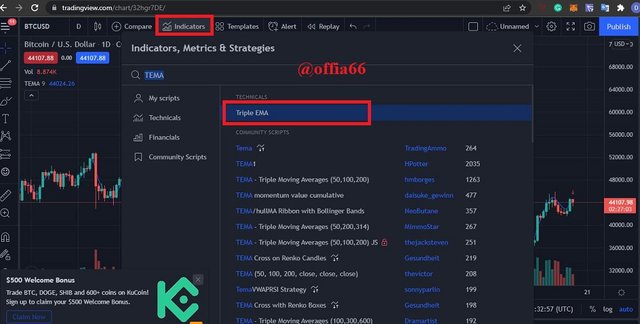
Once the pages load and you are been shown charts you will have to insert the indicator by clicking on the Icon for indicator on the top-loaded page.
you will have to search for the TEMA and then select it. This is therefore shown in the screenshots below.
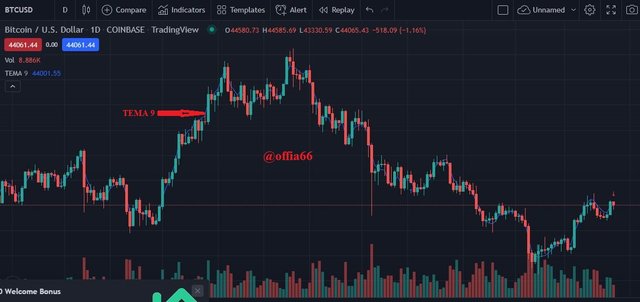
- Once the TEMA is added to the chart, you will have to click on setting and then run the necessary setup for the desired period.
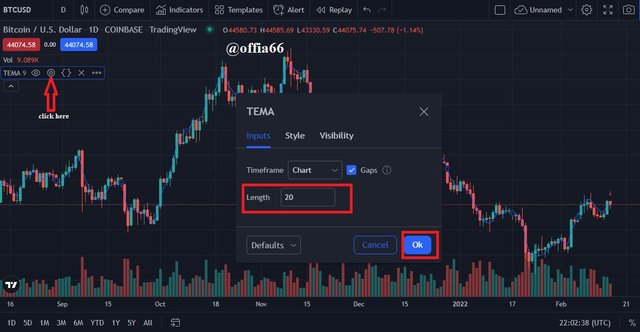
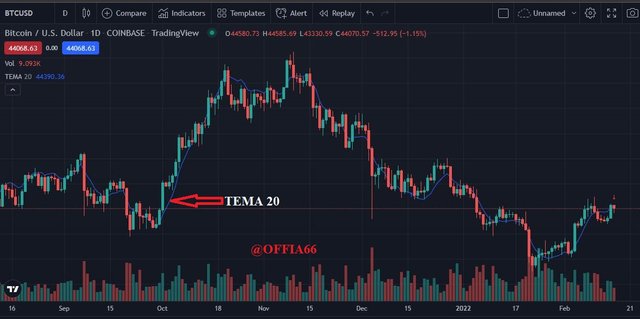
Hence, since the following listed steps have been followed up, I had to make some adjustments from the default period of 9 to 20. Hence to avoid the indicator clustering with the price chart, that was why I had to adjust the period to 20 for clearer pictures, and understandable form.

Compare TEMA with other Moving Averages. You can use one or two Moving Averages for in-depth comparison with TEMA.

On this part of the question, I will therefore be running a comparison of the TEMA with other indicators which are being utilized in the crypto market by traders. But it is important to know that one core reason for the introduction or advent of the TEMA was to come to bridge the gaps or failures of other existing MAs as earlier stated.
Hence, this comparison will therefore be done in a tabular form.
| TEMA | MACD | EMA |
|---|---|---|
| The TEMA one most important feature or attribute is simply the smoother trend identification ability | The MACD data used are simply based on past events/historical data this simply makes identification trend difficult to know when a change in trend will occur. | There is still no precise signal generation for there is still noise or lag found. |
| As the name implies, the three MA values are used to derive the average value of the crypto market/stock market. | MACD average value is simply gotten through by subtracting the long-term EMA (26 periods) from the short-term EMA (12 periods), and also from the information gotten from historic data. | On the other hand, the EMA simply derives its average values through the use of recent prices. |
| As earlier stated that the TEMA came as a result of the lags found in other existing MAs. Hence, it is in this regard I will say that there is more reliable price certainty because the lagging factor in the price of the asset is eliminated. | Since this relly on historic data or information, there are hence faults or lagging in the identification of a present trend. | Due to the presence of the still lagging factor, the average price gotten is hence not reliable. |

Explain the Trend Identification/Confirmation in both bearish and bullish trends with TEMA (Use separate charts). Explain Support & Resistance with TEMA (On separate charts). (Screenshots required).

From the onset, I have been able to make it clear that the TEMA is simply a correction analyst tool that stands to bridge the gap of other MAs originally in existence. You will agree with me that since other MAs have been unable to tackle the lags present in their use, the TEMA being able to eliminate such lags simply stands as a means to clearer trend identification in the crypto market/stock market.
Hence, with this in place, it is simply noted that both TEMA and the Price of the asset move in the same direction. Hence, this simply makes it very easy to identify current or previous trends that are present in the crypto market. Therefore with this being said, it will interest you to know that if the price of the asset trends upwards, it moves along with the TEMA hence making this to be a bearish trend. and also if there is a downtrend in the price of the traded asset, the TEMA moves alongside this, hence a bullish trend is formed. On a more simple note, I will therefore say the TEMA and the price of the assets work simultaneously.
It will therefore be easier to isolate these terms in this manner.
- BULLISH TREND: This comes into play when the price of the traded asset tends to move upward, alongside the TEMA, hence a bearish trend is formed.
- BEARISH TREND: As similar to that of the bearish trend, this happens when the price of the traded asset tends to move downward alongside the TEMA, hence a bullish trend is formed.
In the same vein, when we talk about trend confirmation we have to look at it in two phases which are bearish and bullish.
For a Bullish trend confirmation, this simply occurs/happens when the price of the traded asset/stock seems to be trading above the TEMA.
Also, for the Bearish confirmation, this simply happens when the price of the traded asset happens to be trading below the TEMA.
All this is therefore illustrated in the chart below.
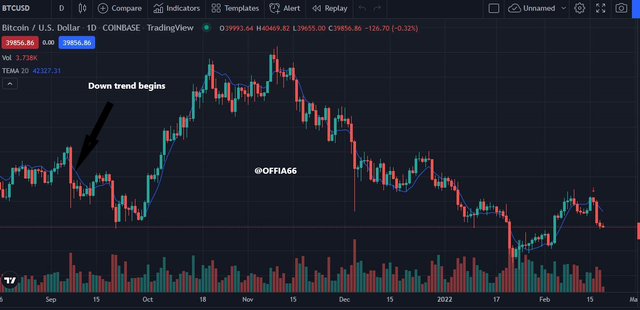
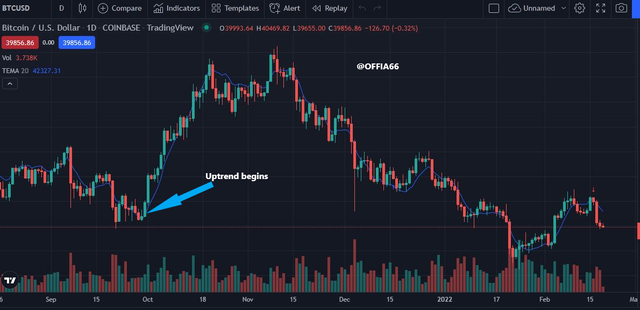
The traded asset in the chart is the BTCUSD which a day-old price was used. from the look at the price movement on the chart, you will notice that there was a reversal in the market price of the asset hence, a downtrend was initiated. Therefore at this point, the asset was trading below the TEMA.
Similar to the above stated, this applies to the bearish trend, as the price of the asset reversed, the traded asset started to trend above the TEMA which is a confirmation of an uptrend.

Explain the combination of two TEMAs at different periods and several signals that can be extracted from it. Note: Use another period combination other than the one used in the lecture, explain your choice of the period. (Screenshots required).

This section will simply have to do with the utilization of two TEMAS on the trading of a crypto asset. By the use of this TEMA, where both TEMAs will be used or inserted on the crypto chart to be traded on at different intervals.
it will interest you to know that when using these TEMAs, what is to be looked at, then is the point where both TEMAs confluence or cross each other. This, therefore, serves as a point where both the BUY/SELL entry can be initiated.
Furthermore, this is not for the buy or sell entry, it also shows or confirms that the already forming trend (new trend) will simply last long.
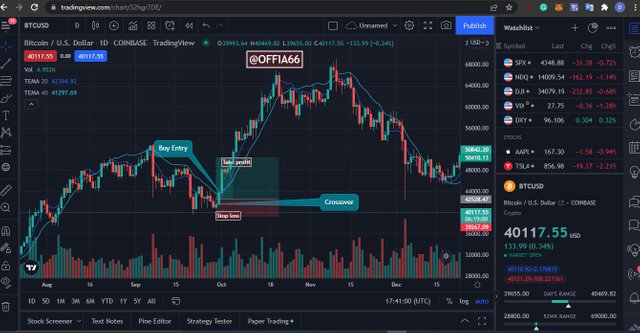
For a buy position to be established, the TEMA with the lower period crosses over the TEMA with the higher period this, therefore, indicates a valid uptrend and hence a buy position is opened.
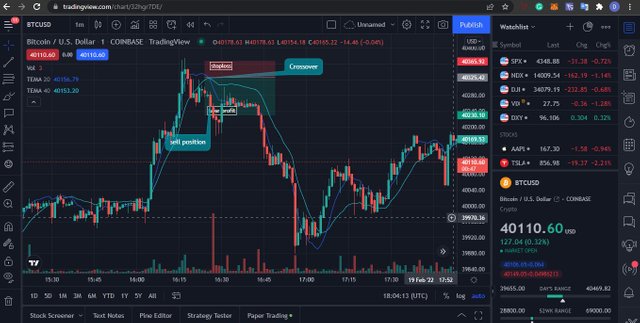
In the same vein, When the TEMA with the higher period crossed over the TEMA with the lower period, it, therefore, indicates that a valid downtrend is formed and therefore a sell position is created.
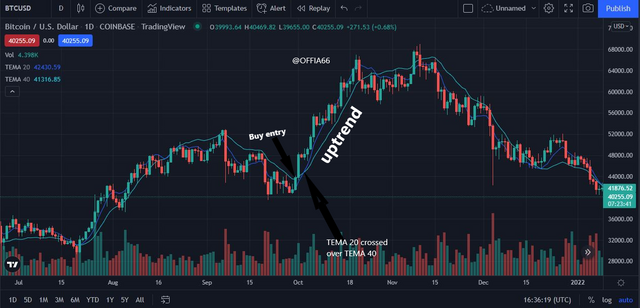
The screenshot above is simply a crypto chart of BITCOIN/USD. As instructed, I have been able to add Two TEMAs which are; one of them at the 20 periods and the other TEMA at the 40 periods. In the downtrend, the higher period 20 crosses over the Higher period 40 simply indicates a change in the trend, hence the price of the asset, therefore, trends upward this, implies that a buy position is open for traders.
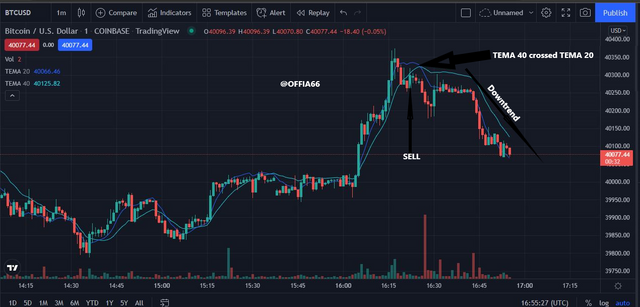
In the same way as the first chart, the BITCOIN/USD asset was used at a time frame of 1M. Here the higher TEMA which is 40 crosses over the lower TEMA which is 20. This, therefore, indicates that the market price of the asset is currently undergoing a downtrend hence opening a sell position for traders.

**What are the Trade Entry and Exit criteria using TEMA? Explain with Charts. (Screenshots required).**

The trading of a crypto asset using the TEMA simply involves several criteria that are needed to be satisfied. This section will be further categorized into two sections which are the ENTRY/EXIT CRITERIA FOR BUY POSITION & ENTRY/EXIT CRITERIA FOR SELL POSITION.
TRADE ENTRY/EXIT FOR BUY POSITION.
Using the Two TEMAs as a case study for illustration of this section, the following listed below are therefore the criteria for the trade entry/exit for buy position of the traded asset.
- One of the very first requirements is to add your two TEMAs one of which is low and the other high. (i.e TEMA 1=20(LOW) & TEMA 2=40(HIGH)).
- After successfully inserting the two TEMAs, I located a trend of the market which was an uptrend, and then carefully observed where the two TEMAs crossed each other.
- And then I had to observe a buy entry at least two candlesticks confirmation on trade chart.
- For my exit criteria, I had to place my stop loss below the point where the two TEMAs crossed.
TRADE ENTRY/EXIT FOR SELL POSITION
In the same regard as the BUY position, the two TEMAs are therefore used as an illustration of this.
Similarly to the first, the two teams were inserted successfully with the low as 20 and the higher at 40.
I identified the point where the TEMAs crossed on the uptrend range where it was at this point the Higher TEMA cross the lower TEMA.
I, therefore, made a sell entry at the point where the two TEMAs crosses were set at least after two candlesticks.
Then lastly for the exit criteria, my take profit level was therefore set, and my stop loss was set at the level above the point of crossover.

Use an indicator of choice in addition with crossovers between two TEMAs to place at least one demo trade and a real margin trade on an exchange (as little as $1 would do). Ideally, buy and sell positions (Apply proper trade management). Use only 5 - 15 mins time frame. (Screenshots required).

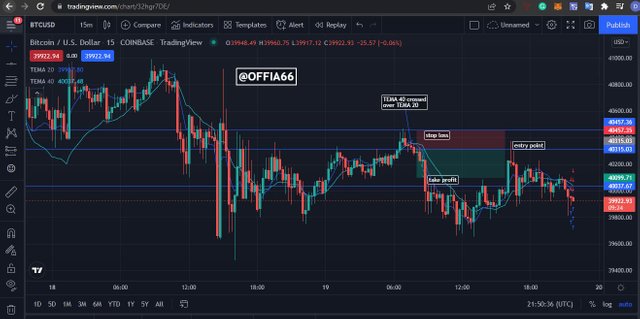
For the purpose of this practical, I will be making use of the BITCOIN/USD asset to execute my trade.
Given the time frame of 5-15 minutes, I strongly agree with this time frame for reasons that the TEMA indicator is best utilized over a short time frame.
Utilizing the TEMA indicator on the BTC/USD token, I noticed that there was a point in the chart where the higher position of 40 crossed over the low position. Hence creating a perfect downtrend for me to enter the market.

What are the advantages and disadvantages of TEMA?

From the onset of this homework post, I have been able to make an establishment that the TEMA was brought in as a result of the lags that are present in the other existing MAs. With this, I will therefore like to further list soem advantages ot the TEMA.
Before we properly go into trading with the TEMA indicator is as well important to know its limitatio and as well it benefits.
ADVANTAGESWith the utilization of the TEMA, there is a high reliability for quick respons in terms of price actions which therefore enables the trader to indentify certain opportunities and in turn maximize profit.
In the use of the TEMA there is no Lags as present in other indicators.
The TEMA can as well serve as a support or Resistance based on the market condition.
With the utilization of the TEMA ( using the two TEMAs) the indentification of the the entry/exit positions for both buy and sell can easily be indentified.
Also, the TEMA indicator moves along side the price of the traded asset. This is to say both the price of the asset and the indcator moves simulateneously helping the trader indentify trends easily and also help in the pridiction of the future signals.
DISAVANTAGES.Below are hence the limitations of the TEMA.
Based on the speedy nature of this indicator towards the price movement of the traded asset, it might sometimes become a disadvantage to the trader where by the trader might hence enter the market late due to the fast nature of the indicator.
The utilization of the TEMA works only best in present/trending market, hence false signals are generated when trading with this indicator outside a trending market.
Last but not the least I will conclude this with saying that as a result of the fast nature of the indicator, most times dynamic resistance can simply be formed as a result of the dynamic suport. All this is as a result of the too speedy nature.

CONCLUSION

In a nutshell, I will conclude by saying the TEMA Indicator is also a type of Indicator which reduces the lags that are present in other Moving Averages and also, respond very quickly according to price action. Furthermore with help of the TEMA indicator moves along with the price of the traded asset, which enables the easy identification of Trends and and also trend directions.
I will therefore conclude by saying the TEMA Indicator help either the trader or the investor along side an analyst in performing profitable trades, but as there are advantages, hence there are limitations too.
Thank you professor @fredquantum for this wonderful lesson
cc:@fredquantum
CC:@steemitblog
ALL SCREENSHOT WHERE TAKEN BY ME FROM THE OFFICIAL TRADING VIEW SITE.

