

(1) What is your understanding of Triple Exponential Moving Average (TEMA)?
(2) How is TEMA calculated? Add TEMA to the crypto chart and explain its settings. (Screenshots required).
(3) Compare TEMA with other Moving Averages. You can use one or two Moving Averages for in-depth comparison with TEMA.
(4) Explain the Trend Identification/Confirmation in both bearish and bullish trends with TEMA (Use separate charts). Explain Support & Resistance with TEMA (On separate charts). (Screenshots required).
(5) Explain the combination of two TEMAs at different periods and several signals that can be extracted from them. Note: Use another period combination other than the one used in the lecture, explain your choice of the period. (Screenshots required).
(6) What are the Trade Entry and Exit criteria using TEMA? Explain with Charts. (Screenshots required).
(7) Use an indicator of choice in addition to crossovers between two TEMAs to place at least one demo trade and a real margin trade on an exchange (as little as $1 would do). Ideally, buy and sell positions (Apply proper trade management). Use only a 5 - 15 mins time frame. (Screenshots required).
(8) What are the advantages and disadvantages of TEMA?

INTRODUCTION: Good day, Steemians I am @ojerindejoel a student of Steemit crypto academy I appreciate the privilege of learning and writing homework to boost my knowledge about cryptocurrency trading and I will like to say happy resumption to every student and professor.


Triple exponential moving average (TEMA) was brought up by Patrick G. Mulloy in the year 1994, this indicator has been an amazing indicator used in stocks over the year before it was introduced to the crypto world and it has been giving more positive results than that of normal moving averages which will be leading us to talk more about triple exponential moving average in today's homework, the indicator TEMA was created to eradicate lagging from normal moving averages because normal moving averages use previous data for calculation but TEMA uses more current data and gives more accurate result.
TEMA tends to eradicate fluctuation from normal moving averages to get the proper direction of the trend and it gives traders a clearer trend which gives traders more edge over the market because as a crypto trader the first thing to watch out for is the trend of the market and we all know that the trend most always be our friend going against the trend might cost us losing our funds.
Combining two TEMA can be used to trade cross over for an entry and exit trade in a buy position or in a sell position but someone has to be patient enough to allow the cross to happen and allow like two candles to close above the TEMA for confirmation so we will be sure of the trade we are taking.


TEMA is a single trend indicator which was combined as a result of 3 EMA's in which the 3 there serve a coefficient of the three EMA's and all the EMA used for calculation are of the same period, the calculations and the setup of triple exponential moving average will be More emphasized below as we go on.
TEMA= (3 x EMA(a)-(3 x EMA(b)+(3 x EMA(c)
EMA(a) = Exponential moving average
EMA(b)= EMA OF 2EMA.
EMA(c) = EMA of 2EMA
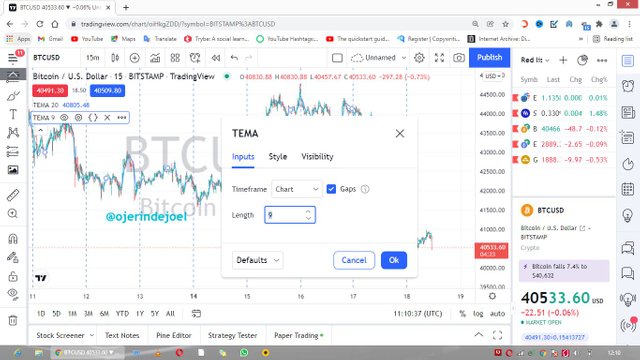
How to add TEMA to our chart
- Firstly, we will visit tradingview then get registered.
- We go to the top part of the chart after selecting any crypto pair of our choice.
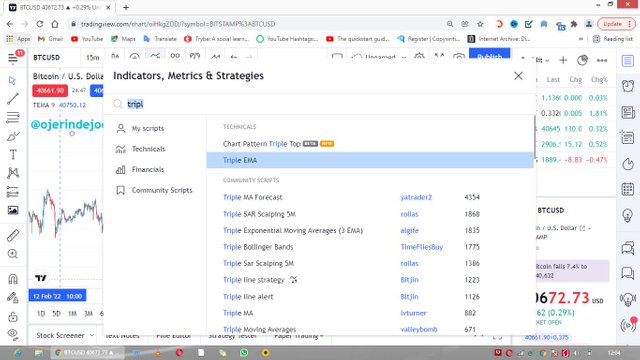
Then we search for triple exponential moving average (TEMA), then we click on it.
After, clicking the indicator appears automatically on the chart.
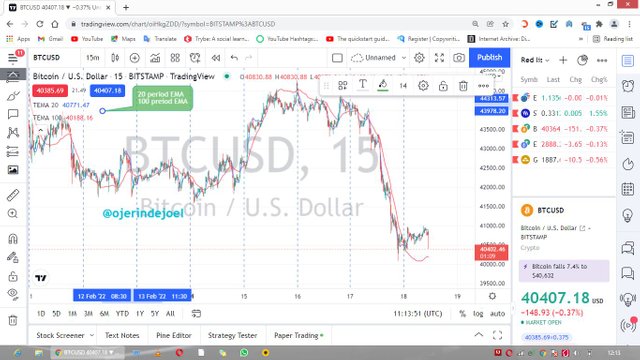
- Then we will have to modify the default period to 20 periods TEMA and 100-period TEMA


TRIPLE EXPONENTIAL MOVING AVERAGE
TEMA is a very strong tool that has been bringing forth positive result in the trading circle it involves combining of three EMA's and these combination makes it more outstanding and stronger it is used for eradicating lagging in moving averages, we all know moving average does not bring instant result because MA needs to gather data for its calculations before indicating the direction of the market price.
TEMA is used to determine a clearer trend of the market which is very important for all traders to knows because the trend is one thing we can't do away with within all trading markets and its calculations are not so cumbersome as that of some moving averages that need to do some complex calculations before bringing the expected result but the triple exponential moving average works with a simple formula and brings faster and accurate result.
MOVING AVERAGES (SMA- 20DAYS AND EMA-50DAYS)
Moving averages have been a long-time indicator that traders use for their technical analysis which has been working fine but the issue with moving average is that it lags before bringing the expected result and lagging will not help any trader to make the expected profit from the market that why Patrick Mulloy had to sit down to look for a way to eradicate the lagging in moving averages which were successful and so many traders has been using the indicator called TEMA.
Moving average fluctuation more in trends direction which is not so good for any crypto trader, the trend is the major factor for entering any trade and when there's fluctuation in the trend and its direction then a trader has to be patient to look for a more perfect entry in other not to Loss funds.


Identification/confirmation of Trends for the bullish market.
Having known that the trend triple exponential moving average provides clearer trends the issue will be how to identify the trend using the TEMA indicator on a bull and bear market.
To identity trends using TEMA is very easy and fast to comprehend what we need it to be patient and watch out.
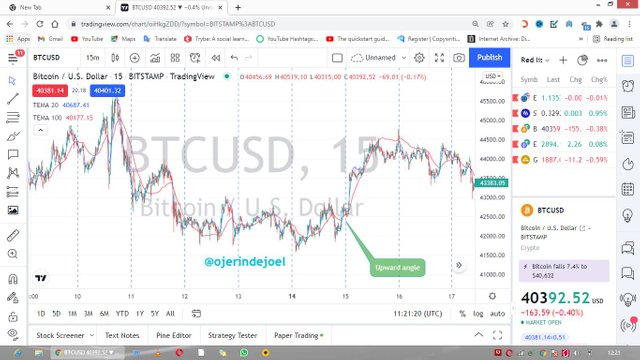
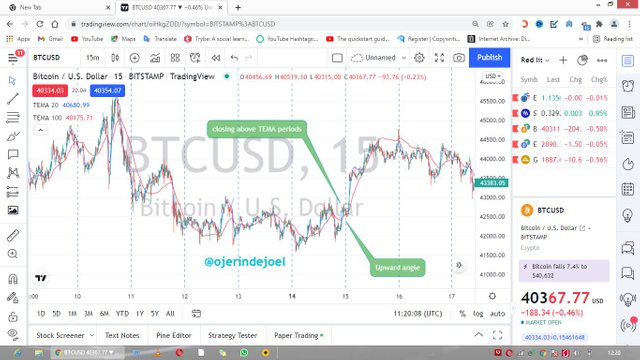
- For bullish trend, when the TEMA indicator forms an angle on the upward side in any short time frame because its works are better on shorter time frame.
- When the candlestick closes above the TEMA indicator we can also watch out for an uptrend and get ready to buy but we need to confirm our entry before entering the market.
- Confirmation of trend
When the market chart is on sideway or a downtrend and it seems there wants to be a change in trend what we just need to do is to allow the TEMA to cross each other upward in this case we will be using two TEMA's after the crossing we'll wait for at least two candlesticks to close above the TEMA crossing then we can take our buy trade.
Identification/confirmation of Trends for bearish market.
Everything said for the bull market is also applicable to the bear market is just that it is in a reverse manner, using TEMA to identify a bearish trend we need to spot some movement in the market circle that will make us know that the trend direction is real.
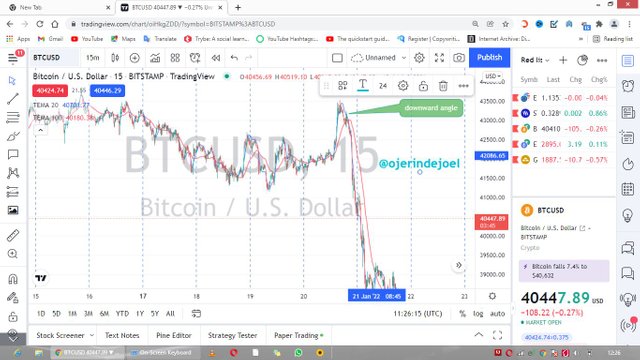
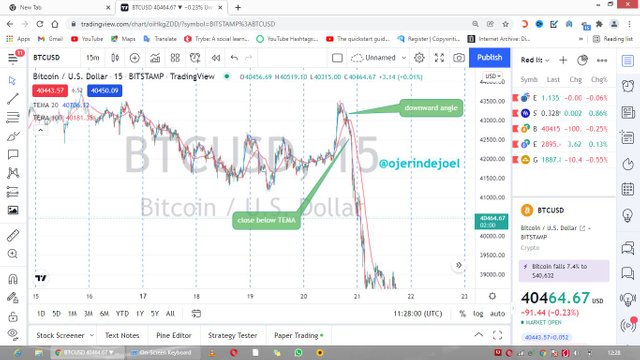
- When the TEMA indicator forms an angle downward with the candlestick it is giving a sell signal.
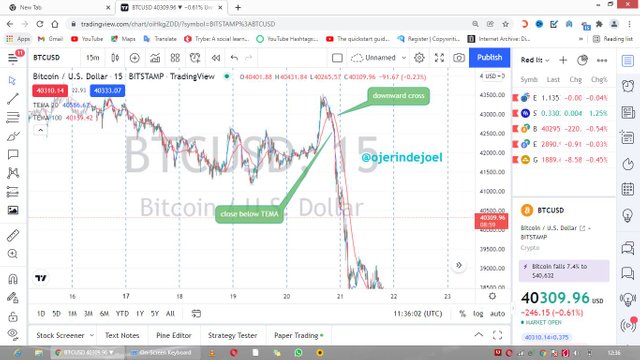
- When we have our cross candlesticks below the TEMA indicator it is showing another green light for a sell entry but will all this we need to confirm our entry because the market might be a bit funny sometimes.
confirmation of trend
Before we could make our conclusion that the market has reversed, we need to see some factors on the market chart to confirm that the trend is real.
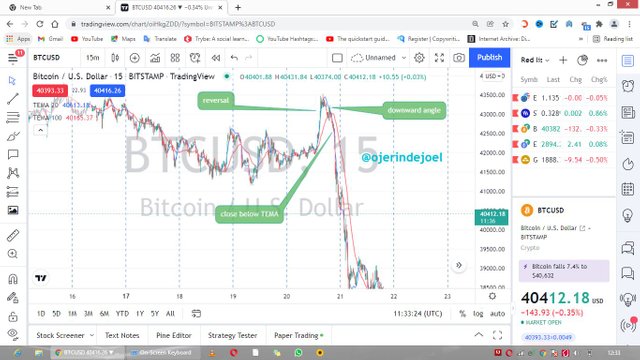
When we spot reversal on our chart or TEMA crossing we need to be patient to allow at least two Candlestick to close below the TEMA Cross then we will be sure that it's a clear trend and it is safe to put a sell trade.
Support and Resistance using TEMA indicator
Support and resistance trading seems to be a very productive strategy over the years it has been a game-changer for so many traders and it has been very helpful in trading, now we will be using the TEMA indicator to determine supposed and resistance on the market chart.
To determine support using TEMA indicator when we notice that candlesticks are bouncing off the TEMA line continuously it is indicating that there's a support at that particular zone the bulls are taking over.
Same applies to resistance using TEMA is just that resistance is oppositely when we notice that the candlestick is been resisted by the TEMA line several times then it is giving a sell signal meaning that the bears are much more in the market.


Combining two TEMA makes it super stronger and gives clearer trends and direction and more chance of entry and winning trades, TEMA combination involves two TEMA with different EMA's we have the short TEMA 10, 20 periods and the longer TEMA 80, 90,100 periods which are combined on the chart to make entry more productive.
When we have a lower period crossing a higher period from a support level then can be sure we would be having a buy entry soon and if we have the higher period crossing over the lower period it is giving a sell signal in which as a trader, we should be at alert but in all, we must always confirm our entry before we take any step and how do we do that, we just need little patience to all one or two candles close above or below both periods.
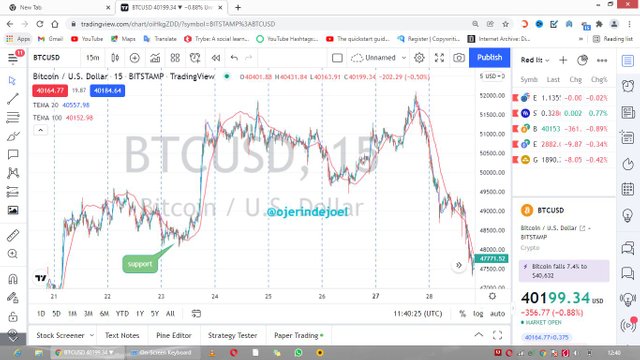
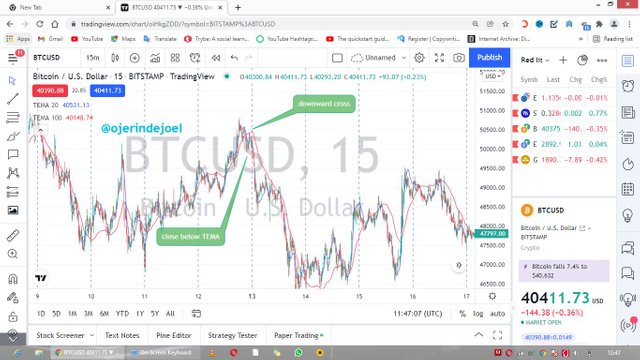
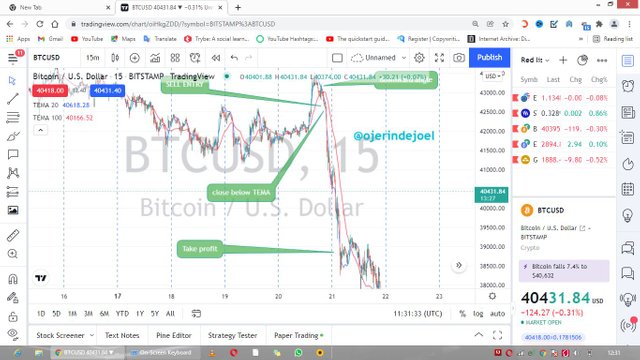
I'll be making use of 20 and 100 periods for my analysis on BTCUSD 15min chat.
I got a sell entry as soon as I spotted a downward angle and the candle closing below the TEMA's which is serving as confirmation.
Using these two TEMA's gave me more opportunities to enter a trade in which one of them is a reversal, the image below shows a reversal signal as the higher TEMA crosses the lower TEMA from an upward trend.
Lastly, I got a buy entry as soon as the price was bouncing off the two TEMA's which serve as support.


We've talked about a few ways to enter a trade using triple exponential moving average but the most important thing is that we must follow the rules of using the indicator and abuse can lead to loss of funds and another thing we need to stick to a good and proper risk-reward ratio that is appropriate for the volume of our account.
buy entry using TEMA
- Firstly, we would add the 2 TEMA's of the different periods to our chart
- Then patiently wait for a downward market, as soon as the crossing upward of the two-period is spotted then I start preparing for a buy entry.
- But before entering the trade we need to confirm by allowing two candles to close above the two TEMA periods.
Second buy entry using support with TEMA
Since we already have the TEMA periods on our chart.
What we need now is to stay till we notice the Price bouncing off the TEMA line continuously.
- Since the bounce is not once, we can consider taking a buy trade with a good risk-reward ratio.
sell entry using TEMA
Since we've added the two periods to our chart
When we have an upward or ranging market, we will wait for the higher period to cross over the lower period.
- After the crossing, we then wait for at least two candles to close below the two periods
- Then we enter the trade with a proper risk reward ratio.
Second entry using resistance for a sell position using TEMA
Using TEMA for sell entry using TEMA is easy, what we need is to get the two periods on our chart as earlier explained.
Then when we spot that the TEMA periods are resisting the candle's we should get ready to enter our trade.
But we must abide by the rule of risk reward ratio.


DEMO TRADE
Firstly, I'll visit tradingview
I'll be using ADA/USDT for the demo trade.
After adding TEMA of 20 and 100 periods to my chart.
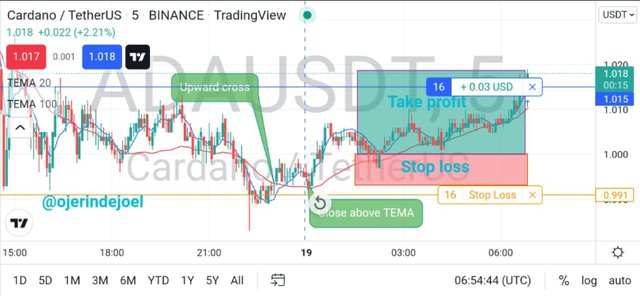
- I spotted an upward cross on a 5min timeframe and the price closing above the TEMA as confirmation of my entry.
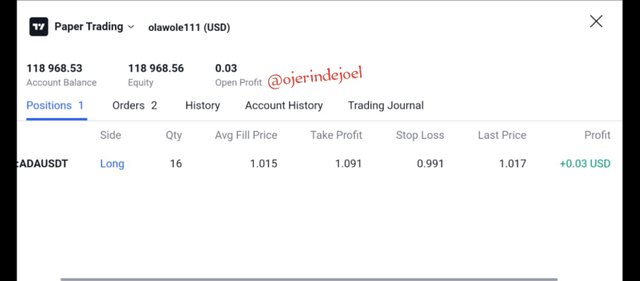
- I entered the trade using a risk reward ratio of 1:2 and I made a profit of $0.03 from the trade.
REAL TRADE USING EXCHANGE.
I made use of ADAUSDT for my Analysis
on 5min timeframe on tradingview.After spotting a TEMA cross and close of price above the two TEMA periods.
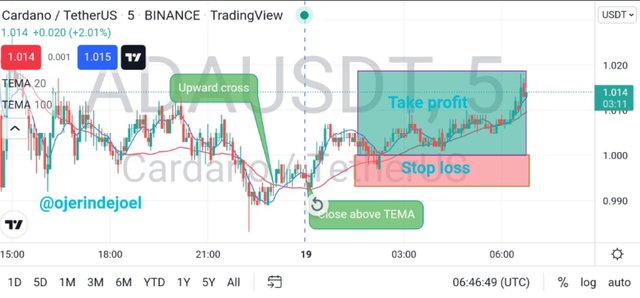
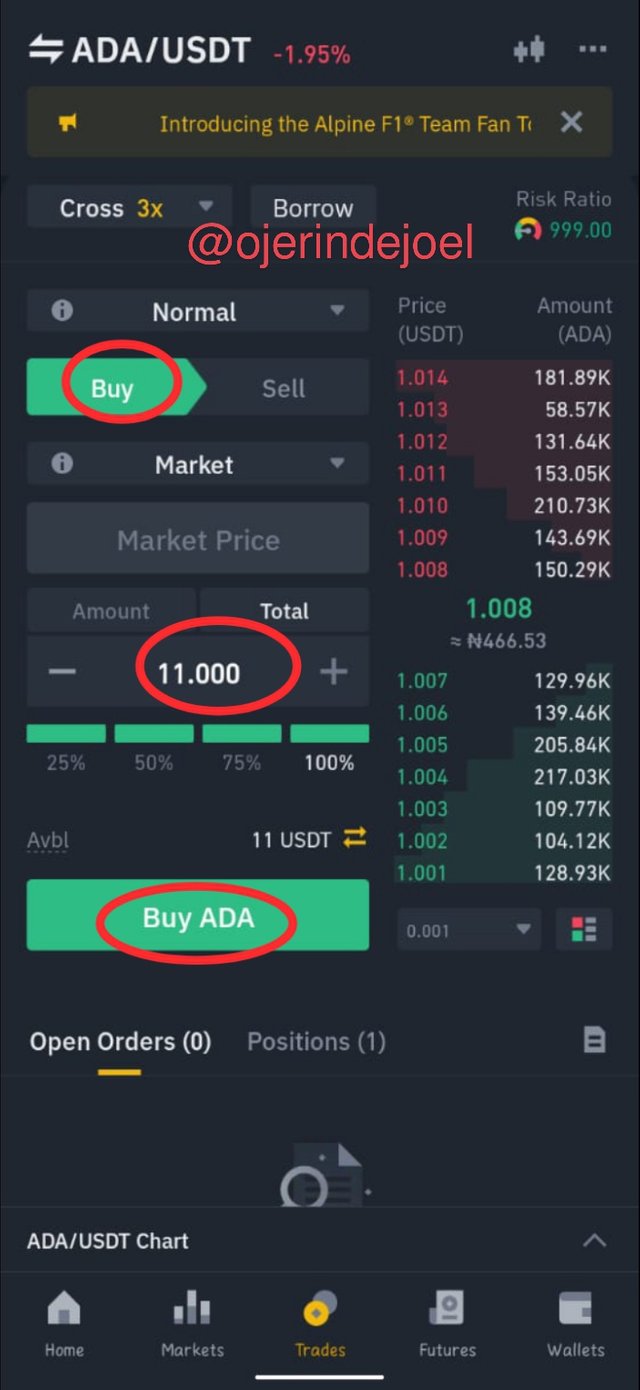
- Then I proceeded to Binance exchange to place my buy order for ADAUSDT.
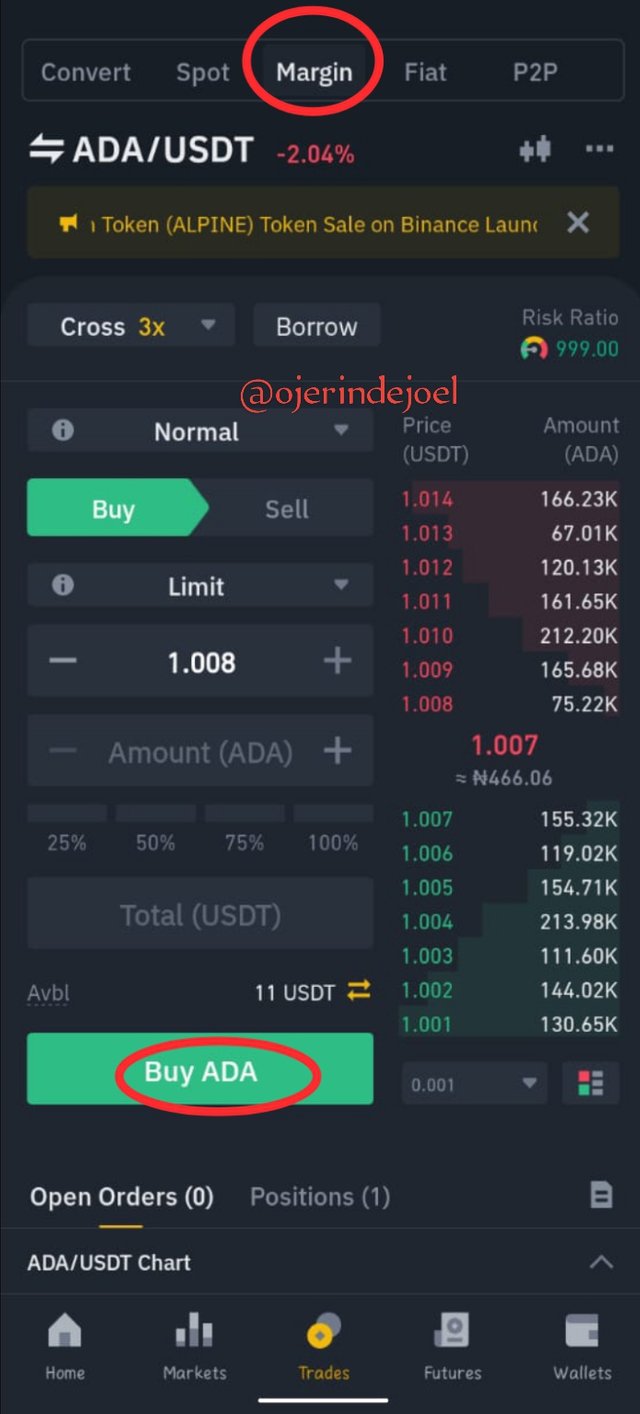
Using my margin trading account with the sum of 11usdt
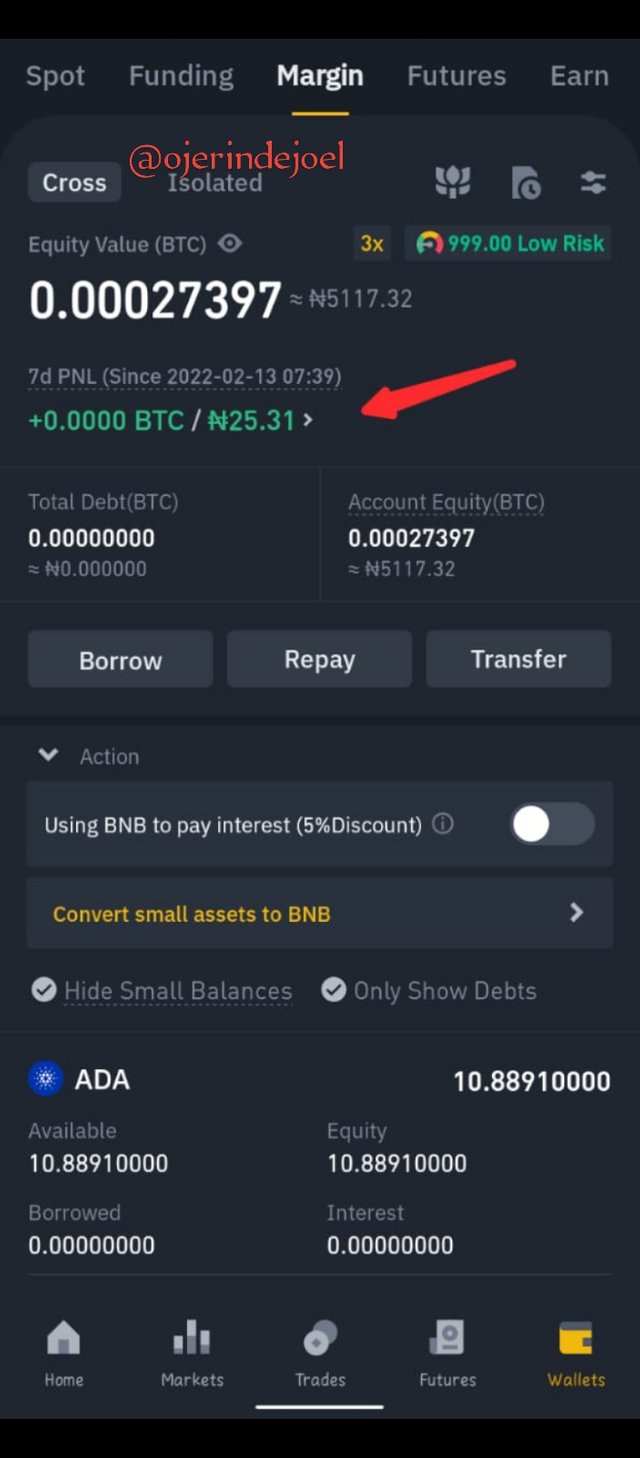
And made a profit of #25 because my currency on Binance is in naira.


ADVANTAGES OF TEMA
TEMA provides clearer trends.
TEMA eradicates fluctuation in moving averages.
TEMA helps to determine support and resistance.
TEMA quickly react to price changes
TEMA gives a more accurate direction of trend
DISADVANTAGES OF TEMA
When the chart is choppy it tends to bring false signals.
The reduced lag of MA does not benefit all traders
They can't be used alone, but are best used in conjunction with price action and other technical analysis.
When we have a choppy market TEMA provides little information.**

CONCLUSION
Triple exponential moving average has been a wonderful topic Thanks to professor @fredquantum for the impactful lecture.
TEMA is a very strong indicator that has so much potential in it and it provides various information concerning the market, information like trends, direction of the trend, reversals, gives entry and exit points.
But in all, we have to combine this indicator with other technical analyses like price action and the likes to have a more perfect entry and have got a good entry we need to abide by the rules of our risk to reward ratio, so many violate this and the market properly deal with them and am an example of this.
NB; all unsourced images are from trading view and Binance.
@steemcurator01 @steemcurator02
It is already 6 days and this post has not been curated.
Downvoting a post can decrease pending rewards and make it less visible. Common reasons:
Submit