

(1) Explain Puria method indicative strategy, what are its main settings. which timeframe is best to set up this trade and why? (Screenshot needed and try to explain in detail)
(2) How to identify trends in the market using the Puria method. Is it possible to identify trend reversal in the market by using this strategy? Give examples to support your article and explain them. (Screenshot needed)
(3) In the Puria strategy, we are using MACD as a signal filter, by confirming signals from it we enter the market. Can we use a signal filter other than MACD in the market for this strategy? Choose one filter (any Indicator having 0 levels) and identify the trades in the market. (Screenshot needed).
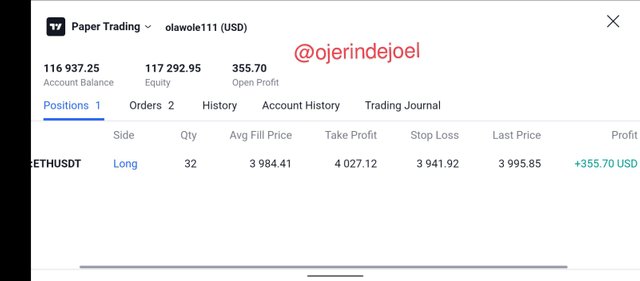
(4) Set up 10 demo Trades (5 buying and 5 selling) on 5 cryptocurrency pairs using the Puria method indicative strategy. Explain any 2 of them in detail. Prepare a final observation table having all your P/L records in these 5 trades.
Components of the table:
S.no. Pair Buying Price selling Price profit loss time frame
(5) You have to make a strategy of your own, it could be pattern-based or indicator-based. Please note that the strategy you make must use the above information. Explain full strategy including a time frame, settings, entry-exit levels, risk management, and place two demo trades, one for buying and the other for selling.

INTRODUCTION
Good day guys, I am glad to partake in the lecture of professor @utsavsaxena11 on Trading with Puria Method Indicative Strategy and How to Make Our Own Strategy Enjoy!!! As you read.


Puria method indicative strategy is a very good strategy that became popular in 2010, it enables crypto traders to make an effective entry and exit in the market cycle making use of the current trends in the market which is one of the most important things in trading, there's a popular saying that "always make the trend your friend" a trader that goes against the trend should Be ready to lose his funds and another thing to take note from this strategy is the moving averages and the MOVING AVERAGE CONVERGENCE DIVERGENCE(MACD), more explanation will be given on these three key things as we go on.
And Puria method indicative strategy is mostly used by short term traders (intraday) on low time frames like 5min, 15min, and 30min
The major setting needed in this strategy are;
MOVING AVERAGE WEIGHTED(WMA)
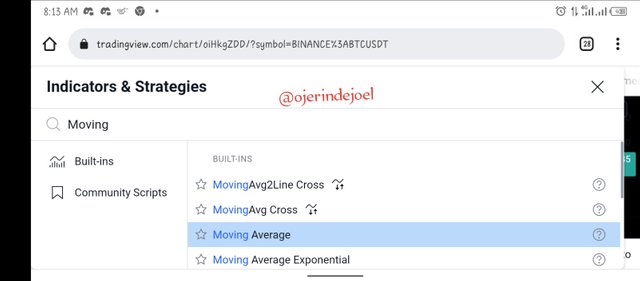
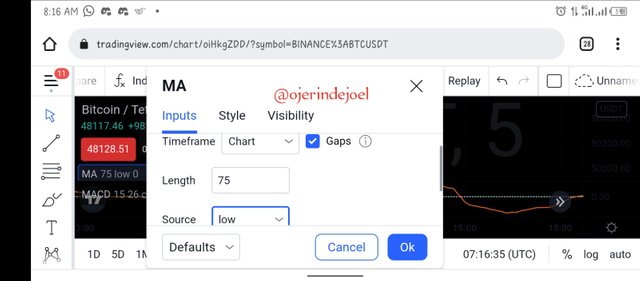
- Firstly, after knowing the trend, we change the period of the first moving average weighted to 75 periods and the source to low.
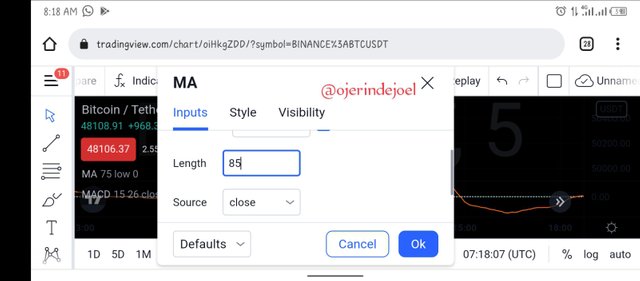
- We will change the second moving average weighted period to 85 periods and the source to closed.
- We can make use of any preferable color for the two moving averages.
MOVING AVERAGE CONVERGENCE DIVERGENCE(MACD)
- Firstly, we will change the fast length from default to 15.
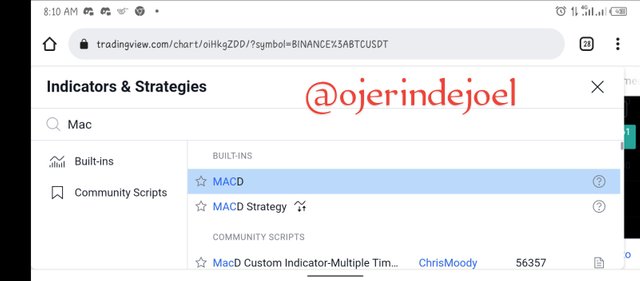
- Secondly, we will change the slow length from default to 26.
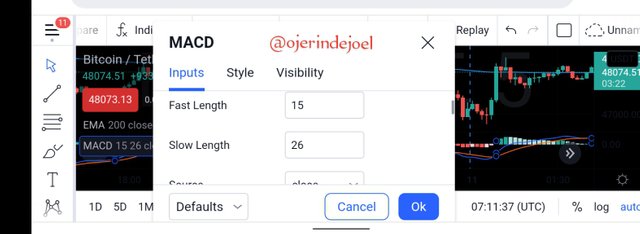
We can change the color to our preferred color
We will notice that the candlesticks have vanished and we can see is the zero line.
In trading. we have different types of time frames which are 1min, 5min, 15min, 30min, 1hr, 4hr, etc.
All these timeframes have different functions depending on the type of trader we are, but in the case of Puria a method indicative strategy low timeframes like 1min, 5min, and 15min are best used and the reason is that lower time frames show the current behavior of the market and candlesticks are formed very fast and it enables us to make a fast decision but they can't be Used to know the current market trend only the larger timeframe can be used to know the current market trend because the candlesticks take more time to form and it shows a larger picture s of the market structure.


HOW TO IDENTIFY TRENDS USING PURIA METHOD INDICATIVE STRATEGY
Firstly, what is market trends? Trends can be defined as a structure in which market prices form lower lows and higher highs It can be in form of a bullish trend or a bearish trend.
Here I will be making a practical example of how to know the current market trend, we have had two confluence to note when trying to know the current market trend which is the moving averages and MACD earlier mentioned, when the market price closes below the two moving averages in a downtrend scenario or close above the two moving averages in an uptrend scenario, which can be filtered with MACD when the line crosses the zero line to the upward or to the downward in both bearish and bullish trend scenario.
HOW TO IDENTIFY TRENDS REVERSALS USING PURIA STRATE
When the market price is moving closer to the moving averages and most importantly when the price enters the zero region and make a U-Turn upward for upward reversals or making a U-Turn at the zero line at the upper region of the MOVING AVERAGE CONVERGENCE DIVERGENCE(MACD) then as a trader we should start locking our profit or close the entry.
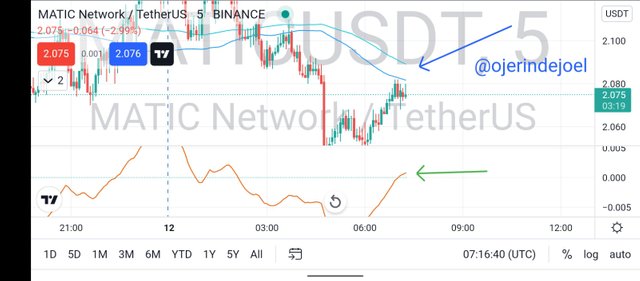
The screenshot above gives a very good example of how to use the puria strategy to spot reversals in the market, my blue arrow point to a zone where the price is close to the two moving averages and there's a probability it breaks the moving averages, and secondly is my green arrow points to the zero line on my MACD as soon as it breaks this line then a reversal is bound to happen.


My answer will be yes, we can another other than the MACD indicator to filter out so far, the indicator has zero levels then it's usable.
I will be choosing a stochastic indicator as an alternative filter for MACD because it is also an indicator that moves with the current price of the market it consists of oversold and overbought region and also comprises of the fast line and the slow line.
Let assume I want to make use of the stochastic indicator instead of the MACD in the Puria strategy, have added my two moving averages weighted then I will be patient to allow the candlestick to close below or above the moving averages then I move to my stochastic indicator to filter my entry but before I could confirm my entry the two lines most have been in the overbought region then make a reversal cross for a sell entry but for a buy entry the market price has to get to the oversold region then make a reversal cross on each other by then I will enter my buy or sell entry.
And another important thing to note about the stochastic indicator is that from 0 to 30 is the oversold region, from 70 to 100 is an overbought region and in between 30 and 70 is neutral.
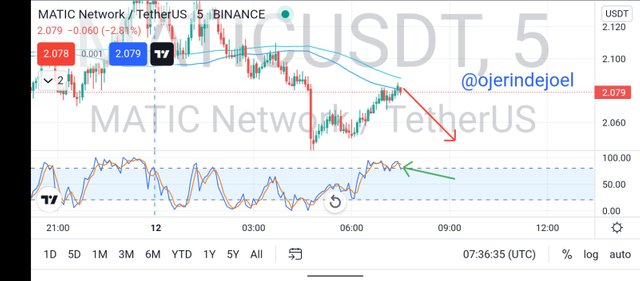
The screenshot above explains to us that as the market is at the overbought region which is denoted with a green arrow and the market price retest the moving averages to drop down which is denoted with a red arrow, that point will be my entry point.


BUYING TRADES
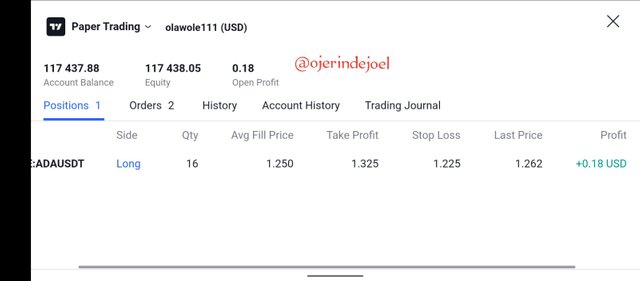
- ANALYSIS OF ADAUSDT
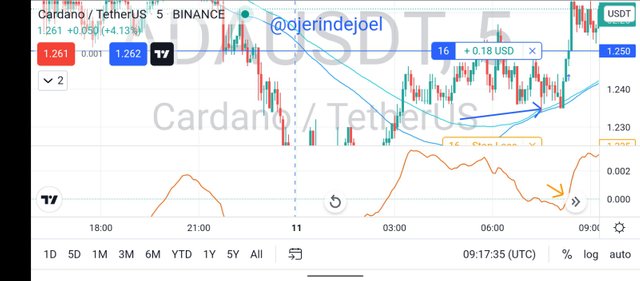
- Trade Result
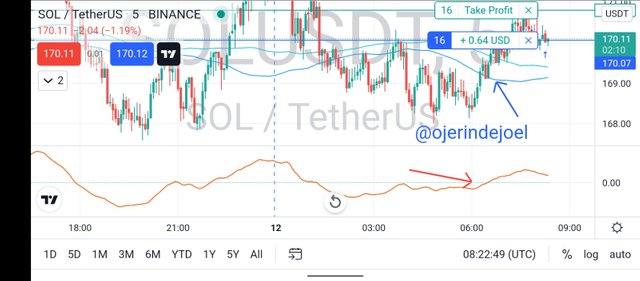
- ANALYSIS OF SOL/USDT
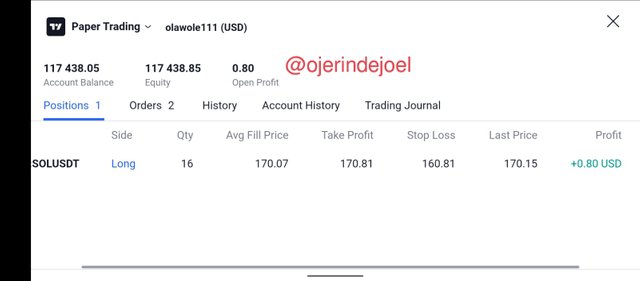
- Trade Result
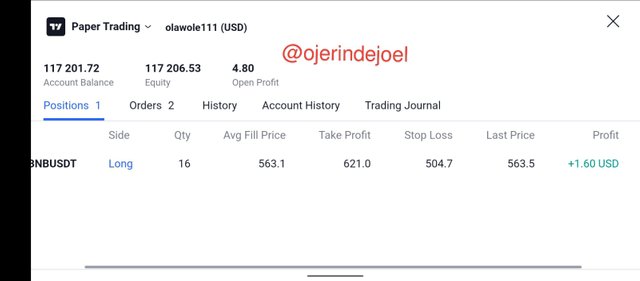
- ANALYSIS OF BNB/USDT
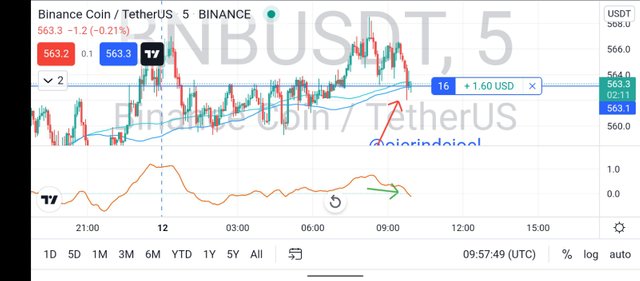
- Trade Result
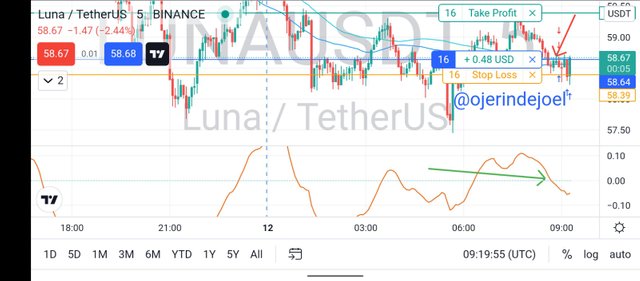
- ANALYSIS OF LUNA/USDT
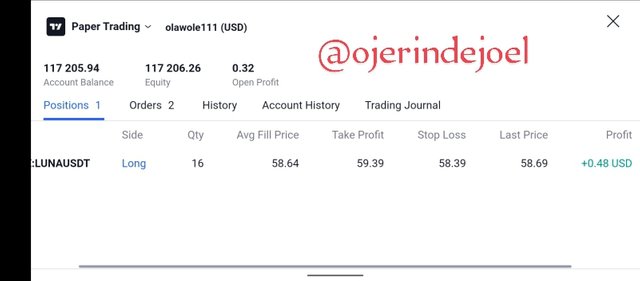
- Trade Result
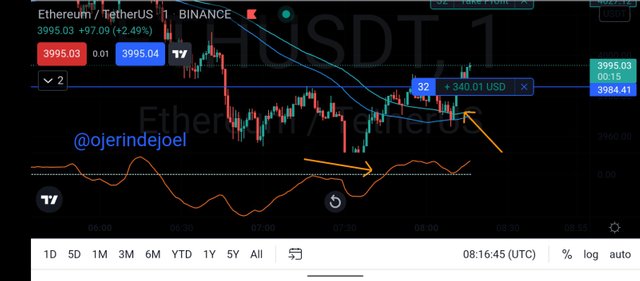
- ANALYSIS OF ETH/USDT
- Trade Result
SELL TRADES
- ANALYSIS OF MATIC/USDT
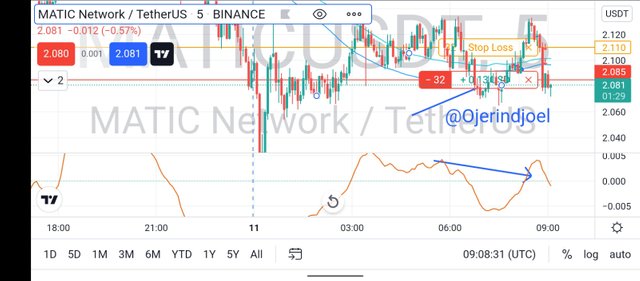
- Trade Result

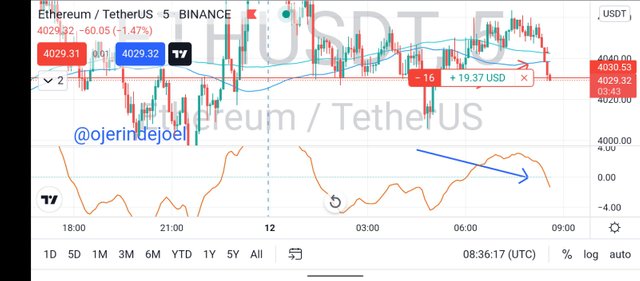
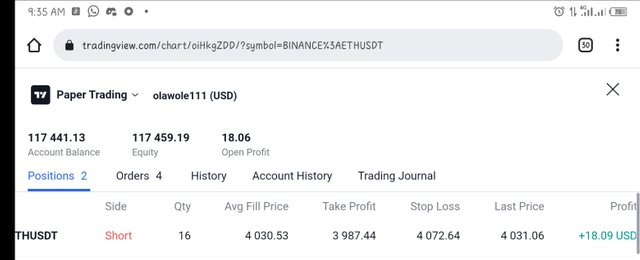
I will be doing an analysis on ETHUSDT using the puria strategy, as soon as the market price cross the moving average downward and the price crosses the zero line on MACD downward I took my entry in a 5min timeframe.
| s/n | pairs | Buying price | selling price | profit | loss | timeframe |
|---|---|---|---|---|---|---|
| 1. | ADAUSDT | 1.250 | Null | 0.18 | Null | 5min |
| 2. | ETHUSDT | 3.884.41 | Null | 335.71 | Null | 5min |
| 3. | SolUSDT | 170.07 | Null | 0.80 | null | 5min |
| 4. | LUNAUSDT | 58.64 | Null | 0 34 | Null | 5min |
| 5. | BNBUSDT | 563.1 | Null | 1.60 | Null | 5min |
| 6. | LUNAUSDT | Null | 58.55 | 0.32 | Null | 5min |
| 7. | BTCUSDT | Null | 48982 | 319.23 | Null | 5min |
| 8. | ETHUSDT | Null | 4030.53 | 18.09 | Null | 5min |
| 9. | BNBUSDT | Null | 552.4 | 36.82 | Null | 5min |
| 10. | MATICUSDT | Null | 2085 | 0.13 | Null | 5min |


Before coming up with my strategy there are some factors that I need to consider in this strategy which are;
- Market structure
- Trends
- Time frames
- Type of pattern and indicator
- Merging confluence
- Entry and Exit
MARKET STRUCTURE
Market structure can be in trending form or ranging form and this is the first thing I will like to know about when opening my charts, because this will lead me to know whether the market is trending or ranging, if ranging I will be patient because is not good to trade a quiet market, so I have to wait for the market to pick up a direction.
TRENDS
After knowing the market structure, whether it's ranging or trending, if it's trending, I will like to know the direction of the trend if it is an upward trend or downward trend, having known the direction of the market price and trends are mostly known in higher timeframe because it gives a larger picture of the market.
TIMEFRAME
The time frame to work on is very important as a trader we don't just go to all timeframe to work, the time frame we work on depends on the type of trader we are for example am an intraday trader (short term), I will have to go the 30min timeframe to check my current trends then go to 5min or 1min to enter my trade.
TYPE OF PATTERN AND INDICATOR
Personally, I will like to combine both pattern and indicator together so as to have a very perfect entry.
For me to take an entry I will like to spot a Head and shoulder pattern on the chart and I will make sure its a real Head and shoulder pattern then allow it to retest the support and resistance line on the bounce up or down to take my entry.
Secondly, I will like to confirm or fitter my entry with the stochastic indicator because the lines of these patterns move with real-time, for a buy entry I will Allow the be oversold then wait for a reversal cross to take my entry and a sell scenario I will make sure the market is overbought then wait for a reversal cross to take my entry. IN TRADING PATIENCE IS VERY IMPORTANT
MERGING CONFLUENCE
Everything mentioned above has to be combined together to form a perfect entry anything can't be left out or overlooked because all had to work in line with each other, that was why I said earlier that patience is very important because it takes patience to wait for all the conditions to be met before taking our entry
ENTRY AND EXIT POINT
As traders, we must be conscious of our entry and exit point, personally, when the market has respected my confluence I take my entry with a reasonable risk-reward ratio, and for my point, I use like four factors for my exit, I make use of support and resistance when the market is ranging when am spotting a reversal signal and lastly, I obey my risk-reward ratio.
- BUY TRADE


- SELL TRADE

CONCLUSION
At the end of the very impactful lecture, I pointed out the fact that using moving averages alone is not enough in taking any entry but we have to combine with one or two indicators to filter our entry so as to avoid fake outs.
Another thing that was noted is patience as a trader, we have to wait for all our confluence to form before taking orders to earn more profit and to earn it more steadily.