
- What is your understanding about Triangles in Trading. Explain all forms of triangles in your own words. (Screenshot required)
- Can we also use some Indicators along with it Triangle Patterns? Explain with Screenshots.
- Explain Flags in Trading in your own words and provide screenshots of both Bull Flag and Bear Flag.
- Show a full trade setup using these Patterns on any Cryptocurrency chart. (Ascending Triangle, Symmetrical Triangle, Bear Flag)
- Conclusion

INTRODUCTION: Good day @sachin08 and congratulation on your appointment as a professor in the Steemit Crypto-academy. Enjoy as you read my homework post on Recognizing Simple Patterns in Trading.


Triangles in trading: Triangle forms as a result of an impulsive movement of the market price to the downside or to the upward side and after this impulsive movement a range in market price forms in form of sideways and after the ranging all traders wait for a breakout in market structure to take a buy or sell entry, but in this case, a trader has to be patient enough to wait for the breakout at the resistance or support line then take an entry, in fact, some traders wait for confirmation and the confirmation is that they wait for the price to retest that resistance or support line the take the entry.
We have three types of triangles which I will be emphasizing shortly, the type of triangle formed gives a kind of signal of where the market is going, we have:
- Ascending triangle
- Symmetric triangle
- Descending triangle


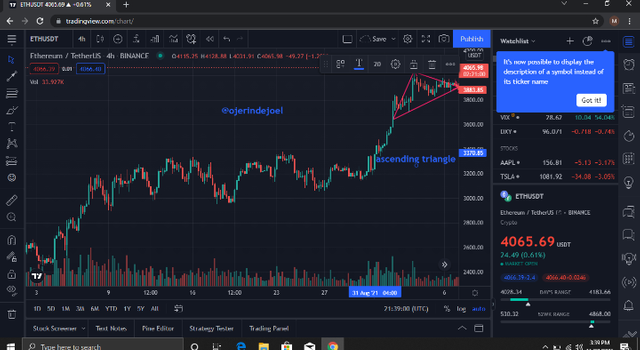
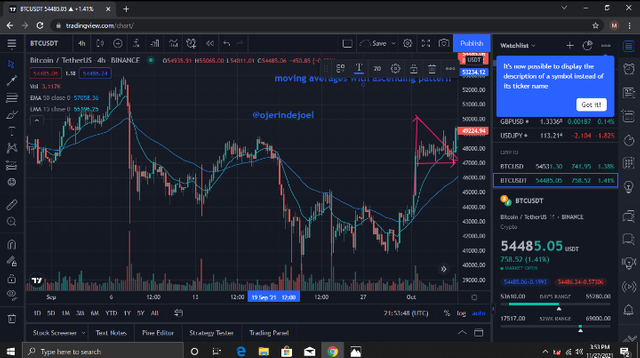
An ascending triangle is formed where we have a movement sideways to the right-hand side and the price does not bounce off above the resistance and at the same time, it does not bounce of below the support, in which after which this pattern is formed a trader is expected to wait for a breakout before taking and entry.
Also, an ascending triangle is a bullish continuation signal in which as the market bounce to break the resistance there will be a continuation in trend.


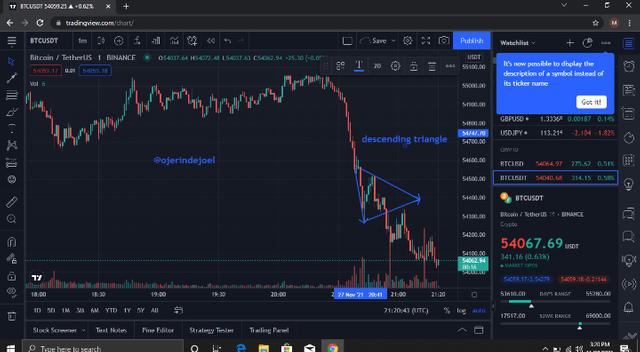
Descending triangle is the reverse of an ascending triangle, it is mostly found in a downward trend whereby the market price form a sideways pattern and it doesn't bounce off the support and resistance. The same way we trade ascending by waiting for a breakout the same way we need to be patient before taking the trade-in order not to make losses.


Symmetric Triangle is a bit different from both the ascending and descending it also moves sideways as the other two earlier mentioned, it bounces to the resistance and also bounces back to the support.
When symmetric triangle is spotted on a chart it can break out either way either to the downside or to the upward side then we take our entry, if it to be me I will want a confirmation which is waiting patiently for the market price to retest the support or resistance then I take my entry.


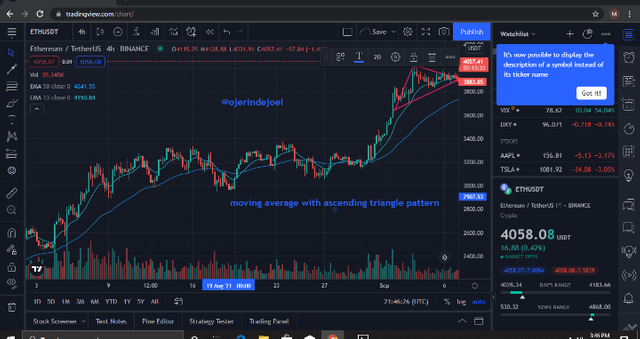
Yes, we can use indicators alongside with triangle pattern to confirm our entry, personally, I will suggest a trader use moving averages bother 13 and 50 moving averages in such a way that when the 50 moving average crosses the 13moving average upward or downward and there's a breakout in the triangle pattern then we take our entry because the moving averages have served as confirmation.
And in trading, it's very important to always have at least two confluence that is combining both indicator and candlestick patterns in other to have a good technical analysis before taking an entry in other not to fall victim to fake-out.


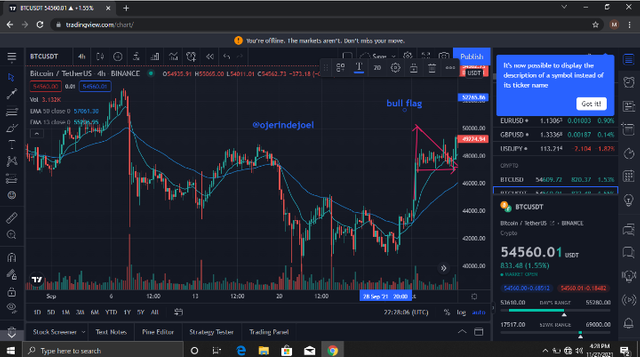
flags are continuation patterns of a trend which forms where a strong movement in the market prices either upward or downward then goes sideways to form a triangle, the strong movement in price with triangle pattern makes it a flag. There are have two types of flags which are;
BULLISH FLAG
BEARISH FLAG
BULLISH FLAG
The bullish flag is an uptrend continuation pattern that forms as a result of a strong bullish move to the upward side and a ranging to sideways forming a triangle and after forming the triangle we expect a breakout at the resistance then we take our entry.
BEARISH FLAG
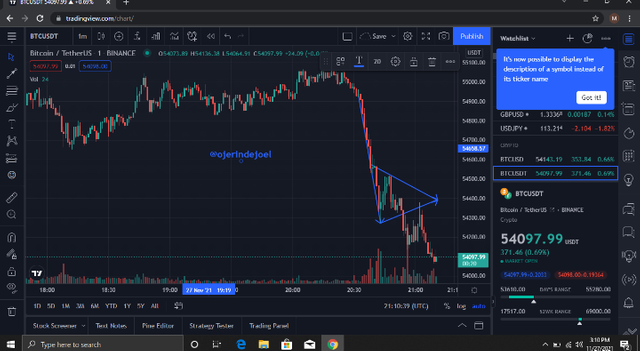
Bearish flag is mostly found in a downtrend and it's a bearish continuation that forms as a result of a strong bearish move downward and a range in market price forming a triangle, the combination of the strong bearish movement and the triangle form a flag then we wait for a breakout we make our entry.


- I notice a range in the market price
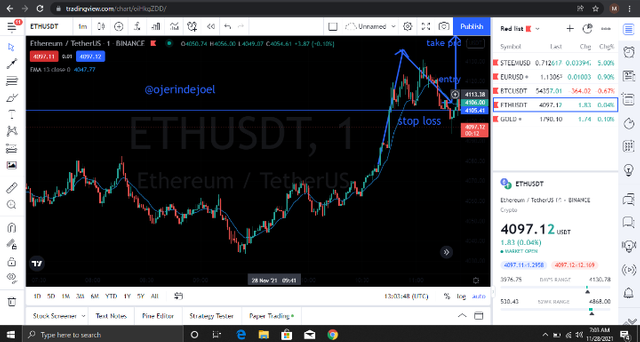
- I drew out the resistance and support
- As soon as it breakout the resistance line
- I took my enter above the resistance and stop loss below the support.
SYMMETRIC TRIANGLE
- I waited patiently for the market to form a symmetrical triangle.
- It Boyce off the support and at the same time bounce off the resistance.
- I waited patiently for the breakout below the support.
- I took my entry below the support and my stop loss above the resistance.
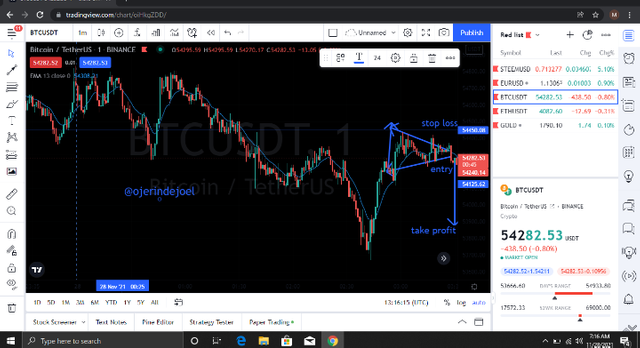
BEAR FLAG
- I notice a strong bearish movement downward
- And a triangle started forming sideways
- I waited for a breakout below the support
- I took entry below the support and my stop loss was above the resistance.
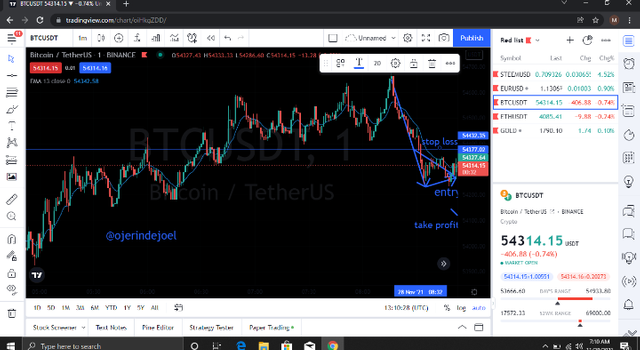

CONCLUSION
Finally, triangles are very good in trading, but traders need the patience to allow it to form properly and wait for it to break out before taking an entry and it's best we combine it with an indicator to make our analysis strong and effective, then we get a good result.
All the three types are triangle patterns mentioned are effective, what we need to do is to spot the correct pattern because when they are forming, they look a bit tricky.
NB: All screenshots are from trading view.