

(1)Explain and define in your own words what the Donchian Channels are?
(2)Does it explain in detail how Donchian Channels are calculated (without copying and pasting from the internet)?
(3)Explain the different types of uses and interpretations of Donchian Channels (With examples of bullish and bearish trades)?
(1)Make 1 inning using the "Donchian Channel Breakout Strategy" and make 1 inning using the "Reversal and Retracement Strategy". You must explain the step by step of how you analyzed to take your entry and make them into a demo account so I can evaluate how the operation was taken.

INTRODUCTION: Good day lovely steemians, how was your holiday? I trust we did maximize it. I wished everyone a happy resumption back to the academy and a successful season ahead. Today, I will be writing my homework on a topic Strategy and use of Donchian Channels lectured by professor @lenonmc21. Enjoy!!! as you read.
Theory


Donchain channel is an oscillator used for determining trends and volatility of market price developed by Richard Donchain in the year 1950.
Donchain channel is an interesting indicator used in determining where reversals are bound to happen. it is very similar to the common Bollinger band as they both have the same structure but with some differences which are the oversold and the overbought region. Just like a stochastic indicator, donchain is found on the main chart and it is a smart indicator that alerts traders when there's a change in trend and the direction the market is going, it has three lines calculated by moving averages which is the calculation of previous candlesticks. it is characterized by a middle line called the middle range band and the other two upper and lower band all these three lines have their special functions and meaning.
The upper and lower band as earlier said denote oversold and overbought region In such a way that if the candlesticks cross and close above the middle band to the upward region, it indicates that the bulls are taking control of the market and if the candlesticks cross and close below the middle band, it gives a sell signal.
This indicator is also used to know the volatility of the market by giving a ranging movement in market price. when the three lines come in close contact, this means the volatility is low but when they are far from each other, it depicts high volatility. It is not advisable to use only this indicator for an entry but to combine it with price action to have a solid analysis because indicators are not 100 percent accurate.


Donchain channels is the calculation of the periods of the past candlesticks depending on the selected time frame. we will be doing little calculations to have more in-depth knowledge on how donchain channels work.
CALCULATIONS
This will be for illustration purposes the calculation can be done using a different alphabet to denote our parameters.
Let the period on the upper band = P1
Let the period on the lower band = P2
The middle band is the difference between the upper and lower band divided by two.
(P1 - P2) / 2 = middle band
If our P1 on 30 minutes timeframe = 100 period
and P2 = 30 period
The middle band = (100 - 30) / 2= 35 period
And a typical average mostly used is 20 periods which is in the range of a month's average if a day candlestick is been used.


USES AND INTERPRETATION OF DONCHAIN CHANNEL
Trend: Donchain channel is used for determining the current trend of the market in such a way that when the market price has gone above the middle line and as it retracing it does not close below the middle line, we can call it an uptrend and it best we check our trend in the higher time frame so as to get the accurate trend, this is also applicable for a downtrend in a reverse manner.
Reversal: Donchain channel is an interesting indicator that allows traders to know when a reversal in trend, it might be a bullish or bearish reversal, in that when the market price is in a downtrend as it starts retesting the middle band and eventually break that line and closes above the middle band, then as a trader we should start preparing to Lock our profit because a reversal might happen soon.
Volatility: Donchain is used in determining when the market is volatile or not. The volatility of the market ensures profit and loss. When the three lines which are the upper, lower, and middle bands come together almost touching each other, this gives a signal that there is extremely low volatility in the market and so the best thing is to stay away and wait for a breakout.
Key level or zones: It can be used to interpret key zones and levels which are the support and the resistance level. Traders tend to buy above the support and sell below the resistance. If the price break the support, it means there will be a continuation in the bearish direction and likewise, if the price also breaks the resistance, it also means a continuation in the bullish direction.
Bullish trade
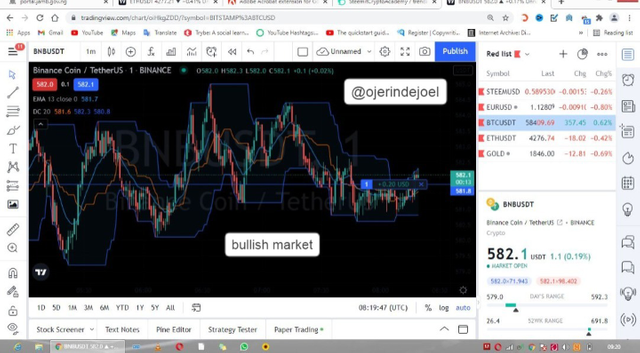
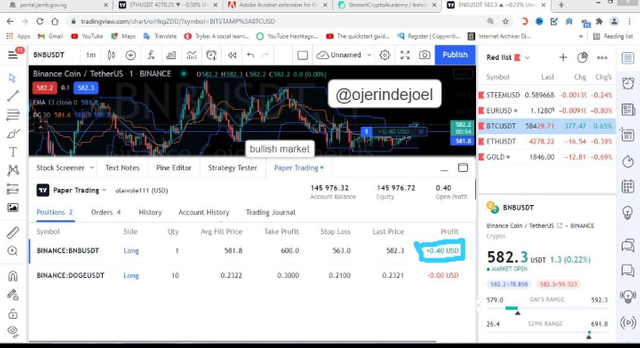

Bearish trade
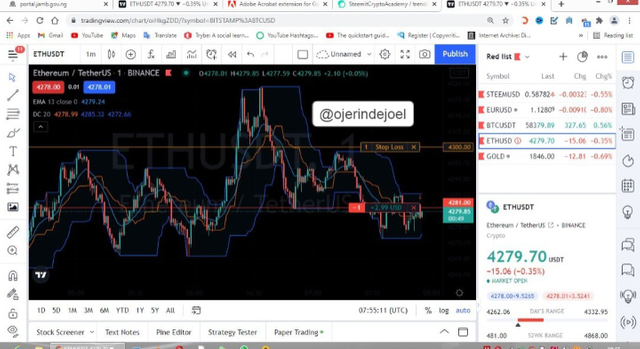
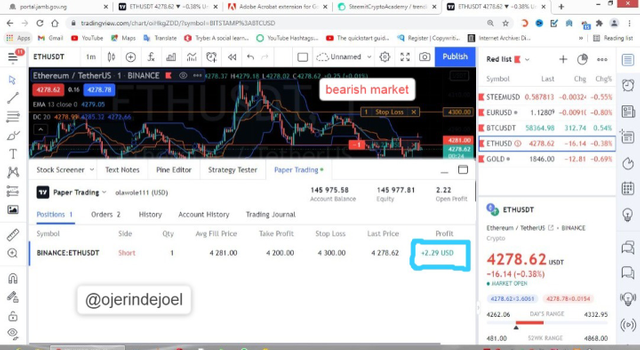
Practice


Breakout Strategy
I will be using ETHUSDT for my analysis and I had to patiently wait for the right time for my entry.
- My first action was to add the donchain channel to my main chart to have a good analysis.
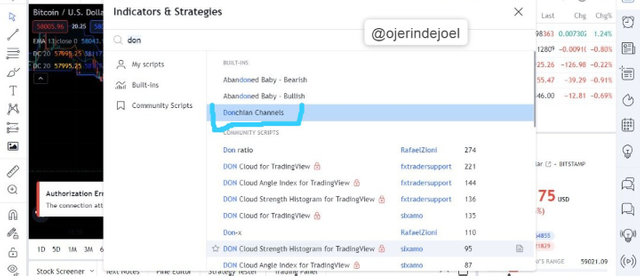
- I noticed that the market price was retesting the middle band so I had to patiently wait to see if it closes above the middle band.
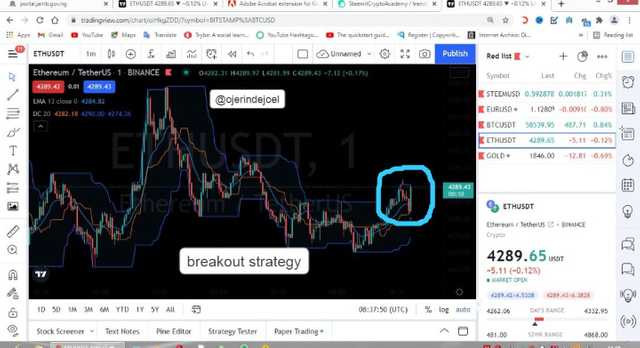
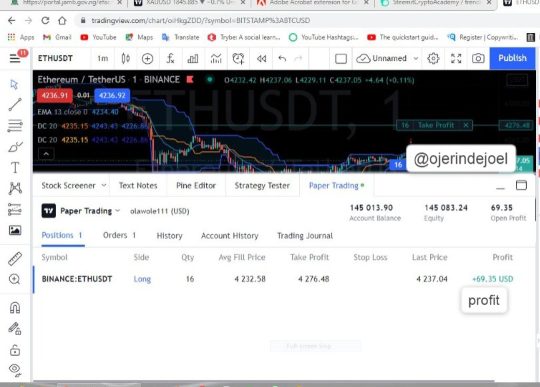
- I took my entry after the breakout and I got a profit of $69.35and I close my trade because I was actually doing scalping on 1-minute timeframes.

Reversal
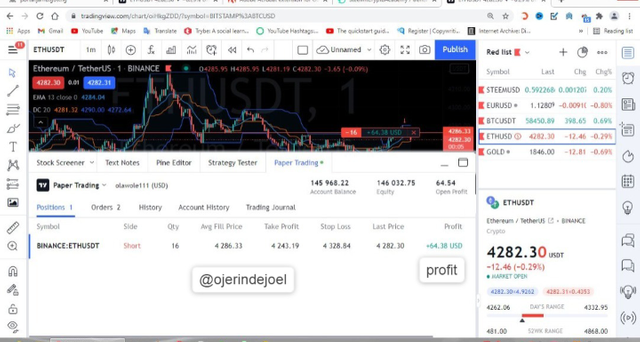
I will be using ETHUSDT to analyze my entry using the donchain channel.
- As earlier said, I added donchain indicator to my main chart.

- As soon as the price got to the upper band which is signaling overbought and closed below the middle band, I took a sell entry.
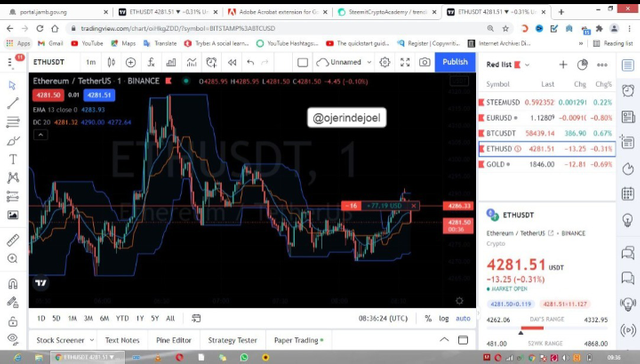
- I made a profit of $64.38 after the analysis using the donchain channel.

Retracement Strategy
Still using the same donchain channel on ETHUSDT for my retracement strategy entry.
- I added the donchain channel to the main chart so as to make my analysis.

Having watched the chart patiently, I waited for a retracement from the upper band.
As the price got to the middle band, I took a buy entry and it bounced back upward.
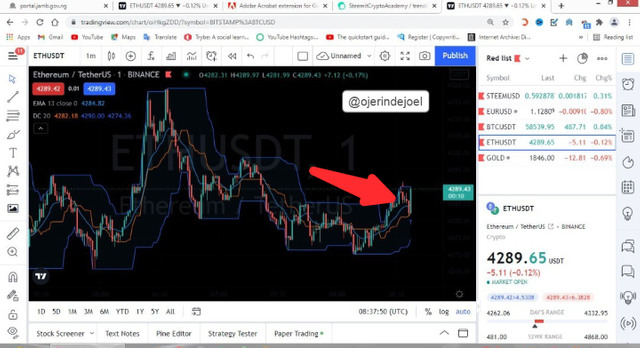
- As I took the trade it entered profit is $69.35, Then I closed the trade.


CONCLUSION
At the end of the lecture, I was able to learn how to make use of donchain channel for different purposes while trading, personally I will prefer donchain channel to Bollinger because it can be used for determining key levels which are very important in trading and it also shows the rate of the volatility of the market and trends.
I have powered up 150 Steem in the last 30days
My #club5050 status
@steemcurator02
Downvoting a post can decrease pending rewards and make it less visible. Common reasons:
Submit
@steemcurator02 @sapwood @steemcurator01 @reminiscence01 @lenonmc21.
It's been 6days and my two week 1 homework posts t has not been voted, what could be wrong?
Below are the link to the post
Understanding trends - Crypto Academy / S5W1- Homework Post for @reminiscence01
Strategy and use of Donchian Channels - Crypto Academy / S5W1 - Homework post for @ lenonmc21
Downvoting a post can decrease pending rewards and make it less visible. Common reasons:
Submit
@steemcurator02 @steemcurator01
Why do I have less vote despite scoring 9/10. This doesn't go with the new guidelines (grade score multiplies by 1.5 for beginners level). I will like to know if I didn't do something right
Downvoting a post can decrease pending rewards and make it less visible. Common reasons:
Submit