

(1) Explain in detail the advantages of locating support and resistance on a chart before trading.
(2) Explain in your own words the breakout of support and resistance, show screenshots for the breakout of resistance, use another indicator as a filter.
(3) Show and explain support breakout, use the additional indicator as a filter, show screenshots.
(4) Explain what a false breakout is and how to avoid trading at that time. Show screenshots.
(5) On a demo account, execute a trade when there is a resistance breakout, do your analysis. Screenshots are required.
(6) In a demo account, execute a trade when there is a support break, do your analysis. Screenshots are required.

INTRODUCTION: Good day @pelon53 and every member of this great community. Welcome to my homework post for season 6 week 3. This is a very insightful, detailed, and rewarding lesson. Thanks for imparting more knowledge.


Before I go ahead to explain the advantages of locating support and resistance on a chart, I will like to shed some light on what these keywords mean.
What are the support and resistance levels? The support level is a price level where a bearish trend is expected to halt or pause due to high demand or buyer’s dominance. The high demand is a result of the decrease in the price of the asset and this area is where traders tend to take a buy position in the market.
The resistance level is a price level where a bullish trend is expected to halt or pause due to high supply or seller's dominance. The high supply is a result of the increase in the price of the asset and also, this area is where traders tend to take a sell position in the market.
Support and resistance could be categorized into static or dynamic and this is dependent on how it is represented on the chart. The static support and resistance are represented with a horizontal line while that of dynamic is represented with a trendline.
The identification of these two levels is imperative to traders as they serve as potential entry or exit points and this is because whenever the price of an asset reaches a support level or a resistance level, it can only do two things one is to bounce back away from the support or resistance level, and the other is to violate the price level and continue in its direction until it hits or reached the next support or resistance level.
Knowing when to enter enhances one’s success rate or profit-making chances and also knowing when to exit the market saves one from making losses and thereby protecting one’s capital. The fact that the cryptocurrency market is volatile and predicting what the future hold is not 100% guaranteed, it will be better to know when to exit the market when the market trend goes against one’s prediction. For this, support and resistance are important.


Most of the time, the market price of an asset moves in a range and at this time the market is said to be ranging and not trending (neither in an uptrend nor downtrend).
Just a said earlier, the buyers are in control whenever the prices move upward and whenever the prices move downward, the sellers are in control. The resistance is the upper level at which the price is resisted and also, the lower price at which the price is supported is known as the support.
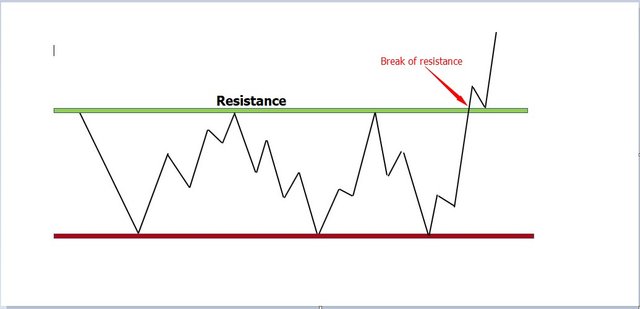
A breakout is said to occur when the price moves or breaks through a support or resistance level and then keeps moving in that direction.
A false breakout is said to occur whenever a price moves or breaks through an identified support or resistance level but does not have enough or adequate momentum to maintain its direction.
The resisting and support of an asset price are not forever as the price can break the upper range (resistance) and when this happened, the resistance will turn to support and also, the price can break the lower range (support) and whenever this happens too, the support will turn to resistance.


Below is a screenshot of the breakout of a resistance. The breakout of resistance is attributed to the market dominance of the buyers. The buyers continue to push the price higher to break off the previous high as the sellers are too weak to take over the market or resist the price as at the time the price hit the previous high.
From the ETHUSDT chart below, we can see that the price is ranging as it was been resisted by the resistance and supported by the support. Also, we can see how the price broke off the resistance and by doing so, turned it to support with the price being supported by the newly created support.
At this point, traders tend to take a buy position when the price retest the zone it broke off with a stop loss being placed below the broke off zone and take profit at the nearest resistance zone.
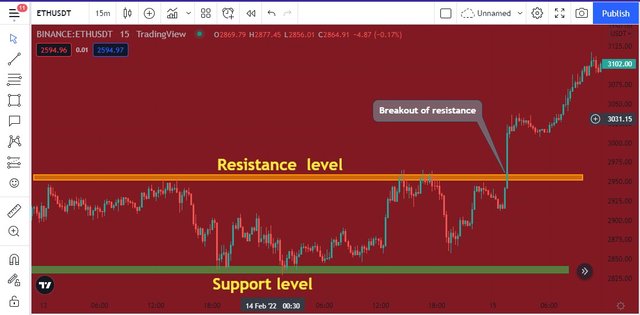
To filter the break of this resistance line, it is imperative for a trader to make use of another tool such as technical indicators in order to act as confluence trading as this will ensure making good trading decisions and not incur huge losses by being a victim of a false breakout.
In this case, I will be making use of the volume indicator. What we need to know is that if the breakout is not false, the volume should increase at the point of the breakout as this depict that the buyers are in so much control of the market.
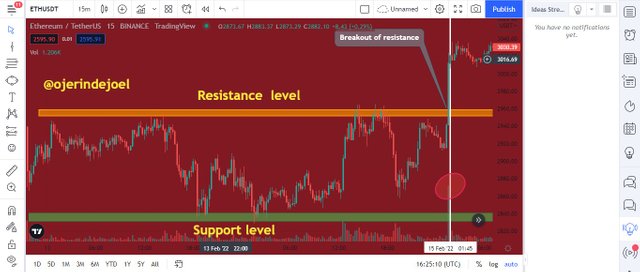
As we can see in the chart above, we can see how the volume increase at the point where there was a breakout in the resistance.


Just as I had explained earlier, the price of an asset is subject to change, and with this, either the support level or resistance level could be broken. In this section, we will the breakout of the support level.
The break off of the support level is attributed to the loss of power of the buyer as they could not push the prices upward when the price hit the previous low and this is also due to the market dominance of the sellers.

From the XRPUSDT chart below, we can see that the price is ranging as it was been resisted by the resistance and supported by the support. Also, we can see how the price broke off the support and by doing so, turned it to resistance and with the price being resisted by the newly created resistance.
At this point, traders tend to take a sell position when the price retest the zone it broke off with a stop loss being placed above the broke off zone and set a take profit at the nearest support zone.
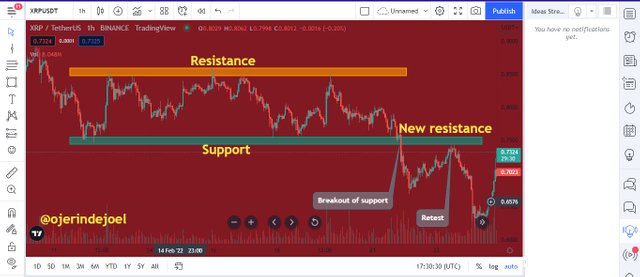
Just as said earlier, in order to filter the break of this support line, it is imperative for a trader to make use of other tools such as technical indicators in order to act as confluence trading as this will ensure making good trading decisions and not incur huge losses by being a victim of a false breakout.
Likewise, in this case, I will be making use of the volume indicator and we should know that if the breakout is not false, the volume should increase at the point of the breakout as this depict that the sellers are in so much control of the market.
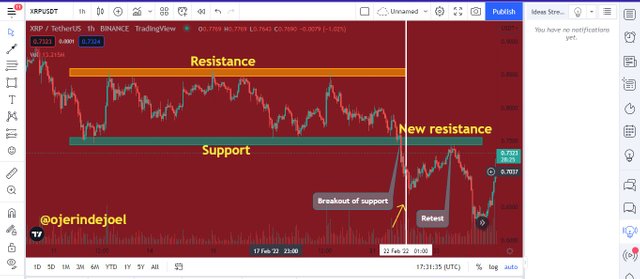
As we can see in the chart above, we can see how the volume increase at the point where there was a breakout in the support.


Understanding and knowing how to identify support and resistance level should be done together with being able to identify false breakouts as this is also very important and this is because not being able to identify false breakouts can lure one to making bad trading decisions which can incur huge loss.
We should know that not all breakouts are valid as sometimes, the price can break either the support or resistance level but later come back to ranging and this means that it is a false breakout and this is why traders should learn to combine technical indicators in analysis before making trading decisions.
It is essential to filter out these false breakouts in order to have a higher probability of success while trading. There are several methods that can be used to filter out false breakouts and one of them is the use of an additional indicator such as RSI, MACD, and Volume indicator. It is important for a trader to only make use of indicators that are useful for his or her trades.
Another analysis tool that is used in support and resistance for making great and efficient trading decisions is the Fibonacci Retracement. Also, it is imperative for every trader to make use of proper risk management.
There will always be the possibility of failed operations, the important thing is to be a profitable trader, that is, that you obtain more successful operations than failures, managing risk management.


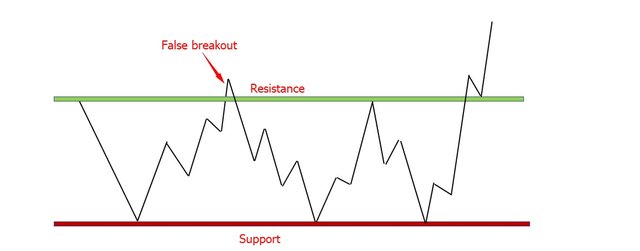
False breakout of the resistance is said to occur whenever the price crosses a key resistance and then pulls back after a short while. This situation is sometimes referred to as a Bull trap and it is a bull trap because once a trader is caught in it, he or she is likely going to incur losses.
In the case of the false breakout of the resistance, the price will break off the upper range, moves upwardly but then later comes back to the range. The prices continue to be resisted by the resistance back and it is been dragged by the sellers back to the lower part of the range (support level) just as we can see in the chart below.
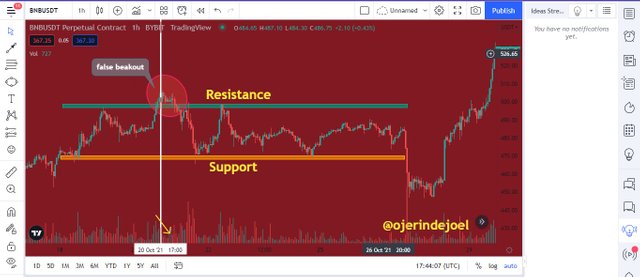
Let’s say I have opened a position without confirming the breakout, when the price reversed, I would have incurred some loss and this makes the confirmation essential.
Now, to avoid trading a false breakout, I will be making use of the volume indicator once again. A volume indicator is designed to show if a breakout is false or valid as in the case when it is valid, the volume will increase and if it doesn’t increase, the breakout is said to be false just as we can see in the chart above.
In the BNBUSDT chart above, we can see how the price broke the resistance but in the volume indicator we can see that the volume doesn’t increase and this means that the breakout is false.


False breakout of the support is said to occur whenever the price crosses key support and then pulls back after a short while. This situation is sometimes referred to as a Bear trap and it is a bear trap because once a trader is caught in it, he or she is likely going to incur losses.
In the case of the false breakout of the support, the price will break off the lower range, moves downwardly but then later comes back to the range. The prices continue to be supported by the support back and it is been dragged by the buyers back to the upper part of the range (resistance level) just as we can see in the chart below.
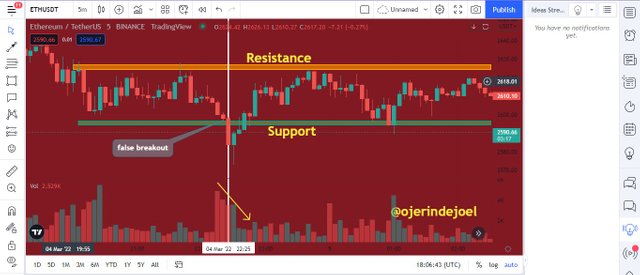
Also, if I had opened a position without confirming the breakout, as at the time the price reversed, I would have incurred some loss and with this, we can see how important confirming breakout is.
Now, to avoid trading a false breakout, I will be making use of the volume indicator once again. As explained earlier, a volume indicator is designed to show if a breakout is false or valid as in the case when it is valid, the volume will increase and if it doesn’t increase, the breakout is said to be false just as we can see in the chart above
In the ETHUSDT chart above, as there was a breakout of the support level, we can see that there wasn’t an increase in the volume and this means that the breakout is false.


CONCLUSION
The level at which a bearish trend is expected to halt as a result of high demand is known as the support level and the level at which a bullish trend is expected to halt as a result of high supply is known as the resistance supply.
To be candid, identifying a false breakout is not an easy job. as If it was, almost every day traders would be able to identify it and then make more profits. There are numerous ways one can use to avoid being caught up in such a situation in the market and one has is with the use of technical indicators.
Also, many false breakouts can be avoided by waiting for the candle to close after a breakout and this is whypatience is key while trading breakouts.
The use of **multi-timeframe analysis is also effective and can be employed in filtering out false breakouts as this will ensure a higher probability of success in one's trades.
Resumen y Recomendaciones:
TAREA INCOMPLETA, NO PUEDE PASARLA ASÍ.
Espero seguir leyendo tus publicaciones.
Calificación: 0
Downvoting a post can decrease pending rewards and make it less visible. Common reasons:
Submit