

1-Put your understanding into words about the RSI+ichimoku strategy
2-Explain the flaws of RSI and Ichimoku cloud when worked individually
3-Explain trend identification by using this strategy (screenshots are required)
4-Explain the usage of MA with this strategy and what lengths can be good regarding this strategy (screenshots required)
5-Explain support and resistance with this strategy (screenshots required)
6-In your opinion, can this strategy be a good strategy for intraday traders?
7-Open two demo trades, one of buying and another one of selling, by using this strategy

INTRODUCTION: Good day Steemians, trust we had a cool weekend, I will be writing an assignment based on RSI+ ichimoku strategy lectured by @abdu.navi03. Enjoy!!! As you read.


Relative strength index popularly known as RSI is a good indicator that is used to know the movement of market price this indicator was created by J. Welles Wilder in the year 1978 RSI is similar to Bollinger band but it only consists of one moving average and it is default setting is mostly 14 period and it has a high and low level which ranges from 0 -100 whereby we have ranges from 80 - 100 as overbought and 0-20 oversold and the alone helps investors to know when the bulls and bears are in control of the market.

Ichimoku cloud is a very good and useful indicator with five moving averages and all have separate functions, it was developed by Goichi Hosoda, Ichimoku cloud is used for knowing support and resistance of a market chart and it is used to know trends and momentum of the market.
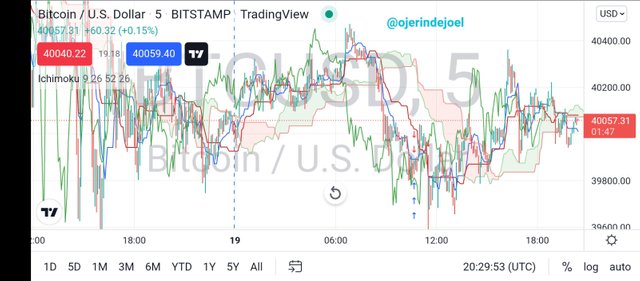
This indicator consists of five moving averages which are;
Tenkan-Sen line it has the lowest period mostly 9 periods and can also be called conversion line.
Kijun-Sen line which is a middle line in Ichimoku and also referred to as the baseline with 26 periods.
Chiou Span can also be referred to as a lagging line with 26 periods also.
Senkou Span consists of two cloud boundaries in which we have 26 and 52 periods.
Chikou Span this Line is also called closing price with 26 periods.
RSI+Ichimoku strategy
We have mentioned one or two things about RSI and Ichimoku but they both have flaws, that's not advisable to use them independently so combining them together with each other's attributes made them more powerful to take more positive entries.
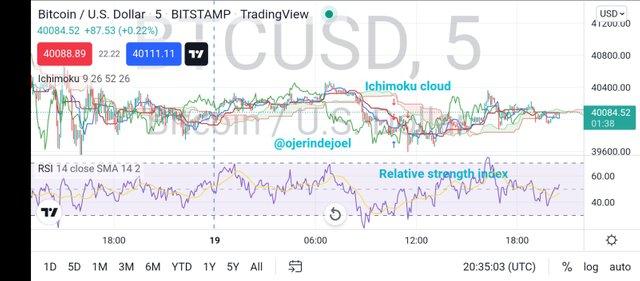
RSI+ichimoku strategy is used by an investor to know when exactly to enter the trade and to exit and this part makes trading more interesting because with this strategy mere looking at the chart you already know what's going on in the chart.


Flaws of relative strength index
As we all know that no indicator is 100 percent perfect they all have their advantages and disadvantages so we will be talking about the flaws of the relative strength index also known as RSI, relative strength index cannot be used to identify trends and we all know that trend is the key thing in trading cryptocurrency even investor need trends to need to determine the future price so as to know how and when to invest relative strength index cannot be used to determine the volume of the market, what I mean by volume is that they can't know whether we have so many traders trading or they are few
Ichimoku cloud
As good as Ichimoku is it still has its own flaws and is not 100 percent accurate that's why traders cannot just rely on only indicators we just have to combine other technical analyses to it make it more perfect, Ichimoku can be used in various ways but can't be used to know the movement of market price and knowing the movement of the market price is an important factor of taking a trade.
This fault in Ichimoku made crypto experts combine both relative strength index and Ichimoku to balance the flaws between both indicators for us to have a more perfect entry using the RSI+Ichimoku strategy.


A trend can be identified using the RSI+Ichimoku strategy in various ways firstly since we know that the relative strength index does not really support trends that means Ichimoku cloud will be doing most of the job and it can just be supported with a little bit of RSI.
To identify a trend there must be movement in the market and the market must be at least a bit volatile, to identify a trend using this strategy price must be above or below the Ichimoku cloud which is the two baselines of the Ichimoku, and to complement our analysis we can also check the trend, assuming the market is in an uptrend of ranging and RSI comes below the 30 and forms a double bottom after making some little corrections then hit the oversold region again, It can be classified as an oversold region.
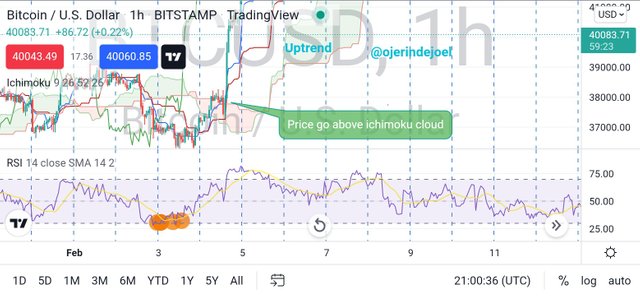
The image shows a clear picture of an uptrend using the RSI+Ichimoku strategy in which the market price crosses the Ichimoku cloud upward it indicating an uptrend.
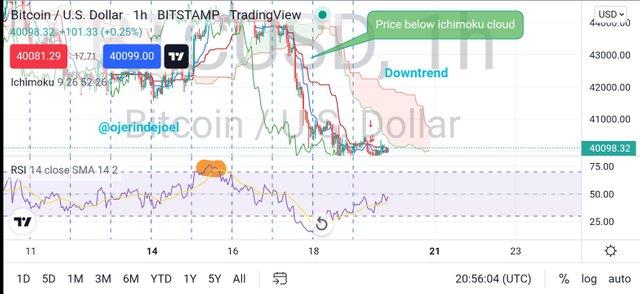
The image shows a clear picture of a downtrend using the RSI+Ichimoku strategy in which the market price crosses the Ichimoku cloud downward it indicates a downtrend


The use of moving average has been the bases of most crypto trade because it has a variety of functions and is very flexible, it comprises of three types which are the *simple moving average, **exponential moving average, and *weighted moving average and very easy to use but it has some flaws also that's why it is advisable that we combine moving average with another technical analysis to have a stronger entry.
When we combine moving average and RSI+Ichimoku it makes our entry more accurate and we will be able to enter the market with a tight stop loss by giving us an accurate trend direction, support and resistance, and the momentum of the market.
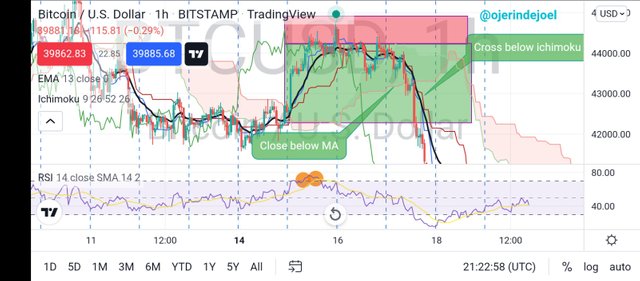
The image above shows how we can combine MA with the strategy so as to get a perfect entry,
As soon as I spotted a cross below the EMA 13 period and below Ichimoku cloud.
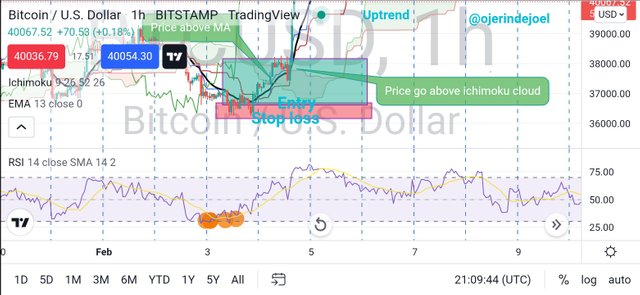
The image above shows how we can combine MA with the strategy so as to get a more accurate entry, As soon as I spotted a cross upward the EMA 13 period and upward Ichimoku cloud.


Both RSI and Ichimoku has a way of showing us supposed and resistance, support, and resistance zone are one of the keys zones that traders watch out for on a chart, and support and resistance give us an alert of reversal when price bounce off support and price is been resisted at the resistance zone.
Using the RSI+Ichimoku strategy to know support and resistance will be explained better with the images below.
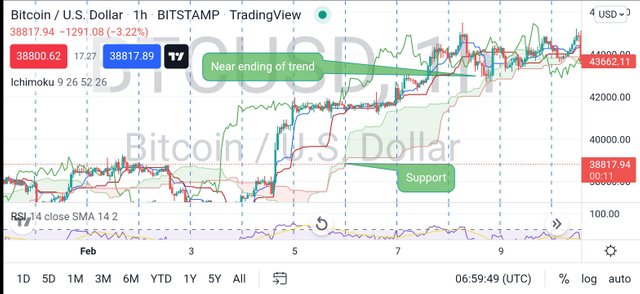
The image above describes how to use Ichimoku to determine support by making use of Ichimoku cloud by allowing the market price to cross the Ichimoku cloud above and when the candlesticks touch the Ichimoku cloud again it indicates that the trend is ending.
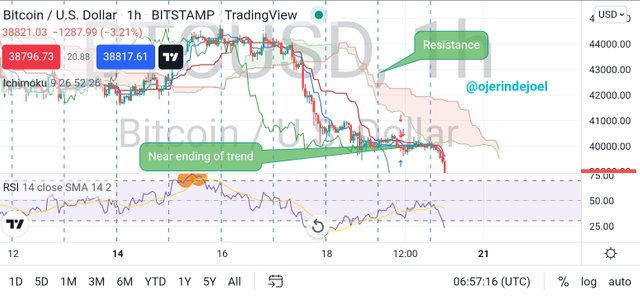
The image above describes how to use Ichimoku to determine resistance by making use of the Ichimoku cloud in which we wait for the market price to cross the Ichimoku cloud below and when the candlesticks touch the Ichimoku cloud again it indicates that the trend is ending.
SIDEWAYS
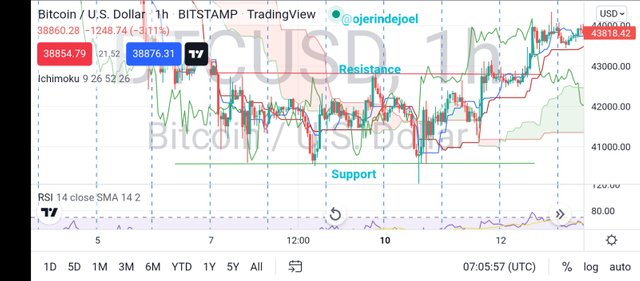
The image above indicate how sideways can be used to indicate support and resistance, how can this be done, what we need to do is to spot a sideway or ranging trend then we mark the rejection at the top meaning resistance and the rejection below meaning support


YES!
Intraday trading is known as short-term trading, trading within a short time with a lower time frame like 1hr, 30min, 15min, and 5min.
RSI+Ichimoku strategy is good for intraday traders especially when multiple low time frames are used one for analysis and the other for entry.
Most intraday traders make their analysis on 1hr timeframe and come a bit lower to 15min to take their entry, some images.
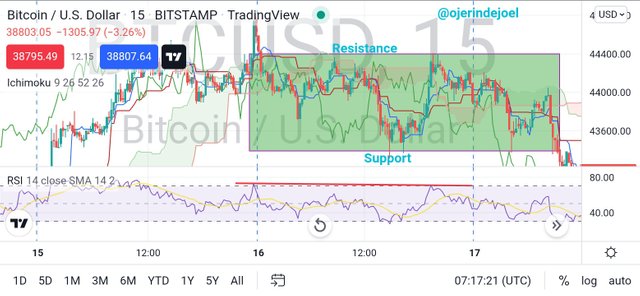
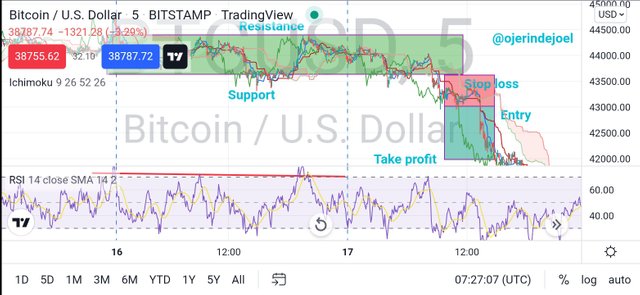
Using 15min timeframe for my analysis, spotted sideways support and resistance and I waited for the price to break the support with a little pullback then I went to a smaller timeframe which is 5min to take a sell entry.
I used multiple time frames to make a more productive entry and there's a saying that two heads are better than one.
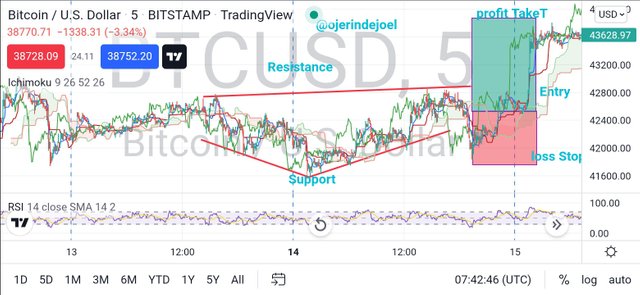
Using the same multiple timeframe procedure for resistance and support for a buy entry.


SELL POSITION
Firstly, I visited tradingview
I used multiple time frames to analyze my entry on BTCUSD 1hr timeframe.

- Having spotted a resistance at the top of the 1hr chart.
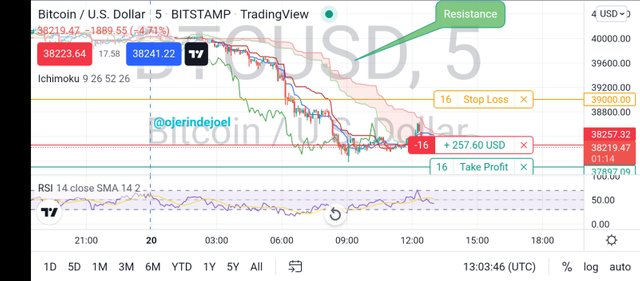
- Then I went to a 5min time frame to take my sell entry.

- At the end of the demo trade, I made a $257 profit
BUY POSITION
- Using the same multiple timeframes as used for the sell trade.
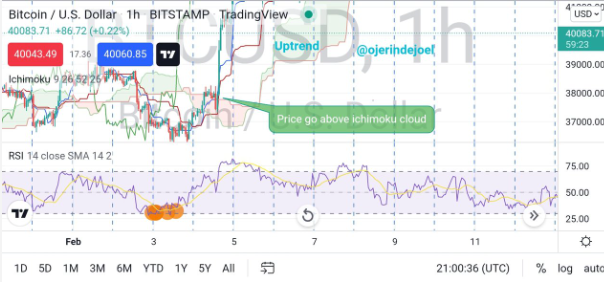
- I spotted a cross above the Ichimoku cloud on 1hr time frame of ETHUSDT
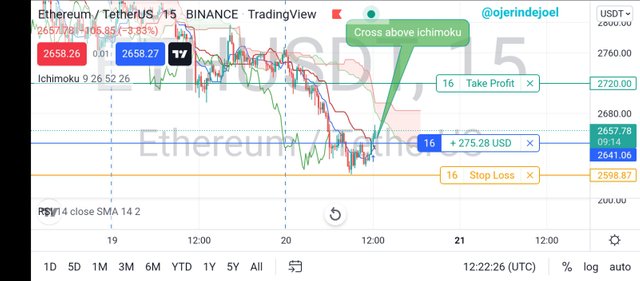
- Then I went to 15min timeframe to take my buy entry using risk reward 1:2.
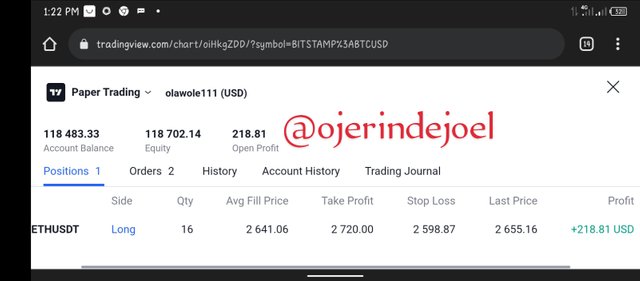
- At the end of the trade I made $218 profit.
CONCLUSION
RSI+ichimoku strategy is a wonderful one with the combination of relative strength index and Ichimoku was an idea brought by the crypto expert to balance the flaws between the two indicators, this strategy can be used to determine support and resistance, trends directions, momentum, and volume of the market.
Using this strategy proper risk management must be put in place so as to avoid loss of funds, and all that has been said need patience to form because not all the time we open our chart we met the strategy set for use we need to wait for it to form sometimes.
Thanks, professor @abdu.navi03 for broadening our knowledge on this new strategy.
NB: all unsourced images are from trading view.