Hello everyone welcome to my home work submission post were i will be discussing how support can become resistance and how resistance can become support first then secondly i will explain what is technical indicator, thirdly how to provide your view and provide trading view then in number 4 is what is 200 moving average and how we can trade or invest in 200 moving average so let's go starting with the first one.
1). What Is The Meaning Of Support Can Become Resistance & Resistance Become Support, When and Where set Buy trade, Chart Example?
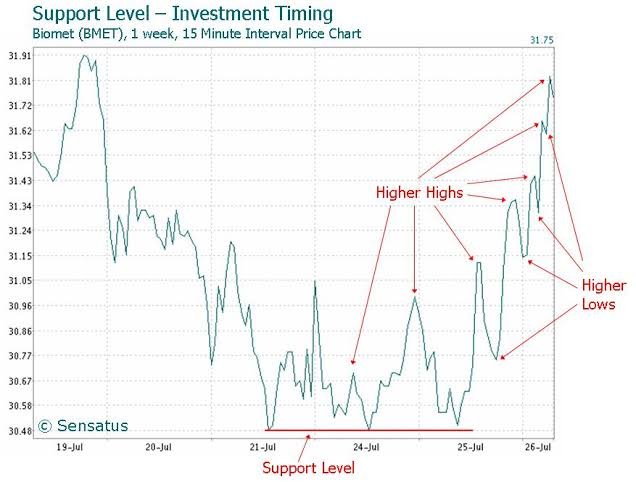
The meaning of support can become resistance and resistance can become support all comes down to the trend of the market, when support can become resistance is when the market is showing a bearish signal and how you will know this is simple first of all you will have to draw a line in the chart that indicate the support level which is the level that that asset will always bounce back from but when it goes down pass it then it is bearish and the support has become resistance which means the asset will find new support level while resistance can become support shows a bullish signal and to locate this is by drawing a line in the chart of that asset that the price can't go above then when the price finally breaks that resistance then the resistance will become support level.
The perfect place to buy is when the asset chart move to the support line then bounce back that is were you initiate a buy trade as you can see in the image above.
2). What Is A Technical Indicator?
Technical indicator are indicators that a trader sets in other to know the movement of the market and to also know he/her entry point and exist point meaning traders set indicators in the market chart of a particular asset to know whether it is safe to buy or sell.

In this picture above you can see you can see my indicators which the support level, resistance level, 200 moving average etc.
3).Provide your view and explore Trading View.
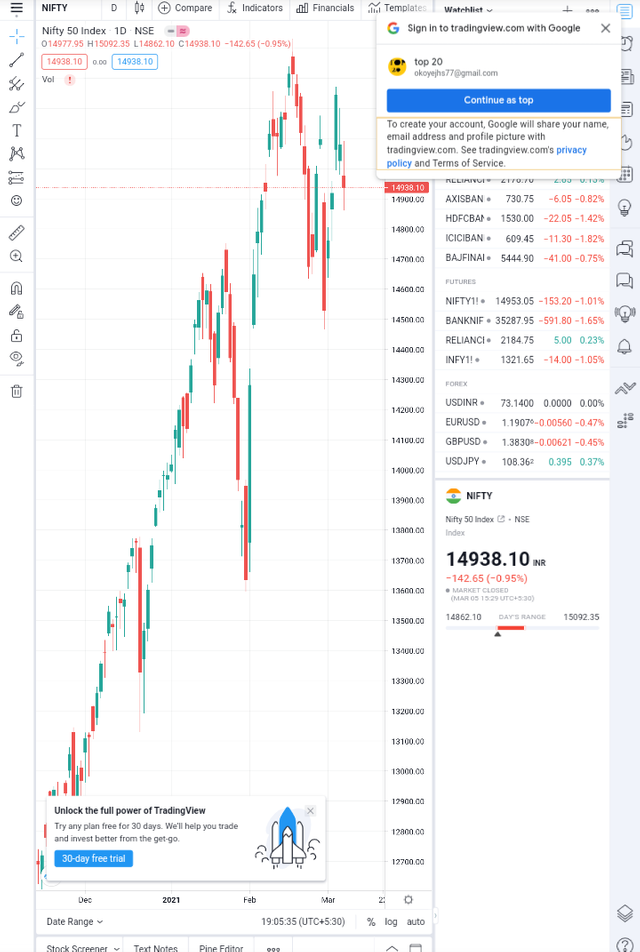
My view on trading view is not that deep because the exchange i use shows all the pattern i need but trading view looks like it is more advanced that is why i will be learning more about that site, it shows the chart right as you can see in the picture below.

4). What is 200 Moving Average, how and when we can trade/invest with the help of 200 Moving Average? Show different price reactions towards 200 Moving Average.
The 200 moving average is a very important indicator not because it show trade of 200 days but because it can be used to identify long term assets that can give you good returns.
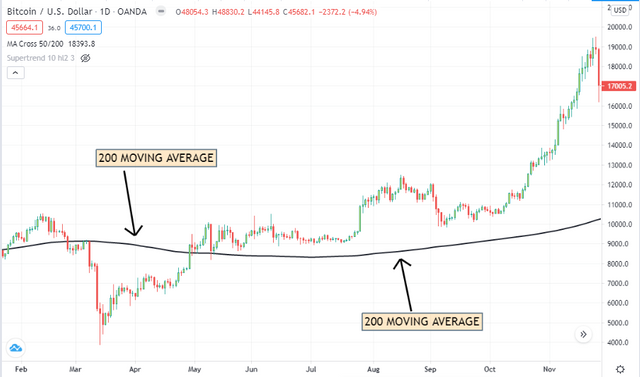
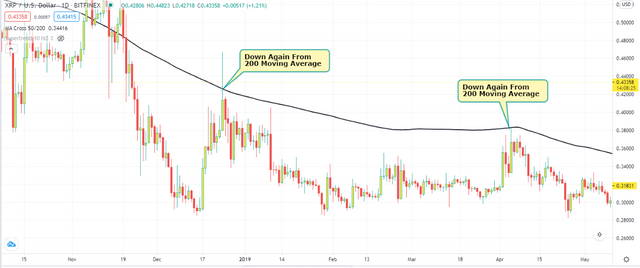
When you should trade with the help of 200 moving average is depending on the movement of the market in the past 200 days meaning if the market is breaks down the average line it indicates a bearish but if it bounce back on the average line then it is still bullish which you can use as an advantage in your trade.
In the image above you can see that the asset broke down the moving average then it was in bearish until it went above it again and continued on a bullish trend which makes that asset a long term asset.
In the image above can see as this asset broke below the 200 moving average it continued under the line that shows a bearish and a short term asset.
Conclusion
Thanks for reading and I hope i hope i explaned it very well Please @steemitblog and @stream4u, here is my task entry and thanks for reading.
Cc: @steemcurator01
Cc : @steemcurator02
Cc : @steemitblog
Cc : @stream4u
.jpeg)


Hi @okoyejoshua
Thank you for joining Steemit Crypto Academy and participated in the Homework Task 4.
Hoping that in the next Homework Task which is the final one, you will fulfill everything.
Your Homework task 4 verification has been done by @Stream4u.
Thank You.
@stream4u
Crypto Professors : Steemit Crypto Academy
Downvoting a post can decrease pending rewards and make it less visible. Common reasons:
Submit