Hello every one welcome to another homework task post for @stream4u one crypto professor, this is week 5 now which is one month and 1 week and i have learnt a lot by participating in this tasks and i hope you have too.
This week our professor @stream4u wrote about every thing that has to do with super trend indicator and the task of this week is about super trend indicator but if you want to read our professor article click this link any way let's dive into this week task.
What Is A SuperTrend Indicator?
A super trend indicator is a line that indicates the current price movement of a particular asset, it shows the buy opportunity when the line is below the candle sticks but when it is above it shows the opportunity to sell.
how to set SuperTrend on Chart?
I will be showing you how to setup super trend indicator but on the iq option mobile platform.
1st page
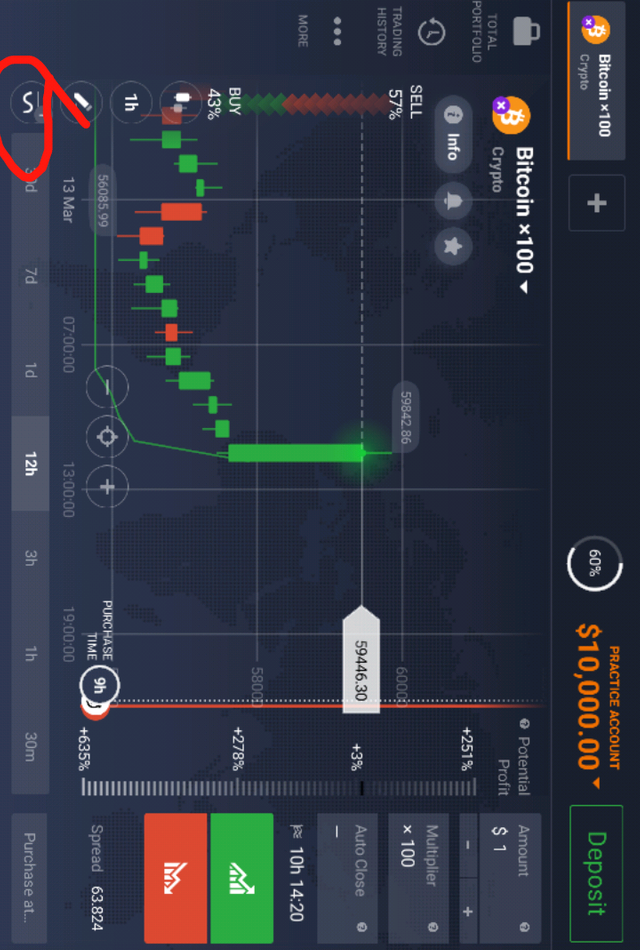
The settings page
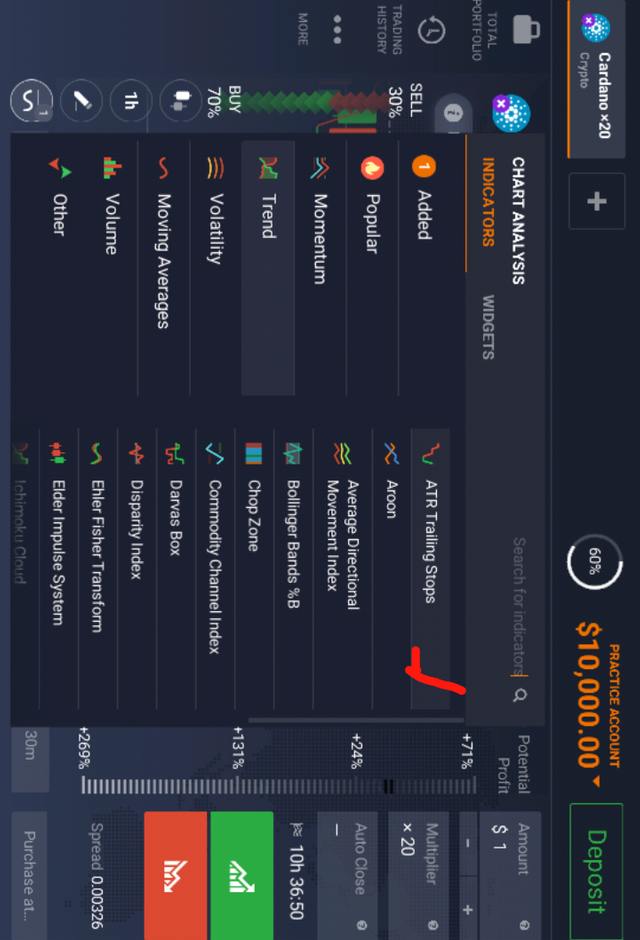
The setup page
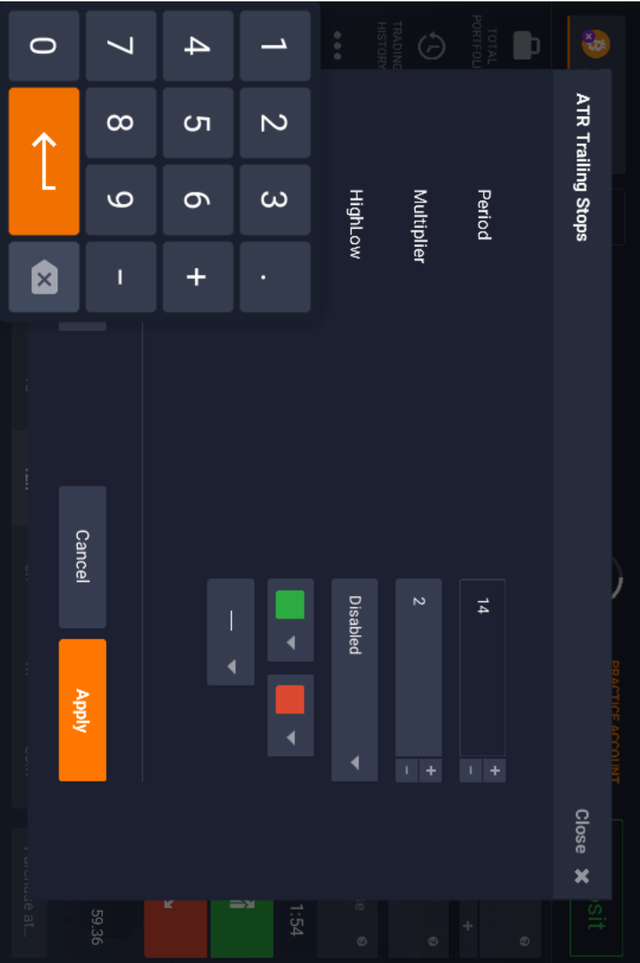
In the above image shows the settings but to get there you need to login first then click on the cryptocurrency you want to trade then after clicking it and you will be taking to another page that looks like the 1st image above then click the button with a lone logo, it should take you to the next page which you need to click the trend option then the ATR training steps button after that a page will pop up which includes the setup for your ATR but I will advice you to leave it with the basic configuration and then click the apply button and it will appear in your chart.
How SuperTrend Shows Buy-Sell Indications?
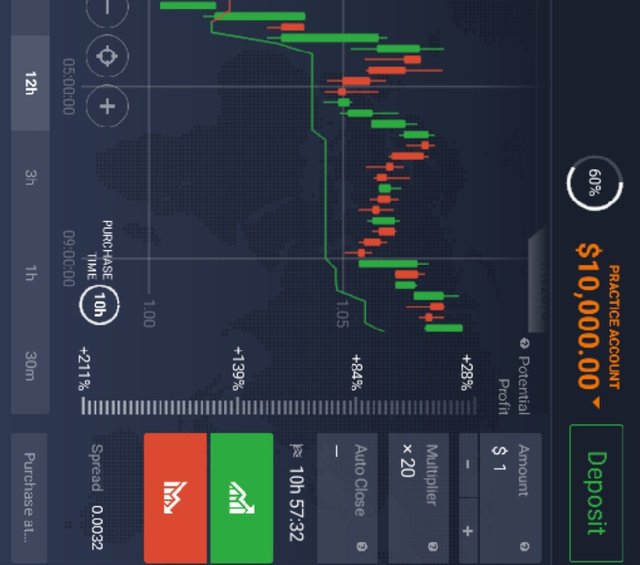
When We can place a Buy Trade with the help of SuperTrend Indicator?
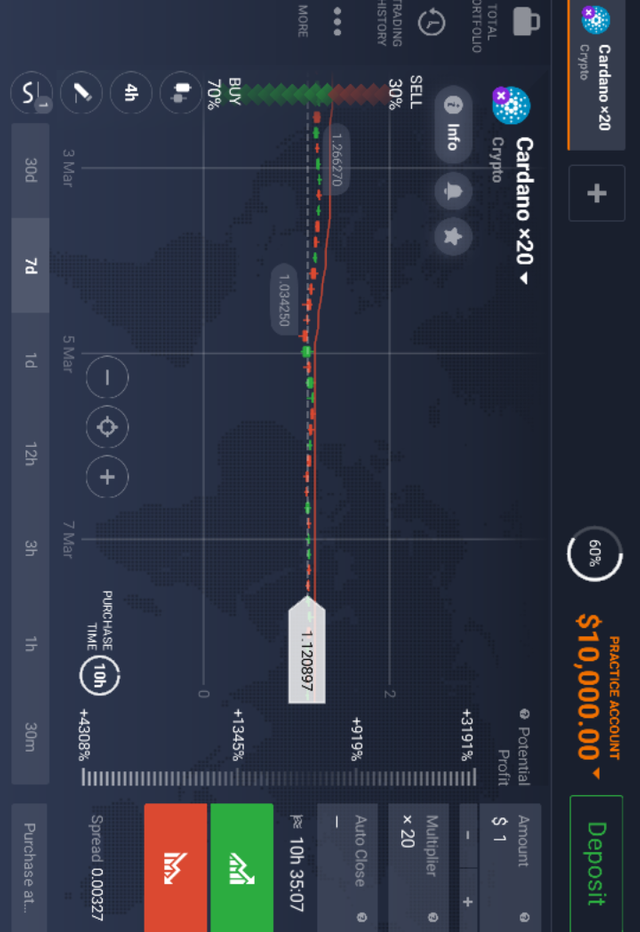
With the image above If you are about to enter a buy order at the right time by looking at your chart with the super trend indicator line it should be at the button of the candle stick and the candle stick should be close to the line before placing a buy order.
When we can place exit/square off, sell order with the help of SuperTrend Indicator?
With the above if you are about to enter a sell order, first of all make sure the super trend line is above the candle stick then you will identify the candle stick that is closer to the line then sell.
How false indications look in SuperTrend Indicator?
False indication
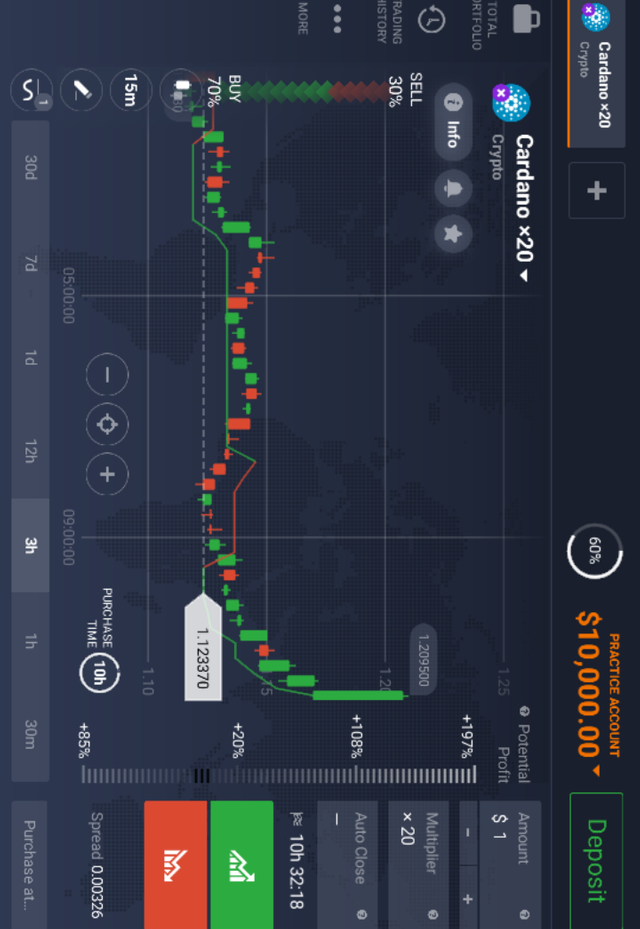
In the image above you can see the false indication by noticing how the line was down then switch to up then down again which makes it a false indication.
According to my view the Stoploss i will suggest.
The best stoploss on but has to be the support level which means you will have to find the candle stick that was close to the super trend line then you wait for the price to go close again before buying but sometimes it changes while in the sell it is the same thing you will find the candle stick that went close to the line and then wait for it to go close again before you sell because the line acts as a resistance but in can also change too.
Note: All the images I used for this article are screenshots.
Conclusion
I want to thank @steemitblog and @stream4u because through this process of doing this homework it has pushed me into doing researches.
Hi @okoyejoshua
Thank you for joining Steemit Crypto Academy and participated in the Homework Task 5.
Your Homework task 5 verification has been done by @Stream4u.
Thank You.
@stream4u
Crypto Professors : Steemit Crypto Academy
Downvoting a post can decrease pending rewards and make it less visible. Common reasons:
Submit
Thanks for verifying
Downvoting a post can decrease pending rewards and make it less visible. Common reasons:
Submit