This is a Re-post of my participation in the Steemit Crypto Academy Season 5 week 1 beginners course : Understanding Trends by @reminiscence01. The previous post here was marked but not supported by the right Upvote. Kindly reconsider with this opportunity.



Image self created on Canva
Understanding Trending market
A market trend can be described as the overall directional behavior of price over a period of time. A market price will only be known as a trend if it moves towards an Upward or downward direction. This directional price movement can be seen on the candlestick stick chart of the cryptocurrency pairs and the determinant of the overall trend is the accumulative action of the high swings and the low swings per time. The possibility of the market trend is bi-directional; that is it could either be trending upward or downward.
An Upward trend shows an overall directional increase in price of a Cryptocurrency pair and oppositely, a downward trend shows an overall directional decrease in price. An Upward trend is otherwise referred to as a Bullish Trend while a downward trend is also known as a Bearish trend. However, if the price action of the market is not directional, that is it could not be defined to go upward or downward. Then it is known to be Trendless or Ranging.
To understand the direction and strength of a Bearish or Bullish trend, one has to be consistently observant of the position of the candle stick formed. A bullish trend is formed by having a higher high and a higher low. That is, the candle sticks swing high above the previous high and it's low is higher than the previous low. Having this consecutively played over time would give an overall increase in the market price of the cryptocurrency. This price action dictates that the buyers are consistently in charge of the market.
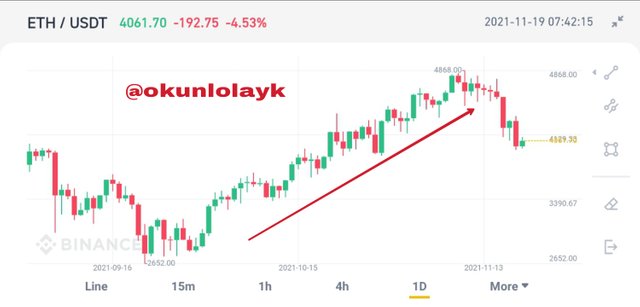
A Bullish Trend
A bearish trend technically flows in an opposite direction to the Bullish trend. A bearish trend has an overall decrease in price of a Cryptocurrency pair. A bearish trend is formed by a lower high and a lower low. This means the high of new candlesticks are formed lower than the previous high and the low is lower than the previous low. This gives an overall downward trend of price action. This downward directional behavior dictates that the sellers are consistently in charge of the market and bringing the price down.
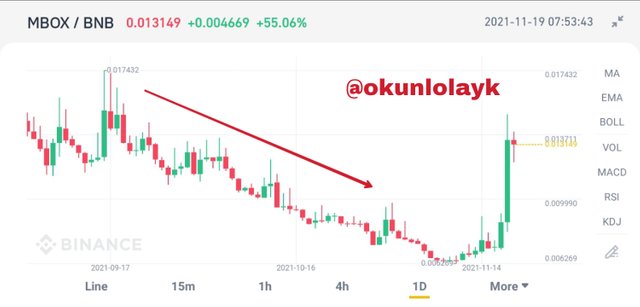
A Bullish Trend
Trend Identification for a Bullish and a Bearish Trend.
Market Structure.
Market structures in cryptocurrencies dictates the current state of the market. This shows whether the market is going uptrend or downtrend. It is known that this market structure is determined by the emotional wriggle of the participants of the market. The law of demand and supply also applies here. When the buyers take the market, they pull it uptrend buy raising the price of such asset and if the sellers dominate the market, they pull it downward and the price drop. The market structure can be seen to have ascending pattern like stairs leading uphill in Up Trending, and a descending pattern like stairs leading downhill in Down Trending.
The market structure of a Bullish Trend would have higher high and higher low than the previous stick. Inversely, the market structure of a Bearish Trend would have a lower high and a lowered low. However, the market structure might not proceed smoothly uptrend or downtrend but could shift away to redress and continue the trend. If this happens upward shift it could indicated a good time to pick profit and if it happens to be a downward shift, it could be a good time to enter the market.
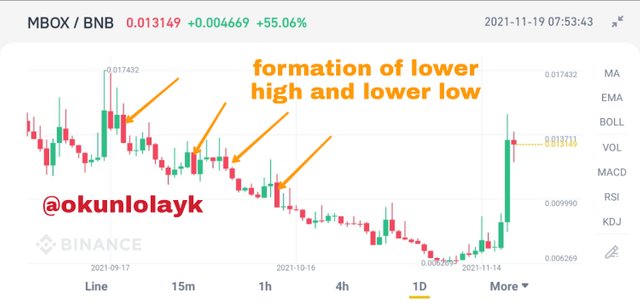
A Bearish trend forming new lower high and lower low market structure
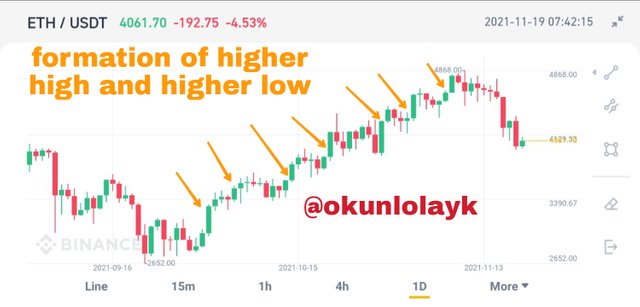
A Bullish Trend forming new higher high and higher low market structure
Trendlines
The Trendline is one of the indicators that helps to vividly visualize the trend of a market. This indicator draws a line along pivotal points in the market trend. Traders use this indicator to easily recognise the support or resistance level along the a trend per time.
In an Bullish trend, the line is drawn along at least two low points thus indicating a support floor for the trend. A continuous trend would have the price consistently bounce off this support at intervals and Trending upward.
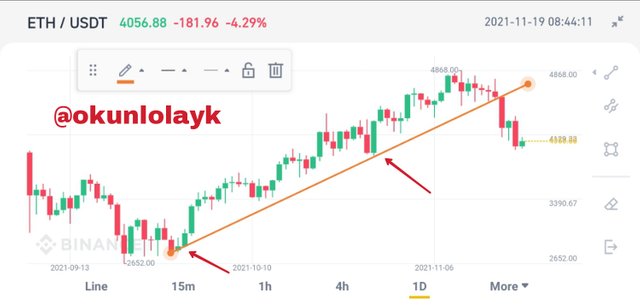
A Bullish Trend with Trendline drawn along it's Support level
In a Bearish trend, the trendline runs along at least two high point to indicate a resistance ceiling for the trend. The market trend is thus predicted to bounce down on reaching this resistance.

A Bearish Trend with Trendline drawn along its resistance ceiling
How to Spor Trend Continuation Using Market Structure and Trendlines for Bullish and Bearish Trend
A trend would continue as long as it follows the rules that makes it trending. That is a Trend would continue to go Upward if it create new higher high and higher low in its market structure. Antonymously, a trend would continue to go Downward if it creates new lower high and lower low.
A continuation would follow these trending guide and a temporary break off is allowed to happen under a restricted limit. This price action or continuation behaviour can easily be observed in the market structure. At some point in an uptrend, the traders pick profit and sell in the market. This pulls the price down to some extent and then retrace back to join the trend again. However, the trend would only continue if the new high is higher than the previous high and the new low is lower than the previous low.
A violation of this rule simply means the buyers could no longer push price to go up and thus shows a weakness in the trend and a possible trend reversal.
In a downward trend as well, the new low must be lower than the previous low and the new high must be higher than the previous low. Failure to create a retracement signal a weakness in the trend. That is the sellers could no longer pull the price lower and this could call for a reversal in the trend.
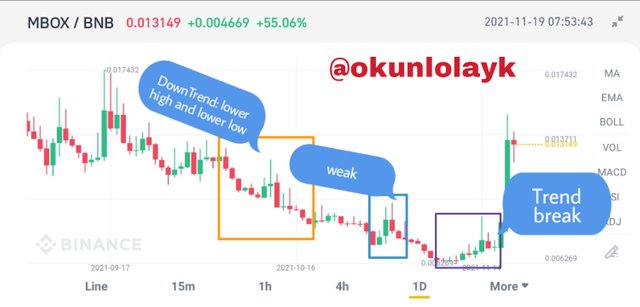
Bearish Market Continuation Identified by market structure
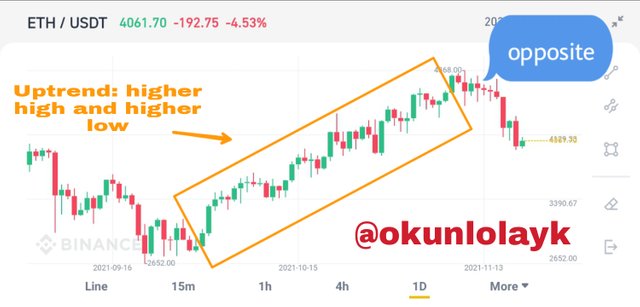
Bullish Market Continuation Identified by market structure
Trendlines can also be used to easily spot trend and know when there could be a reversal in the trend. Traders can use the trendline to draw a support floor for an Bullish Trend or a resistance ceiling for a Bearish Trend. They can easily know when the price is breaking of the trend and take necessary decision concerning their investment. Crossing the support line or resistance line could indicated the beginning of an opposite trend.
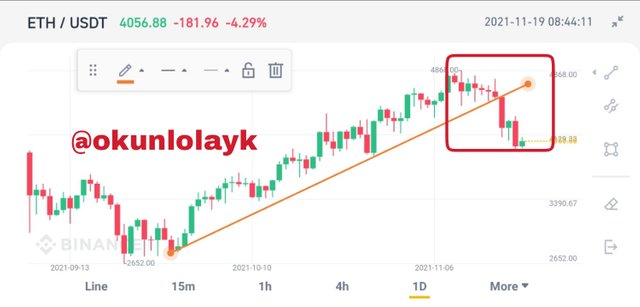
Bullish Market Continuation Identified by Trendline
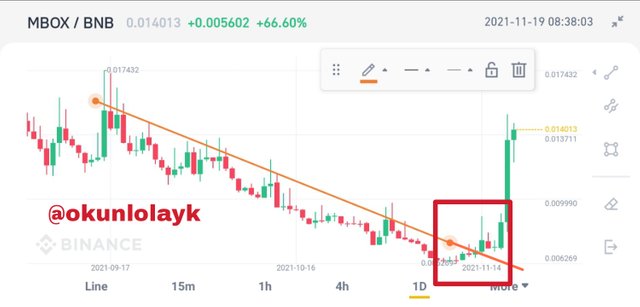
Bearish Market Continuation Identified by Trendline
An Example with a Crypto-asset chart
I will be using the WAXP/BTC market chart. At the time of writing and a hourly timing, the price action of WAXP/BTC is seen to trending in an Upward direction.

Bullish Market Continuation chart of WAXP/BTC Identified by market structure and Trendline
This can be seen through the market structure as the hourly high and lows appear higher than the previous. The uptrend support level can also be identified using the Trendline indicator. The market structure experience a number of flunctuations along this trend but definitely did not Cross down the support level to reverse. At the time of Writing, the last few hours still show an Uptrend market structure.
Conclusion.
Market trend helps traders to understand the direction of a Cryptocurrency pair in the market. It gives an overview and signals of what is happening or what could probably happen in the market per time. To clearly see the price action in the market, traders are to critically observe the market structure as the candlesticks are produced per time. Using this helps traders to identify if the market is trending, the direction at which the market trend is moving, breaks and retracement point as well as point of reversal. This helps to wisely enter a trade or pick profit in the market.
The Trendline is also an indicator that is used to identify a market trend. This draws line along a support or resistance. This clearly portrays the retracement points or reversal points.
Cc: @reminiscence01
Best Regards!!
