
It is with great pleasure to be a participant in this week assignment of professor @reminiscence01 which he taught about CONFLUENCE TRADING, I can say I understood the class and I have been able to give back base on my own understanding and the research I made. I stand corrected in any way as I might have come short in details of a particular question.

Explain Confluence trading. Explain how a trade setup can be enhanced using confluence trading.
Confluence Trading is a trading method where different trading tools are used together during trading operations. The trading tools that can be used in confluence trading includes market structures, market trendlines, bullish engulfing, Bollinger bands, and relative strength index.
There are so many trading tools that a trader can use to make profits in the cryptocurrency markets. But the downside is that using each trading tool as a standalone strategy usually results in failure as they are not reliable when used individually.
A signal can be given when using a single trading tool which immediately turns out to be false, thus leading the trader astray. This is where confluence trading is important. When a signal presents itself, it needs to be confirmed using another trading tool in conjunction with the one that gave the signal. In this way, a trader can be certain that a signal is true or false.
By combining two or more trading tools, confluence trading gives traders a better perspective of the market and a clear signal of when to enter and exit the market. The combination of trading tools should give the trader a better perspective of the market and a clearer signal of when to make an entry. Because of the nature of the cryptocurrency markets, it is very important that traders get a confirmation mechanism that is given by a trading tool.
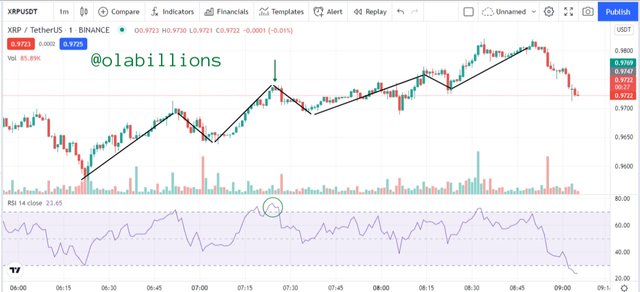
From the image above, we can see the use of one of the trading tools that is well known in the trading world. It is called the Relative Strength Index (RSI). We know what RSI is all about.
So on the chart, the RSI broke out of the 70 mark to signify an over-bought condition, so it was expected that a trend reversal is going to take place, but at last, the price continued reaching higher.
We can see when the RSI broke the 70 mark as indicated with the green circle shape. Then we can see the point marked with the green arrow to show when it was expected for the market to experience a trend reversal.
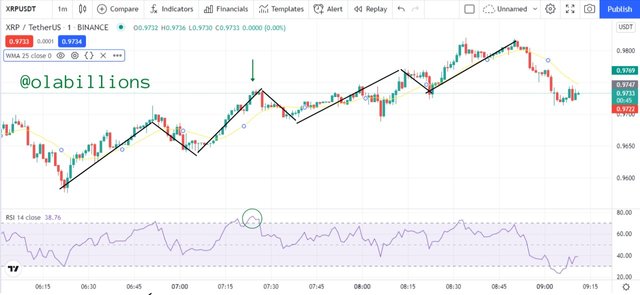
In this chart, I added another trading tool to use in conjunction with the RSI. It is the Weighted Moving Average (WMA). It is the yellow line that s close to the candlesticks.
It was used in conjunction with the RSI to give a confluence of signals. It can be seen that as the RSI indicated an overbought condition and thus give a trend reversal signal, the candlestick still moved above the WMA which tells that there is no trend reversal.
This means that using the RSI as a standalone trading tool to make decisions in the market at this point would have been detrimental, but with the addition of the WMA, we got to know that the initial signal given by the RSI was fake, thus allowing us to wait on the best time to open a market entry.
Explain the importance of confluence trading in the crypto market?
Strong validity: Because a trader needs to confirm if a signal given is accurate, a confluence of signals gives stronger validity.
Give traders confidence: Traders become more confident when trading using the confluence method. This is because during trading operations a trader would have to get a second confirmation on a signal initially received which gives some level of certainty to the signal that is given. Therefore, the trader can place a trade with a certain level of assurance.
It minimizes losses and potential risks: Because traders have to wait to confirm a signal that is given, traders wouldn't enter into positions at will thus reducing losses, at the same time traders would get to enter into trades with a potential of returns.
Helps traders manage their resources maximally: By employing the use of confluence trading traders can manage their trading resources. Traders won't have to be entering into the market anyhow thus increasing their losses. Traders wouldn't also have to make plenty of trading decisions as they have to always wait to confirm a signal before entering the markets
It increases the efficiency of trades: By applying the use of confluence trading the efficiency of the trader improves. The trader becomes more decerning to trading signals and also becomes very patient so as to have a second signal which is in confluence with the first signal, thereby increasing his overall trading efficiency.
Explain 2-level and 3-level confirmation confluence trading using any crypto chart.
The effectiveness of trades is directly linked to the number of trading tools that a trader uses while performing trading operations. There are different confirmation levels that traders can use when performing trading operations. They are usually 2 or 3 trading tools that traders can use to reach those confirmation levels.
2-level Confirmation
A 2-level confirmation confluence trading is simply using 2 different trading tools to confirm a signal. The trading tools can be of any type, this largely depends on the style and experience of the trader.
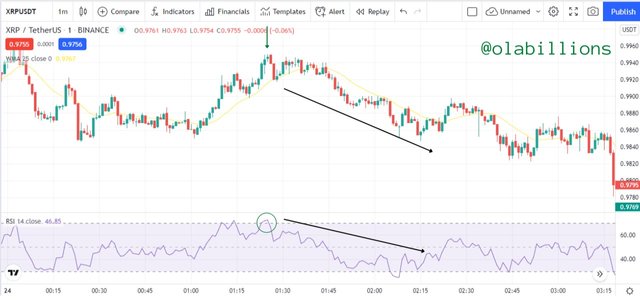
The image above is a 1 min chart of XRPUSDT. It has two trading tools on it. They are Weighted Moving Average (WMA) and Relative Strength Index (RSI).
The RSI gave a sell signal that the price is about to change direction. This is because it was above the 70 mark which is the overbought condition. But we can't rely on this signal alone, so it is necessary that another trading tool is used in conjunction with the RSI. This is where the WMA comes into use.
Looking at the WMA, we can see that as the RSI gave the signal, the price was still moving above the WMA line. At this point, the signal from the RSI may have been fake, but eventually, there was a time the price broke over the WMA line below to confirm the signal that the RSI gave.
By using the WMA with the RSI, there was a Confluence of signals amongst them which confirmed the initial signal given by the RSI.
3-level Confirmation
A 3-level confirmation confluence trading is simply using 3 different trading tools to confirm a signal. The trading tools can be of any type, this largely depends on the style and experience of the trader. By using a 3-level factor, the degree of accuracy in trading increases because we have to confirm three times the signal given.
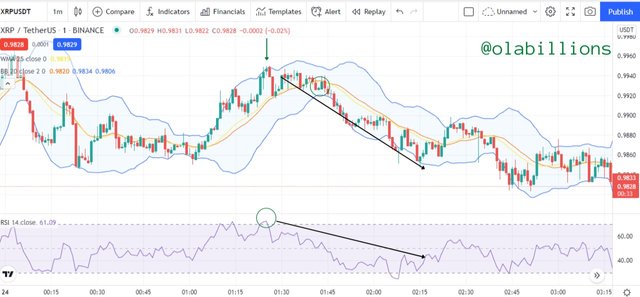
The image above is a 1 min chart of XRPUSDT. It has three trading tools on it. They are Weighted Moving Average (WMA), Relative Strength Index (RSI), and Bollinger Bands (BB).
By employing a third trading tool (BB) we can get better confirmation on the initial sell signal that the RSI had given previously.
We can see that at the point where the RSI was at the over-bought condition (70 mark), the price had hit the top line of the Bollinger Band. At this point, it was getting clear that the price is about to change direction. However, the price was still moving on top of the WMA.
But we can see that as the price hit the top line of the Bollinger Band the price had been gradually going down, it got to a point where it became apparent that the price is going down. This was when the price broke past the middle line of the Bollinger Band and the WMA. Also, the WMA crossed over the middle line of the BB to the downside. We can see the crossover captured by the green circle shape on the candlestick.
Analyze and Open a demo trade on two crypto asset pairs using confluence trading. The following are expected in this question. a) Identify the trend. b) Explain the strategies/trading tools for your confluence. c) What are the different signals observed on the chart?
In this exercise, I shall be performing two demo trades using the 2-level and 3-level confirmation confluence trading. I shall be using them for a bullish and a bearish trade.
Bullish Trade + 3-level Confirmation
This is a trade that involves the use of the 3-level confirmation for a bullish trend. The three trading tools that were used is the Relative Strength Index RSI, Weighted Moving Average WMA, and the Bollinger Bands BB
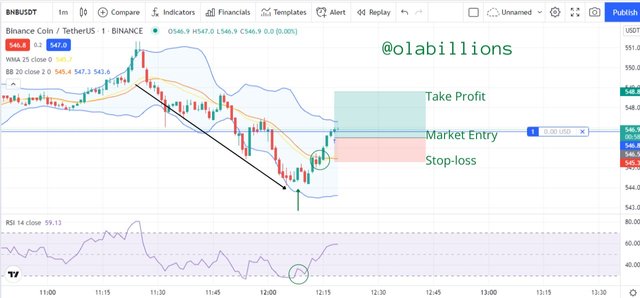
From the chart, it can be seen that the RSI had reached the 30 mark which is an oversold condition. This also gives a signal that the price is about to change direction to the upside.
But we wait for confirmation with the other two indicators. As at the time the RSI hit the 30 mark, the price just touched the bottom band of the BB, then it started moving upwards, at this point the price was still below the WMA.
Then it got to a time when the price broke out of the WMA to the upside and at the same time broke out of the middle band of the BB to the upside too which gave a signal that is in confluence with the RSI, thus giving a strong indication of a buy signal.
So I placed a buy order and put my stop-loss just below the middle band of the BB and placed my take profit at a ratio of 1:2.
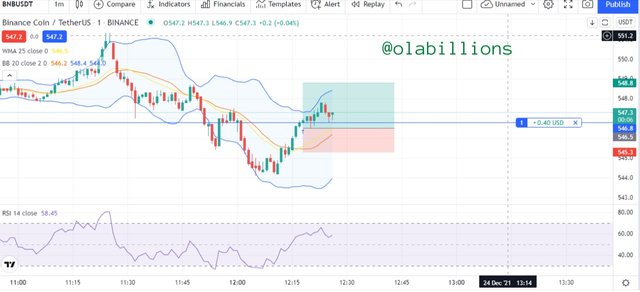
This is how the outcome of the trade finally happened. The trade was executed in a cool way.
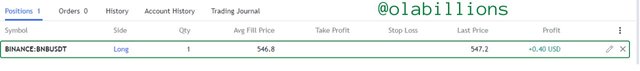
These are the details of the buy trade in the trading history.
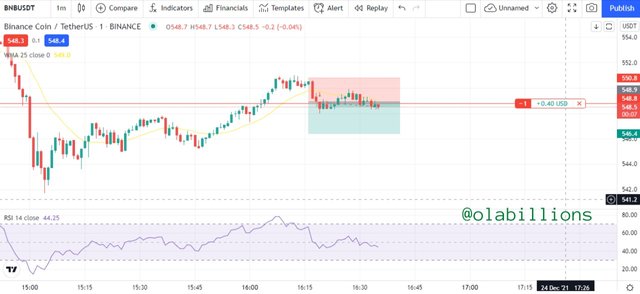
Bearish Trade + 2-level Confirmation
This is a trade that involves the use of the 2-level confirmation for a bearish trend. The two trading tools that were used are the Relative Strength Index RSI and the Weighted Moving Average WMA.
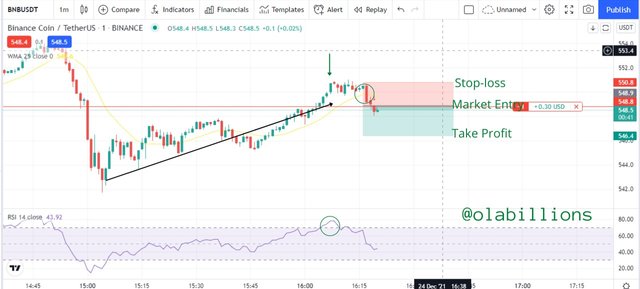
From the chart, it can be seen that the RSI had reached the 70 mark which is an overbought condition. This also gives a signal that the price is about to change direction to the downside.
But we wait for confirmation with the WMA indicator. As at the time the RSI hit the 30 mark, the price was still moving above the WMA.
Then it got to a time when the price broke out of the WMA to the downside which gave a signal that is in confluence with the initial signal given by the RSI.
So I placed a sell market order and put my stop-loss just above the WMA and placed my take profit at a ratio of 1:2.
This is how the outcome of the trade finally happened. The trade was executed in a cool way.
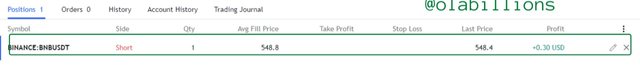
These are the details of the buy trade in the trading history.
Conclusion
There are so many trading tools that let traders become profitable in the cryptocurrency markets. However, using these tools as a standalone trading method during trading operations can be detrimental to a trader. It is always advisable that a trader makes use of more than one trading tool to operate to help them operate in the cryptocurrency market in an efficient manner.
By using more than one trading tool, a trader would get a confluence of signals which help the trader to better operate in the markets. By doing so, the trader tends to get better results than if he had used a single trading tool as a standalone trading operation.
Hello @olabillions , I’m glad you participated in the 6th week Season 5 of the Beginner’s class at the Steemit Crypto Academy. Your grades in this task are as follows:
Recommendation / Feedback:
Thank you for participating in this homework task. Your work is impressive.
Downvoting a post can decrease pending rewards and make it less visible. Common reasons:
Submit