
1-Explain your understanding of the median indicator.
Technical indicators play a vital role for traders in the financial markets. Plenty of them can be used in any type of market such as Cryptocurrency, Forex, Stock, Commodity, etc.
One of these indicators is the Median Indicator. The Median indicator is a trend-based indicator that is used to identify a trend of the price.
It shows the median value that a price has during a trend as it captures the average true range (ATR) through the median line. It also shows the degree of volatility that the price has through the ATR of the median line. When the ATR of the median line is above the median line it shows the volatility, same principles occur vice-versa.
There is a median EMA with the same length as the median line. When the median line crosses above the median EMA, it indicates an uptrend with the thick green line appearing and when the median line crosses below the median EMA, it means a downtrend with the thick purple line appearing.
However, the downside of the indicator is that it causes a lot of noise which can be very confusing. At every twist and turn of the price, the indicator produces a signal. So as the price is moving, every time the price changes direction the median crosses the median EMA which gives many signals which can lead to excess trading activities.

2-Parameters and Calculations of Median indicator. (Screenshot required)
Most indicators in technical analysis make use of calculation in their configurations to help it get some data points that are of importance and make the indicator unique.
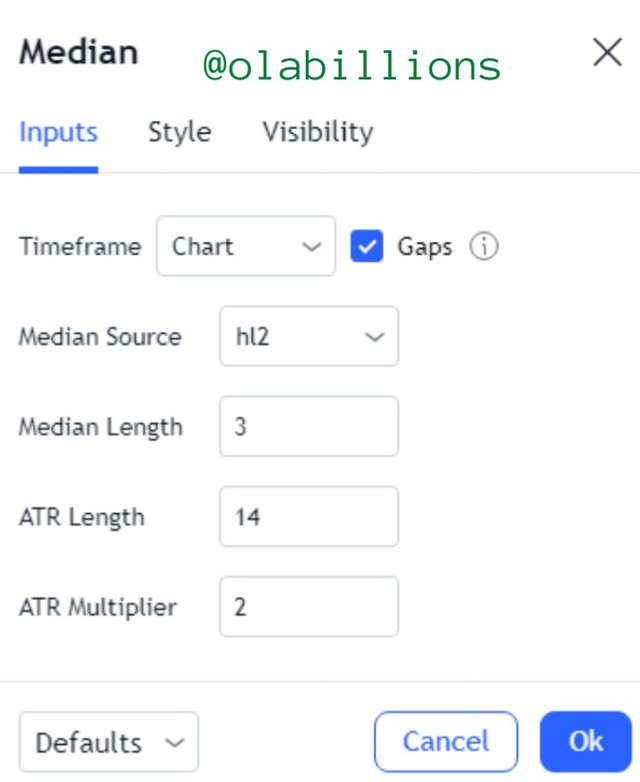
One of such is the median indicator. It makes use of the parameters: median source, median length, ATR length, and ATR multiplier. All these help to plot an upper and lower band which are located above and below the median line.
Median Source - shows where the data for the median line is generated from. It is generated from the high and low divided by 2 (hl2) of the period.
Median Length - the number of periods (candlesticks) that are used for calculating the median line. By default, the value is 3.
ATR Length - the number of periods (candlesticks) that are used for calculating the ATR of the median line. By default, the value is 14.
ATR Multiplier - the value that the derived ATR is multiplied with. By default, the value is 3.
All the parameters can be modified to suit the style of the trader, however, they should be careful with the values that they use so as not to get misleading information from the indicator.

3-Uptrend from Median indicator (screenshot required)
As we have come to understand, the median indicator is an indicator that shows the trend of the price. It makes use of the median line and median EMA to help signal a trend.
To identify an uptrend the median line would have to cross above the median EMA, after which a thick green line would start to form thus indicating an uptrend.
When this occurrence takes place a trader can seek to place their buy entries.
 Tradingview
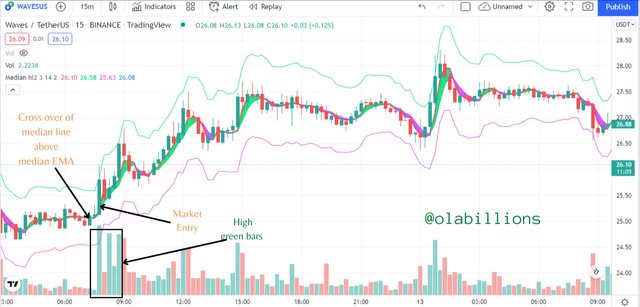
 In the image above we can see that there was a cross-over of the median line above the median EMA. After the crossover, a thick green line began to appear indicating an uptrend.
At the next candlestick after the prior crossover, a buy market entry can be placed. We can also see the sudden increase in the green bars on the volume indicator which gives strong confirmation of the bullish trend and buy entry.

4-Downtrend from Median Indicator (screenshot required)
To identify a downtrend the median line would have to cross below the median EMA, after which a thick purple line would start to form thus indicating a downtrend.
When this occurrence takes place a trader can seek to place their Sell entries.
 Tradingview
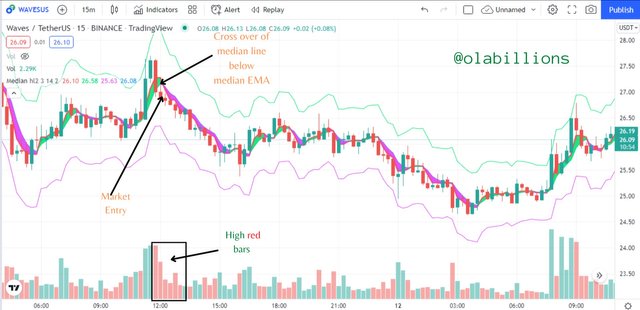
 In the image above we can see that there was a cross-over of the median line below the median EMA. After the crossover, a thick purple line began to appear indicating a downtrend.
At the next candlestick after the prior crossover, a sell market entry can be placed. We can also see the sudden increase in the red bars on the volume indicator which gives strong confirmation of the bearish trend and sell entry.

5-Identifying fake Signals with Median indicator(screenshot required)
One of the main disadvantages of the use of technical indicators is that they are prone to false signals since most make use of past price data in their configurations.
So it is certain that making use of the median indicator can also give false signals.
However, to rid ourselves of false signals we have to use the median indicator along with another indicator to get the best results in our trading operations.
In this exercise, I would use the median indicator with the moving average convergence divergence (MACD). The MACD is a momentum indicator that shows when a trend is about to begin or end.
 Tradingview
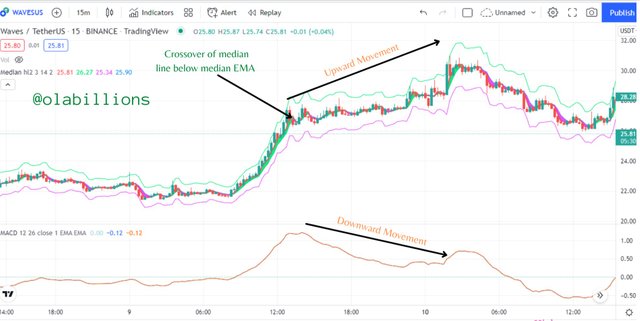
 In the image above, we can see that after the uptrend the median line crossed below the median EMA. This Was shown in the MACD as it reached up.
At the cross of the median line and median EMA, a downtrend was expected even as the MACD signal line had reached its peak of the previous uptrend.
The indicator moved downwards, while the price moved upwards thus giving a conflict of signals and a time to abstain from placing a sell entry.

6-Open two demo trades, long and short, with the help of a median indicator or combination that includes a median indicator (screenshot required)
In this section, I would be performing two demo trades, one a buy entry and the other a sell entry, using the median indicator.
Buy Entry
 Tradingview
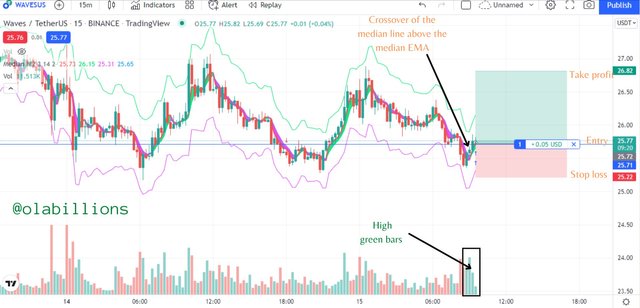
 The image above is a 15 min chart of WAVESUSDT. The price had moved downwards and was indicated by the median line below the median EMA and the thick purple line.
Later on, the meidan line crossed above the median EMA with a thick green line beginning to show. This signal a new uptrend. Plus, the green bars on the volume indicator were high, which shows the increase in the buying activity. This shows that the uptrend is about to happen.
I placed a buy entry at the third candlestick after the crossover and placed my stop loss just below the low previous low point and the take profit at a ratio of 1:2.
 Tradingview
 Sell Entry
 Tradingview
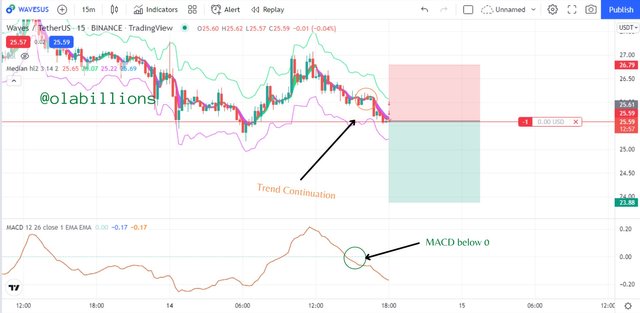
 The image above is a 15 min chart of WAVESUSDT. The price had a previous uptrend, then started a new downtrend. This was indicated on the chart with the median line crossing below the median EMA. This coincided with the MACD also moving downwards after the previous uptrend.
During the downtrend, the price had a slight pause, then it continued in its downtrend as a trend continuation. This was again shown by the median line crossing below the median EMA and the MACD crossing below the 0 mark.
A sell entry was placed just after the trend continuation point, with the stop loss placed above just at the peak of the previous uptrend and the take profit placed at a ratio of 1:2.

Conclusion
There are many indicators that can be employed to make technical analyses for an asset. They are categorized in different aspects such as trend-based indicators, momentum indicators, etc. The Median indicator is a trend-based indicator that shows when a new trend is about to begin. It also has the capacity to show the volatility of the price, this is helpful as it can show when the trend is about to end.
It is however advisable that traders make use of more than one indicator to help them get a better analysis of the market and also to make better trading decisions.
