
1. Show your understanding of the Zig Zag as a trading indicator and how it is calculated?

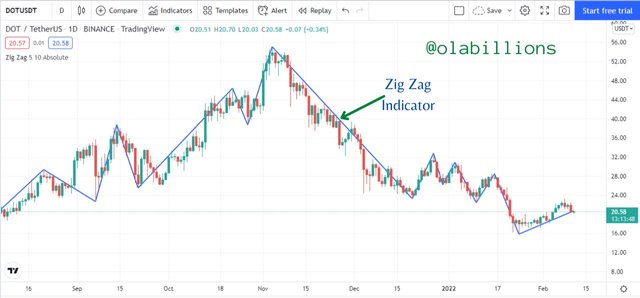
The Zig Zag indicator is a technical analysis tool that helps traders to know the prevailing trend of an asset by connecting the swing points of the peaks and troughs of the asset's price with straight lines. When the straight lines are connected, they, therefore, form a "zig-zag" structure. With the ZigZag indicator, significant extremes are very visible and this makes it a hot property for many trading systems.
 Source
 It spots the highest and lowest price points that an asset has moved within a given period, then it connects these points with a straight line. Therefore, it can be used to connect different price points of an asset. The manner in which the indicator behaves is that when the price of an asset moves at a percentage greater than the predetermined level, higher or lower, it plots a point, then those points are connected with a straight line.
By using the Zig Zag indicator traders can spot trends and changes in trends easily. It reduces the noise caused by random price fluctuations and gives a clearer view of the trend whether an uptrend or a downtrend. It is very effective as it can be used for all assets types and on all timeframes. But it shows its power best when the market is in a very strong trend.
Through connecting the swing highs and lows of the asset's price, it helps to show levels of support and resistance. In addition, trend reversal patterns such as double tops and bottoms or head and shoulders can be spotted.
It is also noteworthy that the Zig Zag indicator does not try to predict the future movement of an asset's price, it only shows the historical movement of the asset's price. Therefore, it doesn't predict price changes or trend reversals. That said, the Zig Zag indicator cannot be used as a stand-alone indicator to try and operate in the market, worst still, it can't be used for making market entries.
The way the Zig Zag trading indicator is employed is that it should be used as a core part of a trader's technical analysis. This means that along with the Zig Zag indicator, other indicators such as Relative Strength Index RSI, Commodity Channel Index, Stochastic Oscillator, Elliot Wave Theory EWT, etc as confirmation mechanisms and spotting certain conditions.
How to calculate the Zig-Zag indicator
In this section I would be giving the model used in calculating the Zig Zag indicator, then I would be giving the steps to use.
Model:
ZigZag (HL, %change = X, retrace = FALSE = LastExtreme = TRUE); If %change >= X, plot ZigZag.
Where:
HL = High-Low price series or Closing price series; %Change = Minimum price movement, in percentage; Retrace = change in the retracement of the previous move or an absolute change from peak to trough?; LastExtreme = If the extreme price is the same over multiple periods, is the extreme price the first or last observation?
Steps used:
Select a starting point, either a Swing high or Swing low.
Then choose your preferred % price movement.
Then identify the next Swing high or Swing low that is different from the starting point = > % price movement.
Next draw a trendline from the starting point to the new point.
Again try and identify the next Swing high or Swing low that differs from the new point = > % price movement.
Then draw a trendline from the new point to the next new point.
Repeat this process to the most recent Swing high or Swing low.
Having the model and steps to operate the model in mind, the Zig Zag indicators can make use of different values due to the type of chart on which it is installed on. Therefore, if the chart is a Line Chart, then the values used would be the closing values because that's what the chart parameter consists of. And if the chart is a Candlestick Chart, it makes use of the highest and lowest price values.
Also, since the Zig Zag indicator focuses on historical price data, the last point is always on a constant change, because the next price has the power to move it again. Therefore the last point should not be taken into consideration in the analysis, the analysis should be based on the previous price movement.

2. What are the main parameters of the Zig Zag indicator, How to configure them, and is it advisable to change its default settings? (Screenshot required)

Main Parameters of the Zig Zag Indicator.
The Zig Zag indicator comes with two parameters in its settings. They are Deviation and Depth. With the help of these two parameters the Zig Zag indicator functions effectively. I shall be describing each parameter.
Deviation: This is the minimum price change that the asset's price must exhibit from the previous swing point to the new swing point before it is confirmed by the Zig Zag indicator. It is expressed in percentage % and has a default setting of 5. This means that every swing move should move at 5% before it is recognized by the Zig Zag indicator.
Depth: This is the minimum distance or periods that the candlesticks have reached where the indicator will not identify a new swing point that is different from the previous swing point by a value at least equal to the 5%. It has a default setting of 10.
How to configure them
These are the procedures to follow to install and configure the Zig Zag indicator.
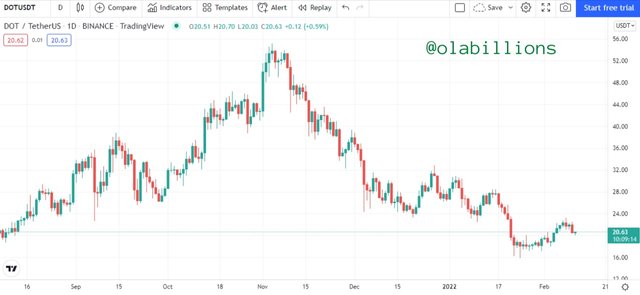
- Go to a reputable platform, where one can use it for daily trading activities. I used [Tradingview(tradingview.com/chart/) in my case. You would see the trading terminal and all its properties.
 Source
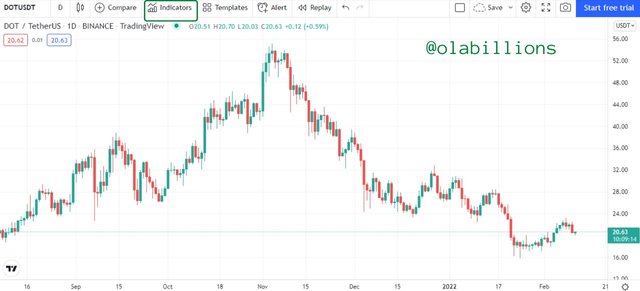
 - Click on Indicators at the top of the trading screen.
 Source
 - A search icon that has all the trading indicators would display. Type Zig Zag in the search icon. A list would display, click on the first one (which is Zig Zag).
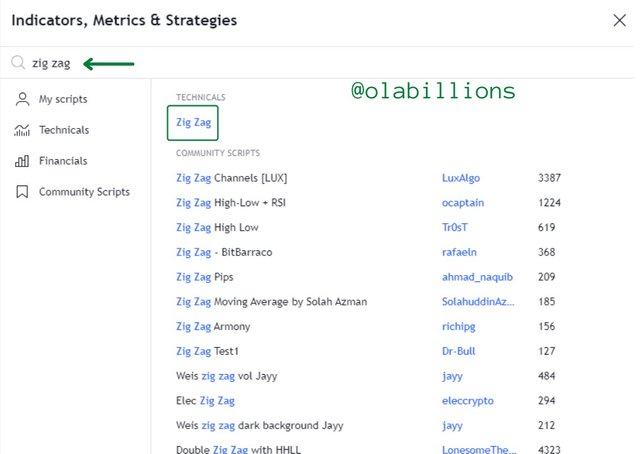 Source
 - The Zig Zag indicator has been installed on the trading terminal.
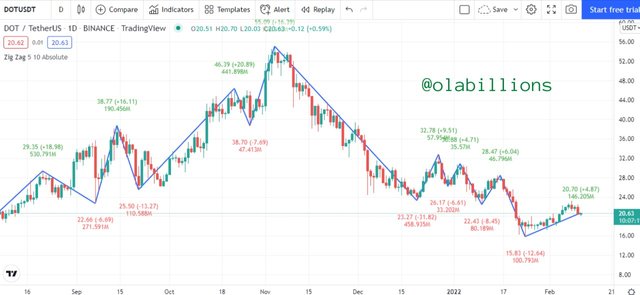 Source
 Now to configure the Zig Zag trading indicator...
- Click on the Zig Zag indicator's settings icon at the top left of the trading terminal.
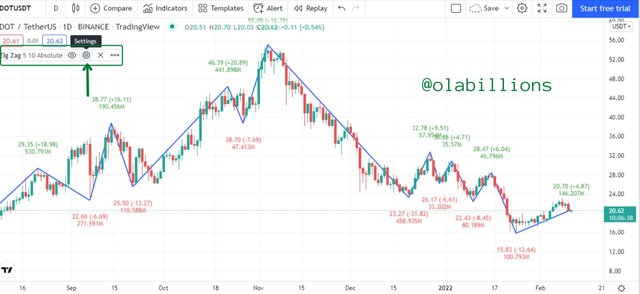 Source
 - The settings section would display, so I unticked the unnecessary parameters in order for them to be removed. When I was through with the configuration I clicked on OK. Also, it is in this section that you can change the default settings for the Deviation and Depth parameters for the Zig Zag indicator. You can also change the line color from blue to any color of your choice.
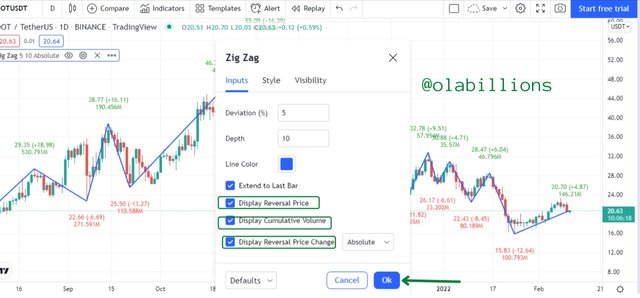 Source
 - The Zig Zag indicator has been installed on the trading terminal and has been configured.
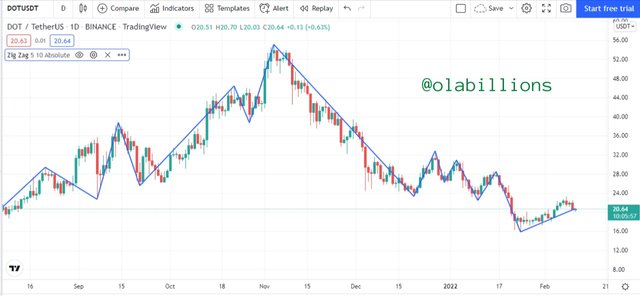 Source
 Is it advisable to change its default settings?
Yes! it is advisable to change the settings because every trader can make use of the Zig Zag indicator based on their style and preference. The parameters that can work for someone might not likely work for another person. However, when traders are customizing the setting, they should be careful not to change the values too high or too low. Because when the value is changed to a very high value, it can make the Zig Zag indicator behave in an insensitive manner such that most of the data would be eliminated including the noise that the chart usually gives, therefore making it difficult to come into any decisions.
Also, if the values are too low it can make the Zig Zag indicator behave in such a way that it generates many micro-trends which can generate plenty of noise, make the signals to be confusing, and make the charts look very messy. So I suppose that the best thing is for traders to experiment with different percentage settings in order to get a value that works best for them.

3. Based on the use of the Zig Zag indicator, how can one predict whether the trend will be bullish or bearish and determine the buy/sell points (screenshot required)

How to Predict Bullish or Bearish Trends
As stated previously, the Zig Zag indicator is mainly used to identify trends. The trends are connected with the Zig Zag indicator straight line which joins peaks and trough that forms in series.
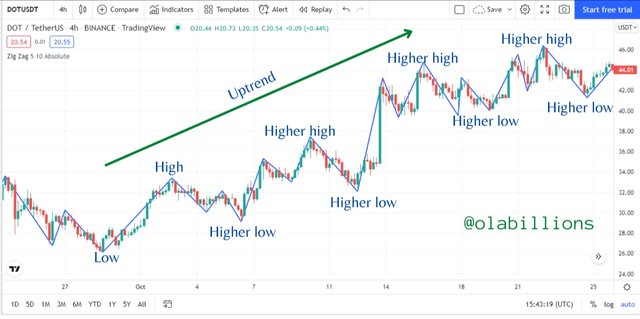
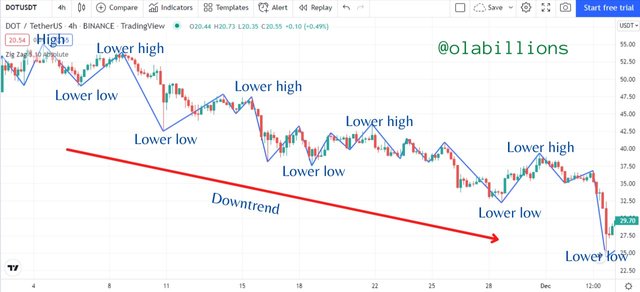
So when we see price swings where the peaks and troughs are in ascending order such that it forms a higher high and higher low structure, then the price is in an uptrend. Conversely, when the price swings where the peaks and troughs are in descending order such that it forms a lower low and lower high structure, then the price is in a downtrend.
Predicting an Uptrend
 Source
 To identify an uptrend, the peaks and troughs should be in ascending order and the Zig Zag indicator should be moving upwards even as the price is moving upwards. This is shown in the image above, as we can see the uptrend and also the formation of the price structure in relation to the Zig Zag indicator. It forms higher highs and higher lows as the price reaches new peaks and troughs in ascending order.
Predicting a Downtrend
 Source
 To identify a downtrend, the peaks and troughs should be in descending order and the Zig Zag indicator should be moving downwards even as the price is moving downwards. This is shown in the image above, as we can see the downtrend and also the formation of the price structure in relation to the Zig Zag indicator. It forms lower lows and lower highs as the price reaches new peaks and troughs in descending order.
How to Determine Buy & Sell Points
In order to determine a buy or sell entry using the zig-zag indicator, the first thing we must do is to bear in mind the current trend of the asset's price. It is only natural that we do so. So if the price of the asset is moving in an uptrend then we can place a market buy entry. Also, if the price of the asset is moving in a downtrend then we place a market sell entry.
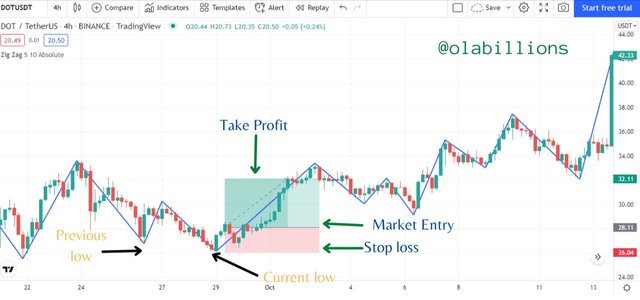
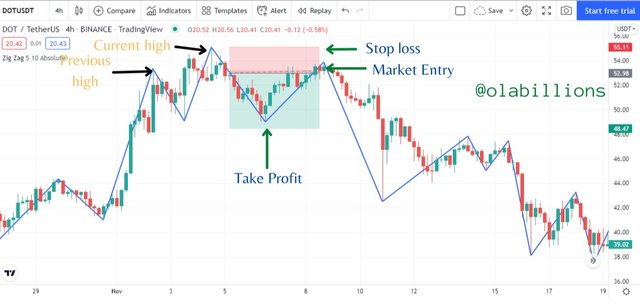
When placing the buy entry, the price of the asset should make a new low that is higher than the previous low. Likewise, when placing the sell entry, the price of the asset should make a new high that is lower than the previous high.
Determining Buy Points
 Source
 In the image above, we can see the determination of the market buy entry, the asset's price was in a downtrend then it changed to an uptrend. At the change to the uptrend, the price had a current low which was lower than the previous low. So at the point where the price surpassed the previous low point a market buy entry was placed with the stop-loss within or just below the current low and the take profit at a ratio of 1:2.
Determining Sell Points
 Source
 In the image above, we can see the determination of the market sell entry, the asset's price was in an uptrend then it changed to a downtrend. At the change to the downtrend, the price had a current high which was higher than the previous high. So at the point where the price surpassed the previous high point a market sell entry was placed with the stop-loss within or just above the current high and the take profit at a ratio of 1:2.

4. Explain how the Zig Zag indicator is also used to understand support/resistance levels, by analyzing its different movements. (screenshot required)

Just as the Zig Zag indicator is used to identify trends it can also be used to identify Support and Resistance price levels. Support and Resistance levels are one of the core characteristics in technical analysis and it is only right that we are able to identify such important levels using the Zig Zag indicator.
The support and resistance levels show the sentiments of the buyers and sellers. When the price touches a level and deflects back upwards or downwards it shows that the market is either strongly buying or selling at that point. Then if this occurrence happens more than once (up to 3 times) it goes to show that the level is a strong support or resistance level.
Using the Zig Zag indicator a support level is one where a set of highs that forms a horizontal line is identified. Likewise, a resistance level is one where a set of lows that forms a horizontal line is identified.
Identifying Support Levels
 Source
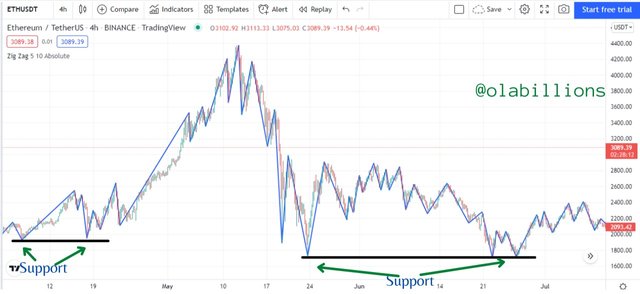
 To identify the support level using the Zig Zag indicator, there has to be a series of lows that form a horizontal line that is plotted on the chart. This is visible as there is a re-bounce of the price on that level. It also shows that that price level is a strong level and price doesn't continue their downward movement.
This is shown in the chart above as there is a black horizontal line plotted on the chart below the series of highs to capture the series of lows where the price reached and re-bounced at that level.
Identifying Resistance Levels
 Source
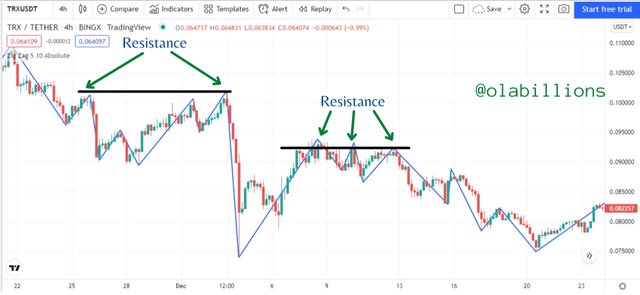
 To identify the resistance level using the Zig Zag indicator, there has to be a series of highs that forms a horizontal line that is plotted on the chart. This is visible as there is a re-bounce of the price on that level. It also shows that that price level is a strong level and price doesn't continue their upward movement.
This is shown in the chart above as there is a black horizontal line plotted on the chart above the series of highs to capture the series of highs where the price reached and re-bounced at that level.

5. How can we determine different points using Zig Zag and CCI indicators in Intraday Trading Strategy? Explain this based on clear examples. (Screenshot required))

In this exercise, I would be combining the use of the Zig Zag indicator and the CCI indicator. Also, the timeframe would depict an intraday period as that is the expectation of the professor; @kouba01.
CCI stands for Commodity Channel Index. It is an oscillator indicator that is momentum based which helps to identify the extreme conditions prices. These conditions are overbought or oversold. It was developed by Donald Lambert.
It is a range-bound indicator where the indicator line oscillates to give certain signals about the current conditions of the market. Once it reaches the range of +100 or -100, then it gives signals of the price.
It is an indicator that many traders use during technical analysis to help them assess the conditions, directions, and strength of the trends of the price. With it, traders can make decisions such as entering a trade, refraining from entering a trade, or simply adding more to an existing position.
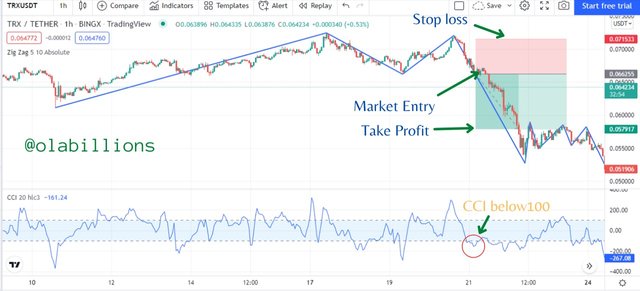
In this combination, the method to be employed is waiting for the CCI to break past the +100 and -100 range and then confirming if the price has passed the previous high or low before placing a market entry.
Buy Entry Combining Zig Zag and CCI Indicator
 Source
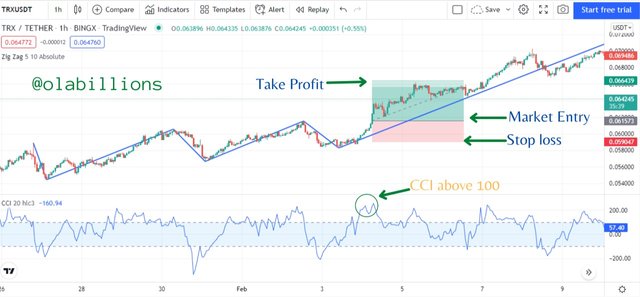
 For a buy entry, the price has to be in an uptrend, then the price has to close above the previous high which coincides with the CCI indicator being above +100. Once these situations occur then a buy market entry is placed.
This is shown in the image above as the chart consist of the price being in an uptrend, then at a certain period of time, the price closed above a previous high which coincided with the CCI indicator being above the +100 mark. A buy market entry was placed, the stop loss was placed at the current low point and the take profit was placed at a ratio of 1:2.
Sell Entry Combining Zig Zag and CCI Indicator
 Source
 For a sell entry, the price has to be in a downtrend, then the price has to close below the previous low which coincides with the CCI indicator being below -100. Once these situations occur then a sell market entry is placed.
This is shown in the image above as the chart consist of the price being in a downtrend, then at a certain period of time, the price closed below a previous low which coincided with the CCI indicator being below the -100 mark. A sell market entry was placed, the stop loss was placed at the current high point and the take profit was placed at a ratio of 1:2.

6. Is there a need to pair another indicator to make this indicator work better as a filter and help get rid of false signals? Give more than one example (indicator) to support your answer. (screenshot required)

Yes, there is a need to pair the Zig Zag indicator with other indicators to help filter out false signals and also get rid of them. Naturally, the Zig Zag indicator is an indicator that is not to be used to generate trading signals, it is mainly used to spot trends in the price of an asset.
Also, as a trading principle, no technical indicator should be used as a standalone indicator, it should be used in conjunction with other indicators to give a confirmation of trading signals and a generally effective way of trading.
To show how possible it is, I would be using 3 indicators to give an illustration. The indicators are Bollinger Bands BB, Weighted Moving Averages WMAs, and Moving Average Convergence Divergence MACD.
Pairing Zig Zag and Bollinger Bands Indicators
Briefly, the Bollinger Band indicator is one that is made up of 2 trendlines that are separated by a Simple Moving Average (SMA) that is found in the middle of the trendlines. The trendlines are the upper band and the lower band and they have plotted 2 standard deviations away from the SMA.
Bollinger Bands has so many functions, such as predicting overbought and oversold conditions, showing the current price trend whether bullish or bearish, showing trend reversal patterns.
Let's see how we can trade the combination of the Zig Zag indicator and the Bollinger Bands.
 Source
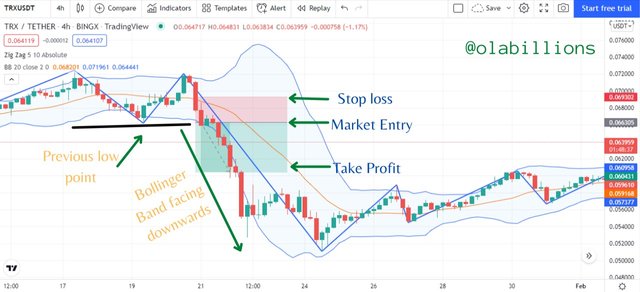
 In the image above we can see the effect of the Zig Zag indicator and the Bollinger Band indicator. The Bollinger Band was in a range, this is indicated by the closeness of the upper band and the lower band as they contracted. At the time of the range, the Zig Zag indicator moved within the price range formed by the Bollinger Band.
Afterward, the price experienced a downtrend. This was indicated on the Bollinger band as it expanded, it was facing downwards, and the price broke past the range that the BB formed. Also, on the Zig Zag indicator, it broke through the previous low/range that the indicator formed.
Therefore a sell entry was placed at the point where the price broke below the previous low point and range formed by both the BB and the Zig Zag indicator. Then the stop loss was placed just at the top of the middle line (SMA) of the Bollinger Band and the take profit was placed at a ratio of 1:2.
Pairing Zig Zag and Weighted Moving Averages Indicators
Briefly, the Weighted Moving Average indicator is an indicator that adds more weight to the most recent data of an asset's price and adds less weight to past data. It achieves this by multiplying each period by a unique number (weighting factor). This makes the WMA follow prices in a closer manner than the popular Simple Moving Average (SMA)
Weighted Moving Averages has their own functions. It helps to identify the direction of the trend of a price, it can give signals on when to place a buy entry when the price goes down and gets close or falls just below the WMA, it can also give a sell entry when the price rally up and get close or rise just above the WMA. It can also provide good support and resistance levels. Finally, it can be used to validate a market entry as it shows that the trade is in the direction of the trend.
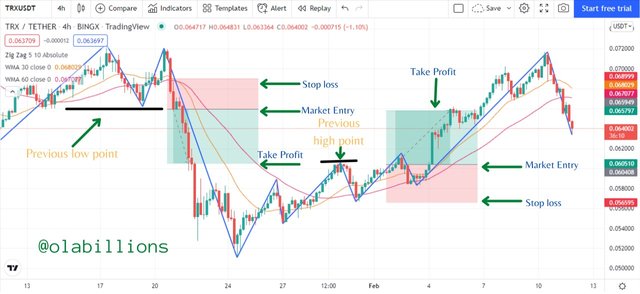
Let's see how we can trade the combination of the Zig Zag indicator and the Weighted Moving Averages (WMAs). I'm using a combination of 30 WMA which is the yellow color and 60 WMA which is the peach color. When the 30 WMA crosses below the 60 WMA, it indicates a sell signal and when the 30 WMA crosses above the 60 WMA it indicates a buy signal.
 Source
 In the image above we can see the effect of the Zig Zag indicator and the Weighted Moving Averages. The price experienced price swings whereby the candlesticks and the Zig Zag indicator were above the WMA. Then the price and the Zig Zag also came down whereby it broke out of the WMA to form a low point, then it rose back up.
Afterward, the price went back down along with the Zig Zag indicator and broke past the WMA. At this point, there was a crossover of the 30 WMA below the 60 WMA below, thereby indicating a sell signal.
At the point where the price broke below the previous low point, a sell entry is placed with the stop loss placed within or just above the cross-over point, and the take profit placed at the ratio of 1:2.5.
We can also see that there was a buy entry where there was a crossover of the 30 WMA above the 60 WMA. So at the point where the price broke out of the previous high, the buy entry was placed with the stop loss placed within or just below the crossover point, and the take profit placed at the ratio of 1:2.
Pairing Zig Zag and Moving Average Convergence Divergence Indicators
Briefly, the Moving Average Convergence Divergence (MACD) is a technical analysis indicator that shows the relationship between two moving averages of an asset's price. It is a momentum indicator that follows the trend of the asset's price. It can be used for so many purposes such as crossovers, divergences, and rapid rises or falls of an asset's price.
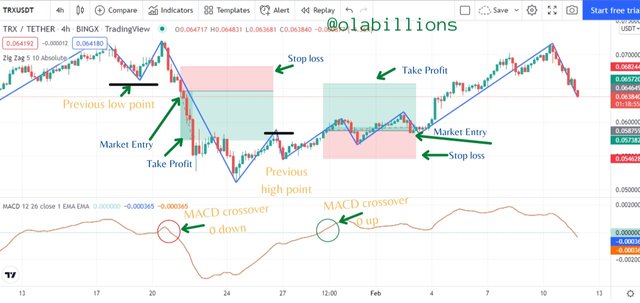
However, for this exercise, I would be configuring the settings such that the MACD would have a value of 0 where the MACD line would have to move above or below the value. When the MACD line moves above the 0 mark it indicates a buy signal, in the same vein, when the MACD line moves below the 0 mark it indicates a sell signal.
Let's see how we can trade the combination of the Zig Zag indicator and the Moving Average Convergence Divergence (Configured).
 Source
 We can see that the MACD line crossed over the 0 mark downwards, this signaled a sell entry, at the same time the Zig Zag indicator was facing downwards. So I waited for the price to go below the previous low point, then a sell entry was placed with the stop loss placed at a point above the previous high point and the take profit placed at a ratio of 1:2.5.
We can also see that the MACD line crossed over the 0 mark upwards, this signaled a buy entry, at the same time the Zig Zag indicator was pointing upwards. So I waited for the price to go above the previous high point, then a buy entry was placed with the stop loss placed at a point below the previous low point and the take profit placed at a ratio of 1:2.5.

7. List the advantages and disadvantages of the Zig Zag indicator:

After going through the Zig Zag indicator, we can see so much usefulness about it. These give it its advantages, but unfortunately, just as so many other things, it also has its disadvantages. I shall mention them in the lists below.
Advantages
It gives a clear indication of the price trend. It does this by connecting peaks and troughs with a straight line
It makes use of only important data points.
Because of its simplicity it helps facilitate chart analysis quickly.
It eliminates much of the noise experienced in the trading chart due to constant price fluctuation and price swings.
It has the ability to be used in any timeframe in an effective manner.
It can be used along with other technical analysis indicators very well.
It is a simple indicator that let trader read the markets without too many facts, this makes it a suitable indicator for beginners.
Disadvantages
The indicator is not designed to provide market entry and exit points just trends.
Asides from giving a display of the trends, not much information is given about the trends.
The most current line of the Zig Zag indicator can change at any time during the current price action, so traders should be aware of it, else it can be misleading.
It is used to analyze only past movements and cannot be used to predict future movements.
The indicator is more efficient at higher timeframes, so traders should be careful when using it at lower timeframes, else they get repeated losses.

8. Conclusion:

The Zig Zag indicator is an indicator that shows the trend of the price of an asset. It shows only previous trends and cannot show future trends. It also doesn't have the capacity to provide market entries and exits. It can be described as a lagging indicator.
In its settings, it is made up of 2 distinct parameters which are the deviation and the depth. Traders can configure them according to their style and taste. Asides from spotting trends, the Zig Zag indicator can also be used to spot levels of support and resistance
The indicator can be used along with other indicators such as CCI, BB, WMAs, and MACD. All these other indicators were paired with the Zig Zag indicator and they provided excellent results. We were able to spot various buy and sell entries.
It has many advantages that have already been listed, it also has its disadvantages, but not to worry as the disadvantages are fewer than the advantages.