
Explain Your Understanding of Moving Average.
We make use of trading indicators to help us get information such as the trend of the price and market entry. It is a very important approach in technical analysis.
Moving Average is one of such indicators. It is an indicator that lets traders identify the market trend, and also entry and exit points, with identification of trend reversals.
It is a representation of the average price of an asset for a specific period of time. It is dependent on the period used in its configuration. For instance, a moving average that is configured with 50 periods would calculate the average for the last 50 periods.
The moving average is represented with a line that moves dynamically in the chart. By employing the moving average we get to see the movement of the price clearly as it doesn't follow the action of the price but it gives the average of the price for the period chosen.
By making use of the moving average indicator we can make better decisions on trading and not fall for misleading price action.
 Source: Tradingview
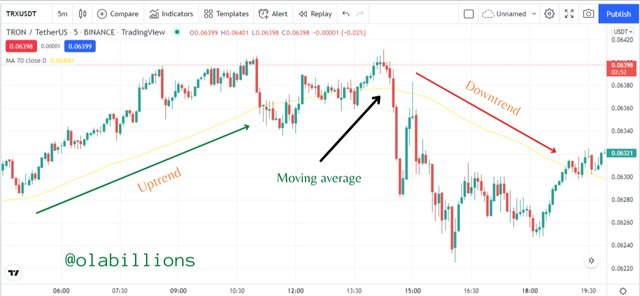
 In the chart above we can see the effect of the moving average indicator. It shows how the price moved in an uptrend and also when it moved in a downtrend. That's how powerful the moving average indicator can be.

What Are The Different Types of Moving Average? Differentiate Between Them.
We have 3 common types of moving averages that are being employed by traders. They are Simple Moving Average, Exponential Moving Average, and Weighted Moving Average.
They are all similar in the ways they behave and try to produce signals, what differentiates them is how they are calculated. I shall discuss them each.
Simple Moving Average (SMA)
The Simple Moving Average (SMA) indicator is one that tries to produce signals by giving the average price of the asset for a given period.
For instance, if a 50 period is used for the SMA, it calculates the average of the 50 periods and tries to give trading signals based on this function.
It is quick to react for lower periods and slow to react for higher periods. With it, we can see when a trend is starting, and the continuity of the trend.
 Source: Tradingview
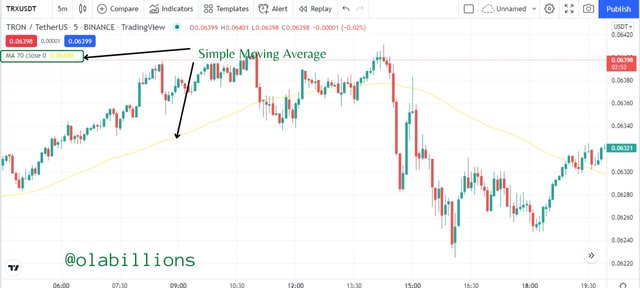
 The above chart is an example of a simple moving average. With it, we can spot trends and see the situation that the market has passed through.
The formula for calculating the SMA is:
SMA = A1 + A2 + ... + An / n
Where:
An = the price of an asset at period n.
n = the number of total periods.
Exponential Moving Average (EMA)
Exponential Moving Average (EMA) is a different type of moving average. During its calculation it places more weight on the most recent price, this effect makes it react faster to price action.
It is just like the simple moving average, but with much weight given to the most recent price. This is the reason why it's called the exponential moving average.
It can be used on its own, but it gives better trading signals when combined with the simple moving average.
 Source: Tradingview
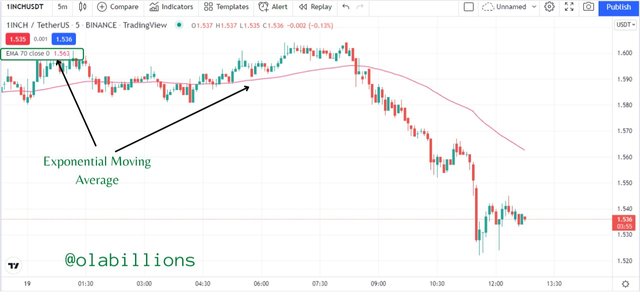
 The above chart is an example of the exponential moving average. With it, we can spot trends and see the situation that the market has passed through.
The formula for calculating the EMA is:
EMAToday = (ValueToday ∗ (Smoothing / 1+Days)) + EMAYesterday ∗ (1−( Smoothing / 1+Days))
Where:
EMA = Exponential Moving Average
Weighted Moving Average (WMA)
Weighted Moving Average (WMA) is a different type of moving average. It is calculated by placing more weight on the current price data and less weight on past price data.
Traders also use this indicator to get trading signals, especially for market entries and exits. The signals given are accurate when used in any timeframe.
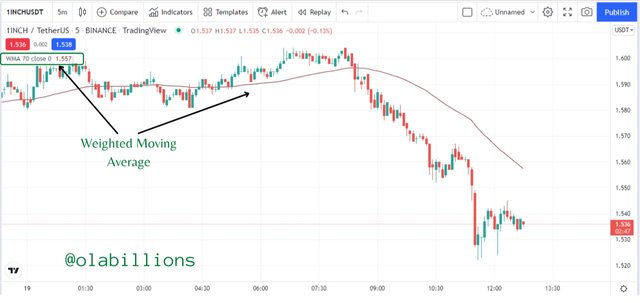 Source: Tradingview
 The above chart is an example of the weighted moving average. With it, we can spot trends and see the situation that the market has passed through.
The formula for calculating the EMA is:
Weighted Moving Average = Price1 x n + Price 2 x (n-1) + ...... Price n / [n x (n+ 1)] / 2
Difference Between SMA, EMA, and WMA
Like I said previously, all the moving averages behave similarly, however, they have some marked differences. Here they are:
Simple Moving Average (SMA):
SMA is different from EMA & WMA because
It calculates the average of the periods chosen.
It is better suited for longer-term trades.
Gives better signals at higher timeframes.
Is a critically lagging indicator.
Exponential Moving Avearge (EMA):
EMA is different from SMA & WMA because
It calculates the most recent price by using a multiplier which acts as the smoothing factor.
It is better suited for short term trading
Gives better signals at shorter timeframes, also used for scalp trading.
Acts very fast according to the action of the price.
Weighted Moving Average (WMA):
WMA is different from SMA & EMA because
It places more weight on the current price and less weight on the past price in its calculations
It can be used in scalping and shorter-term trading.
Gives good signals for both longer and shorter-term timeframes.
It is a very sensitive indicator and gets affected even for the tiniest of movement.
 Source: Tradingview
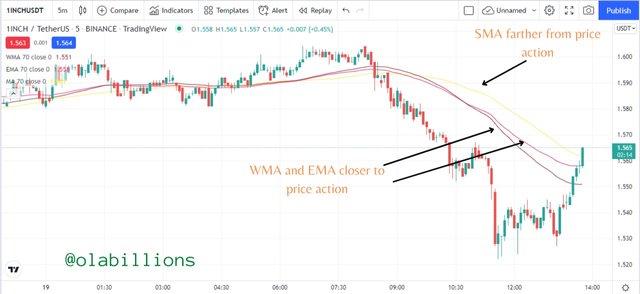
 We can see a clearer difference between the SMA, EMA, and WMA in the image above. The different moving averages have the same period (70) but they behave differently. The SMA is farther from price action than the EMA and WMA because it is less sensitive and it is a lagging indicator. The EMA and WMA are closer to price action, however, the WMA is closer to price action than the EMA because it is more sensitive based on its calculations.

Identify Entry and Exit Points Using Moving Average. (Demonstrate with Screenshots)
In this exercise, I would give a demonstration on how to identify an entry and place an entry position. In order to get better results, I would use 2 moving averages. One would be a faster-moving average and the other would be a slower moving average.
The faster-moving average would be 30 EMA and the slower moving average would be 70 SMA. by using the two moving averages we can identify entry and exit points.
In an uptrend, the 30 EMA would be above the 70 SMA and the 30 EMA would be the support. And in a downtrend, the 30 EMA would be below the 70 SMA and the 30 EMA would be the resistance.
Because the price movement is not certain, we place a market entry at the most recent high or low after the crossover between the 30 EMA and the 70 SMA.
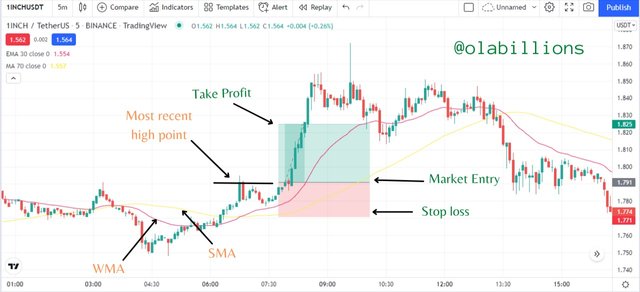 Source: Tradingview
 The chart above is an illustration of a buy entry. The price was moving in an uptrend and the 30 EMA acted as dynamic support, so a buy entry was placed just above the most recent high. The stop loss was placed at the 70 SMA and the take profit was placed at 1.5x the stop loss.
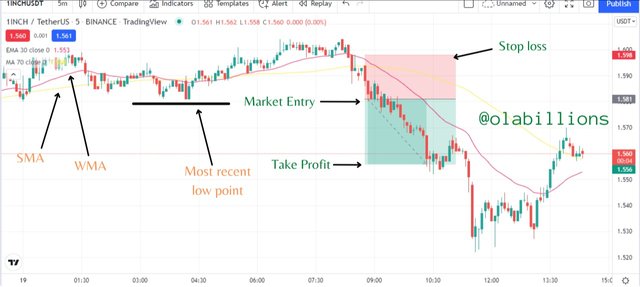 Source: Tradingview
 The chart above is an illustration of a sell entry. The price was moving in a downtrend and the 30 EMA acted as dynamic resistance, so a sell entry was placed just below the most recent low. The stop loss was placed at the 70 SMA and the take profit was placed at 1.5x the stop loss

What do you understand by Crossover? Explain in Your Own Words.
Crossovers occur when two moving averages collide and move in the same direction. It is mainly used to identify Trend Reversals. It is a combination of a faster-moving average and a slower moving average.
The faster-moving average is the one with a lower period such as 10, 20, 50 period, etc while the slower moving average is the one with a higher period such as 100, 200, etc.
When the faster-moving average crosses above the slower moving average it signals a change in the trend from bearish to bullish. So at that point, we should be expecting to place our buy entires. Likewise, when the faster-moving average crosses below the slower moving average it signals a change in the trend from bullish to bearish. So at that point, we should be expecting to place our sell entires.
The combination of moving averages if done well can provide profitable results.
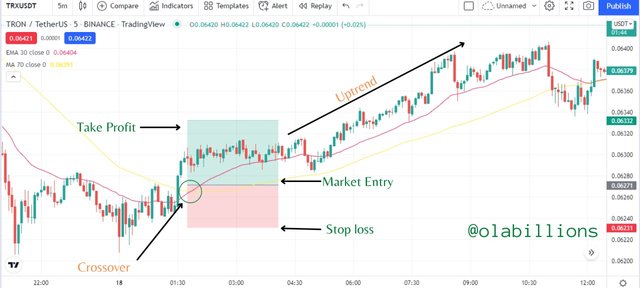
To explain a bit further I would be using a 30 EMA which serves as the faster-moving average and 70 SMA which serves as the slower-moving average.
 Source: Tradingview
 The chart above is an illustration of a crossover. The 30 EMA crossed above the 70 SMA to signal a trend reversal from bearish to bullish. So a market entry is placed just above the crossover. The stop-loss is placed below the 70 SMA and the take profit is placed at 1.5x the stop-loss.
As we can see after the crossover the price moved upwards.
 Source: Tradingview
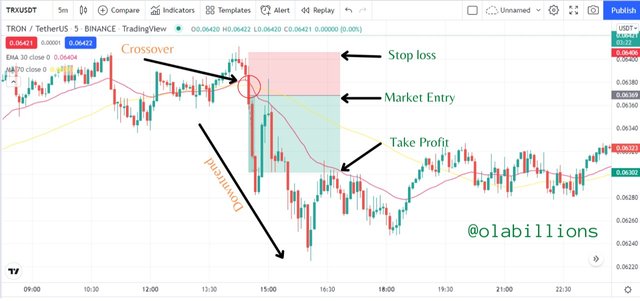
 The chart above is an illustration of another crossover. The 30 EMA crossed below the 70 SMA to signal a trend reversal from bullish to bearish. So a market entry is placed just below the crossover. The stop-loss is placed above the 70 SMA and the take profit is placed at 1.5x the stop-loss.
As we can see after the crossover the price moved downwards.

Explain The Limitations of Moving Average.
As in all indicators, the moving average indicator doesn't give accurate signals all the time. It works with past data, so it doesn't give predictions for the future movement of prices. It is mainly useful to identify trends in the market, and not much information about the movements of the price.
It makes use of past data in its calculations hence moving average is a lagging indicator by design, it can't be depended on to give signals based on future movements.
It generates signals based on the periods that are being selected. So traders need to be careful when using it. A lower period moving average is best suited for lower timeframes and a higher period moving average is best suited for higher timeframes
Based on how it works we can only see its response to the current conditions in the market, therefore we have to be open-minded when using it in order not to miss a lot of opportunities.
As previously stated, it works well in trending markets but behaves very poorly in a ranging market. During the ranging period, the indicator can give conflicting signals.

Conclusion
The moving average indicator is one of the many indicators that is used in technical analysis. It is very useful for identifying trends, trend reversals, and entry and exit points. It is one of the easiest indicators to use because it doesn't provide so much information about the price, it just gives so necessary information. On the trading charts, it is represented by a line that moves up and down as price actions continue.
There is a variety of moving averages but the most common among traders are SMA, EMA, and WMA. Although all of them work in a similar manner, they each have their remarkable differences. Moving averages can also be used along with other trading indicators, as they help to give a better analysis.
My advice is that traders should use the moving average with other indicators to get the best results. During trading operations, they should take their time before placing an entry as they need patience for identifying the best entry /exit points.
As I have said before, it can identify Entry/Exit points, present trends, and trend reversals very easily, But it is difficult to use during the sideways market because it generates false signals. So during the sideways market be cautious when trading with moving averages.