
Define Line charts in your own words and Identify the uses of Line charts.

A Line-chart is a graphical representation of an asset's price using a Continuous Line. The continuous line connects a series of data points that an asset gives out during the trading period. It is the most basic type of charting technique that traders can use and it is the easiest form of charting technique. It is usually recommended for beginners to use in their journey to trading.
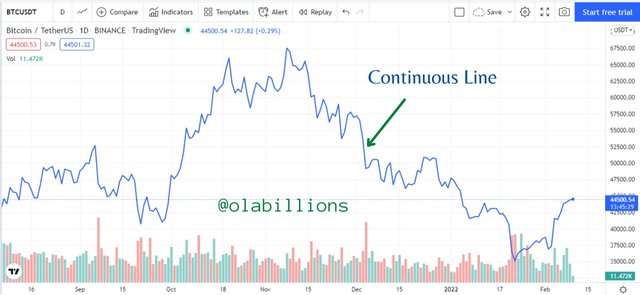 Line Chart
 It is not like most other chart types which give different details such as open, close, high, and low prices. It uses a single color rather than 2 colors (usually red and green) to show that the price is either bullish or bearish. Also, unlike the other charting technique, it is the form of a 2D representation. On the vertical axis, the value of the asset is displayed, while on the horizontal axis the period of the asset is displayed and it is dependent on the timeframe being used.
As stated previously it is one of the easiest forms of charting techniques, and because it makes use of the closing price of an asset. And because of this, the constant noise and changes in the price of an asset which is displayed in other types of charts are eliminated.
 Tradingview
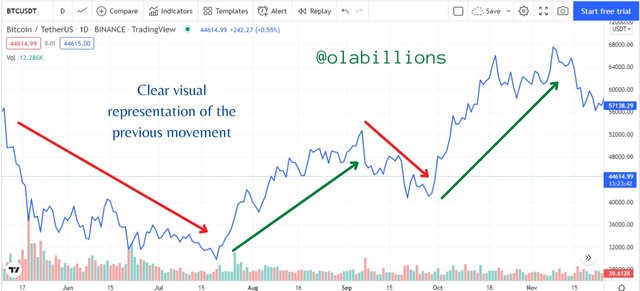
It gives a clear visual graphical representation to traders of how an asset price has moved previously. The visual representations are very clear and have noise or confusion attached to it. With the use of line charts, we can see the changes of information within a specified time clearly.
Line charts are very easy to understand because they are not like other chart types which are very difficult and complex in nature in spotting price movements and trends which make traders lose frequently. Therefore, traders can use line charts as part of their trading arsenal to spot trends and make massive profits.
By using line charts, traders won't be overwhelmed with too much information during an analysis of an asset. It also reduces the effect of having so much information which can lead to having multiple signals that lead to confusion and complications during analysis and trading. This is one of the things every trader should avoid.

How to Identify Support and Resistance levels using Line Charts (Demonstrate with screenshots)

Support and Resistance level are used to describe the levels in which a price of an asset attain and find it difficult to move beyond such levels, thereby preventing the asset's price to move in a certain direction or point. They are the characteristics in technical analysis that every trader should be aware of.
They come in various forms because of the actions of the market in relation to the price of an asset. It can be simple, and it can also become complex. They can be spotted using trendlines, moving average, or psychological price points. But for this exercise, I shall be giving a basic idea of how to spot support and resistance levels using price charts.
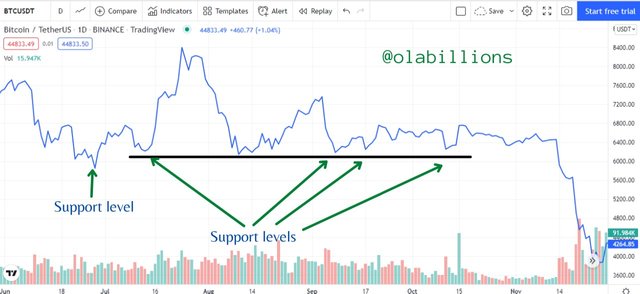
With the use of line charts identifying support and resistance levels is very easy. The way to identify support and resistance levels that are of relevance is with the use of recent market swings and scalps.
Support is a price level where there is a lot of buying ongoing which supersedes the price from depreciating a little further. So when a price is in a downtrend or downward movement it can experience a pause or change in direction of price due to the concentration of demand. A new support level is usually found above a previous resistance level, sometimes a prior resistance level once broken can become a support level.
 Tradingview
Resistance is a price level where there is a lot of selling ongoing which supersedes the price from appreciating a little further. So when a price is in an uptrend or upward movement it can experience a pause or change in direction of price due to the concentration of supply. A new resistance level is usually found below a previous support level, sometimes a prior support level once broken can become a resistance level.
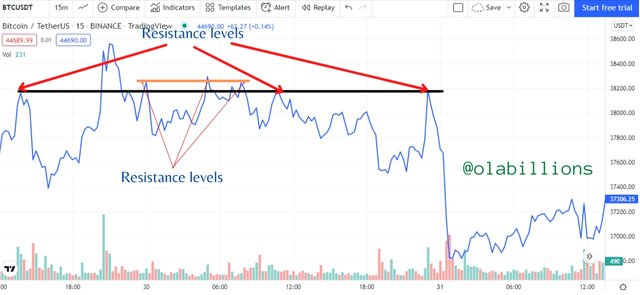 Tradingview
Differentiate between line charts and Candlestick charts.( Demonstrate with screenshots)

There are some differences between a line chart and a candlestick chart. I shall be discussing some of them.
Line Charts
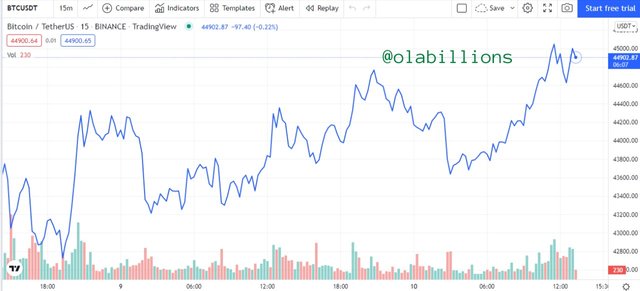 Tradingview
The first point is very obvious, line charts make use of lines that are continuous to touch data points which is mainly the closing prices of an asset.
Since they make use of only the closing price of an asset they provide significantly less information about the price of the asset.
Since they provide less information, they ultimately filter out the noise that would have been experienced in other types of charts such as candlestick charts.
Also because they provide less information, it makes it easier for traders to use.
The signals provided by line charts are easier to spot compared to candlestick charts.
The color coding is single (blue, but any choice of color can be used by the trader).
However, it is difficult to use line charts for trade setups involving stop loss and take profit level.
Candlestick Chart
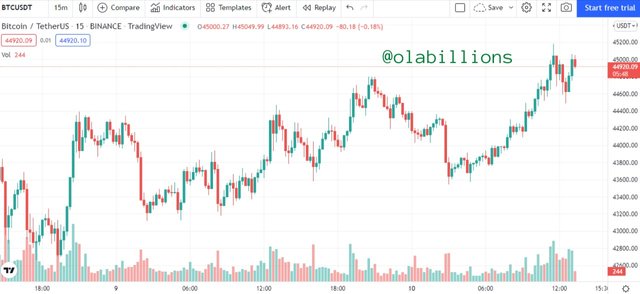 Tradingview
Makes use of histogram (candlesticks) which moves up and down during the price action of an asset for a given period because it makes use of the open, high, low, and close of an asset.
Since it makes use of the open, high, low, and close of an asset they provide so much information of the price of the asset.
Since they provide so much information, they give out a lot of noise that is being experienced when performing trading analysis.
Also because they provide so much information, it makes it more difficult for traders to use.
The signals provided by candlestick charts are difficult to spot compared to line charts.
The color coding is double (green and red, or any color combination to be used).
However, it is easier to use candlestick charts for trade setups involving stop loss and take profit level.

Explain the other Suitable indicators that can be used with Line charts. (Demonstrate with screenshots)

There are many indicators that can be suitable to be used in conjunction with a line chart. One of them mentioned in the course is Moving Averages. One good thing about moving averages is that they act as support and resistance during uptrends and downtrends. Also, they give insight into the strength of a trend, as the price gets closer to the moving average it shows that the trend is getting weaker and vice versa until it breaks it.
Another indicator that is also suitable is the Relative Strength Index, RSI. It is a momentum indicator that measures the magnitude at which recent price changes have occurred and at the same time evaluates the overbought or oversold condition of the price of an asset. It has 2 bands which comprise 100 and 0 values. The RSI line oscillates between 100 and 0 to give information. Generally, if the RSI line reaches 70, it signals an overbought condition and a trend reversal to the downside to occur. Likewise, if the RSI line reaches 30, it signals an oversold condition and a trend reversal to the upside to occur. It makes use of the closing prices of the 14 periods used as its default settings.
The RSI can be used in conjunction with the line chart because both indicators make use of the closing prices of the asset. Therefore, it means that the line chart and the RSI would move in a similar fashion which makes it easier for traders to use to predict the future movement of an asset.
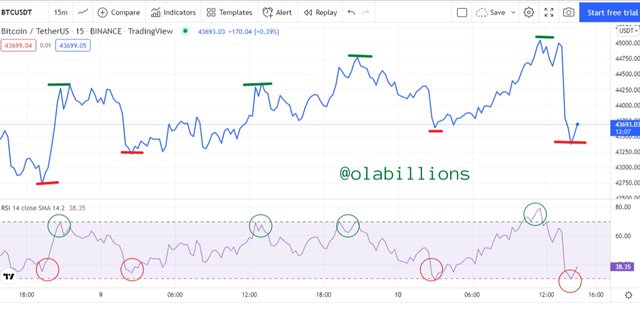 Tradingview
In the chart above we can see how the line chart and the RSI moved in a similar fashion. When the RSI line hits 30 it signals an oversold condition and a trend reversal to the upside to follow, this is shown by the red circle shape on the RSI indicator and the red lines on the line chart. In the same vein, when the RSI line hit 70, it signals an overbought condition and a trend reversal to the downside to follow, this is shown by the green circle shape on the RSI indicator and the green lines on the line chart.

Prove your Understanding of Bullish and Bearish Trading opportunities using Line charts. (Demonstrate with screenshots)

As traders, our sole purpose is to trade in the direction of the price movement. Trading with it helps traders to become profitable over time, trading against it makes the trader be at a loss and thus lose their accounts.
Previously I discussed how to identify trading opportunities using line charts and the RSI indicator. Here I'm going to show how to use the line chart and trading indicator to spot bullish and bearish trading opportunities.
Bullish Trading Opportunities
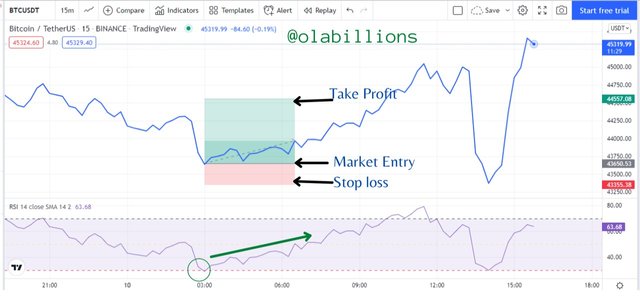
The image above consists of the line chart and RSI indicator. So the RSI hit the 30 mark which signaled an oversold condition and so is expected that there would be a change in the direction of the trend from the previous bearish one to a new bullish one.
So a trade setup was made with the market entry at the point where the price is about to change, the stop-loss placed below it and the take profit placed at a ratio of 3:1.
Bullish Trading Opportunities
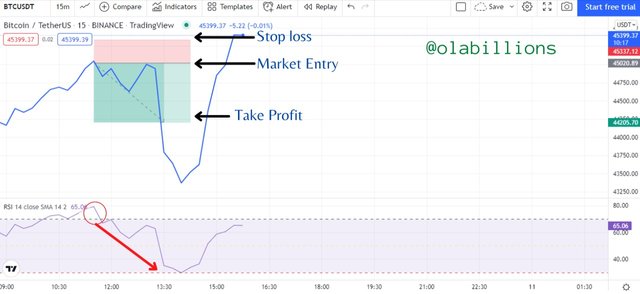
The image above consists of the line chart and RSI indicator. So the RSI hit the 70 mark which signaled an overbought condition and so is expected that there would be a change in the direction of the trend from the previous bullish one to a new bearish one.
So a trade setup was made with the market entry at the point where the price is about to change, the stop-loss placed above it and the take profit placed at a ratio of 3:1.

Investigate the Advantages and Disadvantages of Line charts according to your Knowledge.

| S/N | Advantages | Disadvantages |
|---|---|---|
| 1 | Makes use of only the closing price data | Doesn't use enough data points, so it gives less information |
| 2 | Very easy to read during analysis | It doesn't show the full activity of a trading period |
| 3 | Simple and easy to understand | Not suitable for traders who depends on much more information about an asset's price |
| 4 | Helps traders to spot support and resistance levels easily | It doesn't provide the actual nature of the markets |
| 5 | Filters out the noise experienced in other chart types | Doesn't allow traders to make use of rock-solid strategies which works using candlestick charts |
| 6 | Suitable for beginners traders |

Conclusion

Line charts are a type of chart which makes use of a continuous line that is drawn connecting the close of an asset's price. It is very simple and easy to use therefore it is very suitable for most beginner traders and also experienced traders to help them identify the movement of the price of an asset.
By using the line chart traders can spot support and resistance levels easily, they can also get bullish and bearish trading opportunities easily. It can be used along with other trading indicators such as Moving averages and Relative Strength Index to make better trading operations.
As simple and easy as the line chart is, there are advantages and disadvantages attached to it. Also, it is necessary that traders don't rely on only one trading tool when performing trade operations, it is best to use 2 or 3 trading tools that work in confluence with each other to give better results.
Regards:- @dilchamo