
It is with great pleasure to be a participant in this week assignment of professor @utsavsaxena11 which he taught about THE BICHI INDICATIVE STRATEGY, I can say I understood the class and I have been able to give back base on my own understanding and the research I made. I stand corrected in any way as I might have come short in details of a particular question.

Give a detailed analysis of BICHI STRATEGY. Starting from introduction, identification of trends, trend reversal in market, entry, and exit from the market, one demo trade, and finally your opinion about this strategy. (Screenshot required). [4 points]
Introduction to Bichi Strategy
The Bichi strategy is a trading strategy that makes use of two trading tools to perform trading operations. The cryptocurrency market is highly volatile which makes it inherently risky. So when performing trading operations it is always advisable to use more than one trading tool. Doing this would give the trader better accuracy in their trading activities.
The two trading tools that are used in the Bichi trading strategy are Bollinger Bands and Ichimoku Cloud. They both have their characteristics when used individually. They are both placed in the momentum categories of technical indicators. The name "Bichi" comes combining 'B' from Bollinger Bands and 'Ichi' from Ichimoku Cloud.
By using both trading tools during trading operations, it gives an 80% accuracy. This is a good number knowing how volatile the cryptocurrency market is.
Trend Identification Using the Bichi Strategy
Trading is all about trends, and it is in the best interest to always identify trends during trading activities. There are types of trends that are found in the market and they are uptrend, downtrend, and sideways trend. Our focus is on uptrend and downtrend, these are the trends I would explain using the Bichi strategy.
To get a trend in the market we have to look at the Bollinger Bands and the Ichimoku Cloud. The Bollinger Band has to provide resistance and support levels to the candlesticks and the price has to break out of the Ichimoku Cloud either up or down.
Uptrend
An uptrend is a situation in the market where the price of an asset is moving up. It is usually characterized by higher highs and higher lows.
To get an uptrend in the market the Bollinger Band has to provide resistance and support levels between the top band and the middle band (basis line). Once the Bollinger Band is providing support and resistance we then wait for the price to break above the Ichimoku Cloud.
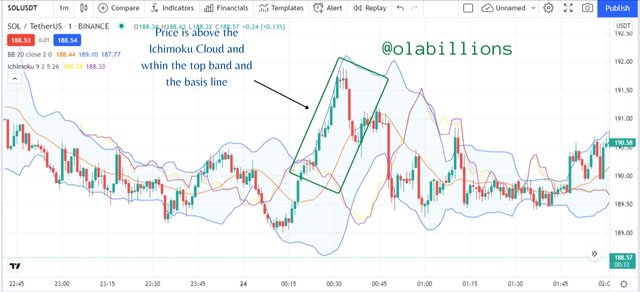
From the image above we can see that the price has broken above the Ichimoku Cloud and was in between the top band and middle band (basis line) of the Bollinger Bands. The middle band acted as a support level.
Downtrend
A downtrend is a situation in the market where the price of an asset is moving down. It is usually characterized by lower lows and lower highs.
To get a downtrend in the market the Bollinger Band has to provide resistance and support levels between the bottom band and the middle band. Once the Bollinger band is providing support and resistance we then wait for the price to break below the Ichimoku Cloud.
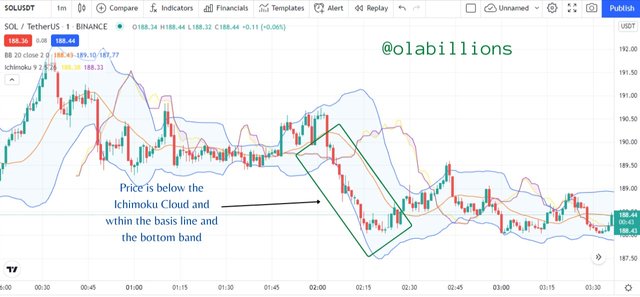
From the image above we can see that the price has broken below the Ichimoku Cloud and was in between the bottom band and middle band (basis line) of the Bollinger Bands. The middle band acted as a resistance level.
Using Bichi Strategy to Identify Trend reversal
Trend reversal is a situation in the markets when the price of an asset changes from a former trend to a new trend. The changes are usually from an uptrend to a downtrend or from a downtrend to an uptrend. Knowing when a trend reversal would occur can be very timely.
Bullish Trend Reversal
This is a trend reversal from a bullish movement to a bearish movement. The bullish movement is characterized by an uptrend and the bearish movement is characterized by a downtrend.
To identify the bullish trend reversal we look at the Bollinger Bands. The BB and price would be in a bullish movement then it enters a period where the price moves in a sideways movement where the price breaks the Ichimoku Cloud several times.
Once these conditions are confirmed we expect a bullish trend reversal to occur.
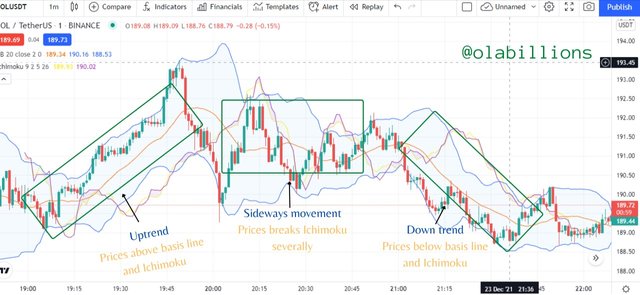
From the image above we can see that the price was in a bullish trend then it entered a period where the price moved in a sideways movement and broke the Ichimoku Cloud several times. After that, a downtrend occurred.
Bearish Trend Reversal
This is a trend reversal from a bearish movement to a bullish movement. The bearish movement is characterized by a downtrend and the bullish movement is characterized by an uptrend.
To identify the bearish trend reversal we look at the Bollinger Bands. The BB and price would be in a bearish movement then it enters a period where the price moves in a sideways movement where the price breaks the Ichimoku Cloud several times.
Once these conditions are confirmed we expect a bearish trend reversal to occur.
.jpg)
From the image above we can see that the price was in a bearish trend then it entered a period where the price moved in a sideways movement and broke the Ichimoku Cloud several times. After that, an uptrend occurred.
Market Entry and Exit using the Bichi Strategy
We can use the Bichi Strategy to make a market entry for a buy-side and a sell-side.
Buy-Side Market Entry
On the buy-side, the first thing to watch out for is a price moving in an uptrend. After that, we look at the Bollinger Bands to see if the price is between the top band and the basis line where the basis line acts as a support mechanism.
We finally see if the price breaks the Ichimoku Cloud to the upside, when it does we can place a buy market entry. When we make our entry we place our stop-loss level close to the basis line of the Bollinger Bands. Then we place our take profit with a risk to reward ratio of 1:1 or 1:2.
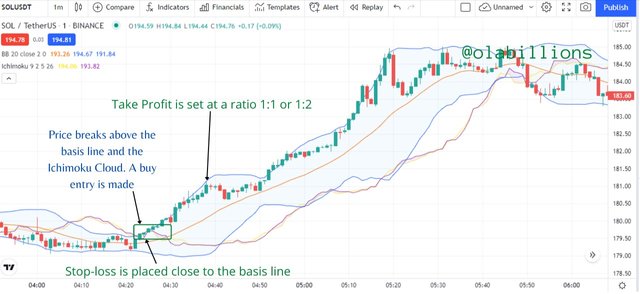
From the image above we can see that the price is moving in an uptrend. It is between the top band and the basis line (middle band), where the middle band acts as a support mechanism. It also breaks the Ichimoku Cloud to the upside. So a buy market entry is placed where the stop-loss is placed closed to the middle band and the take profit level is set at a risk to reward ratio of 1:1 or 1:2.
Sell-side Market Entry
On the sell-side, the first thing to watch out for is a price moving in a downtrend. After that, we look at the Bollinger Bands to see if the price is between the basis line (middle band) and the bottom band where the basis line acts as a resistance mechanism.
We finally see if the price breaks the Ichimoku Cloud to the downside, when it does we can place a sell market entry. When we make our entry we place our stop-loss level close to the basis line of the Bollinger Bands. Then we place our take profit with a risk to reward ratio of 1:1 or 1:2.
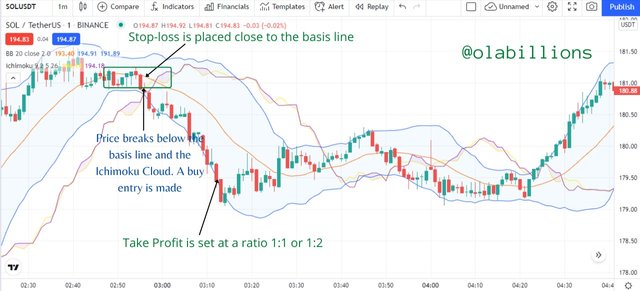
From the image above we can see that the price is moving in a downtrend. It is between the basis line and the bottom band (middle band), where the middle band acts as a resistance mechanism. It also breaks the Ichimoku Cloud to the downside. So a sell market entry is placed where the stop-loss is placed closed to the middle band and the take profit level is set at a risk to reward ratio of 1:1 or 1:2.
1 Demo trade with the Bichi Strategy
To begin this exercise, we identify a trend whether an uptrend or downtrend. After that, we look at the Bollinger Band to find support or resistance levels. Then we wait for the price to move above or below the basis line of the Bollinger Band. Finally, we wait for the price to break out of the Ichimoku Cloud either up or down. Once these conditions are achieved then a market entry is made.
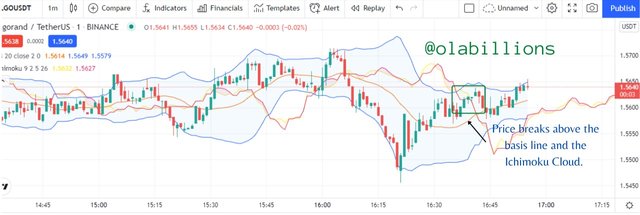
In the chart above we can see that the price was in an uptrend, then it was moving between the top band and the middle band (basis line) where the middle band acts as a support. Then the price also breaks from the Ichimoku Cloud.
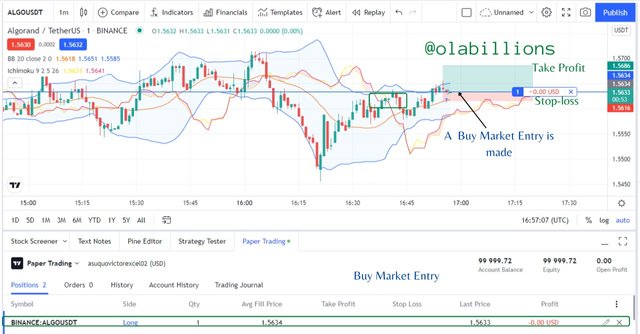
So a buy market entry was placed because the signals given are bullish. Then the stop-loss was placed close to the middle band (basis line) and the take profit was placed at a risk to reward ratio of 1:2.
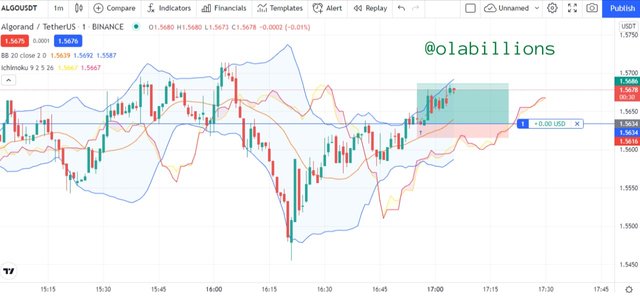
This is the final result of the trade as it almost reached the tip of the take profit level.
My Opinion about the Bichi Strategy
The Bichi strategy is mainly used for short-term trades but I feel it can also be useful for long-term trades.
Because it is mostly used in shorter timeframes it gives quicker profits than in a longer timeframe
It has a very strong confirmation mechanism whereby a trader needs to confirm a signal by looking at both the Bolinger bands and the Ichimoku Cloud.
It is an easy-to-use strategy as traders just need to wait and confirm certain conditions before they can engage the markets.
Finally, it gives up to 80% accuracy in winning trades which is a very good return, especially for novice traders.

Define briefly Crypto IDX and Altcoins IDX. What is signal prediction trading? Is it legal or ill-legal in your country? (Explain briefly) [2points]
Crypto IDX
Crypto IDX is the short form of Cryptocurrency Index. It is an index where 4 cryptocurrency assets are combined together to give a whole asset. The averages of the 4 cryptocurrency prices are combined together to form the Crypto IDX. The 4 cryptocurrencies are Bitcoin, Ethereum, Litecoin, and Zcash.
During the arrangement of the cryptocurrency index, another factor that was considered aside from the price is the demand and supply principles of the assets. It is an asset that is traded only on the Binomo platform.
Before being created there were some calculations that were done, however, these calculations were complex and needed the use of the software.
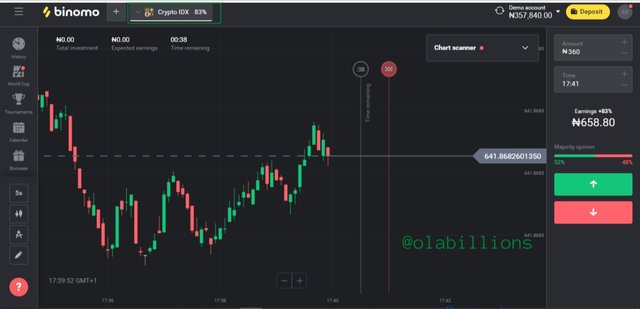
We can see in the image above the Crypto IDX on the Binomo platform. It shows that traders can get up to 82% in returns trading the Crypto IDX. It is also of note that this type of trading is prediction trading and not spot trading which is the service that Binomo offers.
ALT IDX
Alt IDX is the short form of the Alternate coins Index. It is very similar to the Crypto IDX. It has 4 cryptocurrencies that were used to create the asset. The 4 cryptocurrencies are Ripple, Litecoin, Monero, and Ethereum.
Just like the cryptocurrency index, the alternate coin index is created using the prices of the assets and the principles of demand and supply. Its calculations are based on software as they are equally complex.
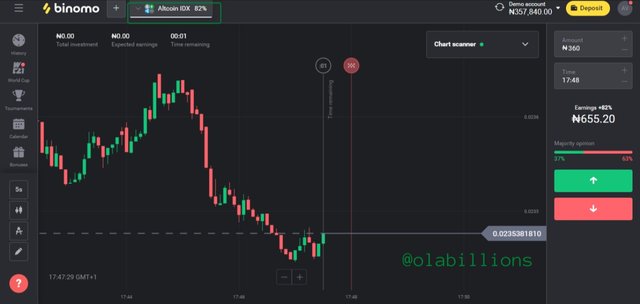
It is also exclusive to only the Binomo trading platform thus traders cannot engage in spot trading but in prediction trading using the Alt IDX.
What is signal prediction trading?
Signal prediction trading is a type of trading where traders predict the direction of the price within a stipulated time. It is similar to binary options where traders can choose any option up or down where the price would end up in.
It is different from spot trading as traders buy an asset and hold onto it for a given period of time depending on the timeframe and the method used.
This is where Crypto IDX and Alt IDX are useful. Traders predict where the value of the asset would end up within a specific time. It is exclusive to only the Binomo trading platform.
Is it legal or ill-legal in your country?
It is legal in our country because it is done on a reliable signal prediction trading platform called Binomo. The platform is available in more than 130 countries and has more than 700 thousand user base.
In addition to this, the Binomo trading platform is registered and regulated by the International Financial Commission (IFC) which approves of the services being rendered by Binomo. It has its customer care where users can make queries, and it also has a registered address for their office which is displayed on their platform's website.

If you want to create your own penny IDX, then which 4 penny assets will you choose, and what is the reason behind choosing those four assets. Define Penny currencies. (Explain, no screenshot required). [2points]
Hedera (HBAR)
Hedera is a public blockchain network where individuals and businesses can develop decentralized applications to run on it. It is a new generation blockchain that focuses on high performance and stability. It is created to be fairer, more efficient, and sustainable to users of the network. It performed its ICO in 2018 and in 2019 gave access to its mainnet to the public.
It has a native coin called HBAR. This token is used to run activities on the network like file storage, smart contracts, and initiating transactions. It is also used to maintain the network as users can stake their tokens and perform node activities.
Gala Games (GALA)
Gala Games is a game business that operates on blockchain technology. They aim to give the players of the game control of their games. They want to reinvent the gaming industry whereby players can spend hours and money on in-game assets and be rest assured that they have accomplished something positive. It also tries to inculcate creative thinking habits in their games as this allows players to be fully in control of the games.
It has a native token called GALA. This token can be used to participate in the governance of the network, it can be used for staking where players become nodes on the system, it can also be used to purchase non-fungible tokens NFTs.
The Graph (GRT)
The Graph network is a network that is an index where other networks such as Ethereum and IPFS can get data. It is used to allow many decentralized applications (defi) to run, it is also used in the web3 ecosystem. Developers can create open APIs on the Graph network which are called subgraphs. These applications make queries using GraphQL to retrieve blockchain data. Currently, it only supports indexed data from Ethereum, IPGS, and POA, however, more networks are to be supported very soon.
Presently there are more than 3000 subgraphs that have been developed by thousands of developers. They include Uniswap, Synthetix, Aragon, AAVE, Gnosis, etc.
It has a native token called GRT. This token can be used to provide indexing, curating, and delegating services.
Harmony (ONE)
Harmony is a blockchain network where developers can create decentralized applications to run on it. It makes use of the consensus mechanism called Random State sharding, as this allows the network to be highly scalable.
Ethereum is a network that is known for onboarding developers with diverse kinds of decentralized application, however, due to the demand of their network and the consensus mechanism currently in use, activities on the network is usually very slow. This is where Harmony comes to the fore.
It has a native coin called ONE.
Penny Currencies
A penny currency (cryptocurrency) is one where the value of the currency at the markets is at $1. It could be higher than this and it could be lower than this, but it is usually between $0.5 and $5. The reason why it is so is because of some factors that are directly affecting the cryptocurrency such as its newness to the market, its presence on big cryptocurrency exchanges, its utilities, and its competitors in the markets.
These cryptocurrencies are usually very risky to trade or invest in because they are usually very illiquid. Because they are not in big exchanges they are hardly traded and are not well known in the cryptocurrency community. So it is very important that traders get careful while engaging in such cryptocurrencies.

Conclusion
The Bichi strategy is a strategy that is suitable for use in the cryptocurrency markets. It consists of the Bollinger Band indicator and the Ichimoku Cloud indicator. These two indicators are commonly known as momentum indicators among traders because they usually show the direction in which the momentum of price usually moves in. By extension, this strategy can also be used in other financial markets such as Forex, Stock, and Commodity markets. It is best used in shorter timeframes usually between 1 min to 30 mins, but it can also be used in higher timeframes such as 1 hour to daily.
Crypto IDX stands for Cryptocurrency Index. It is a combination of 4 different cryptocurrencies where traders have the opportunity to trade them. During the creation of the Crypto IDX the prices used were calculated using the software. This is also the case for Alt IDX. It stands for Alternate coin Index, but the cryptocurrencies used are different from that of Crypto IDX. Both indexes are traded exclusively on the Binomo platform. However, traders don't engage them on spot trading but on signal prediction trading where traders predict the direction where the value of an asset would be at at the close of the predictions made.
Penny cryptocurrencies are cryptocurrencies that are trading at a value between $0.5 and $5. But it is usually in the region of less than $1. They are called penny cryptocurrencies because the amount needed to invest or trade in these currencies is minimal, also they represent new cryptocurrency start-ups. When engaging them, traders should be very careful because they are usually very risky assets.