Thank you, Prof; @kouba for another well detailed class. Thank you for putting so much efforts into teaching us all.

pixabay
In your own words, give a simplified explanation of the CMF indicator with an example of how to calculate its value?
Marc Chaikin bring Chaikin Money Flow (CMF) to existence in the year 1980s as a technical indicator that measures the flow of money volume in a specific period. We can figure out purchasing pressure or selling pressure on the market with the CMF indicator. This indicator's idea is; when the closing price move close to the high, a retained earning is evident and if the closing price is close to the low, then a distribution happens. Commonly, CMF is used to confirm a trend, it measures the strength trend or points out potential trend breakouts or reversals.
CMF is a technical analysis indicator that's useful for measuring Money Flow Volume over some time set. Money Flow Volume is a meter used to measure the purchasing and selling pressure of security for a period.
CMF then calculate Money Flow Volume over a user-defined look-back period. We can use any look-back period. Howso, the most popular settings are always 20 or 21 days. CMF's Value swings between 1 and -1. Chaikin Money Flow can be used as a way forward to quantitate changes in the pressure of buying and selling and it can help to know the future changes and therefore trading chances.
Chaikin Money Flow value can be calculated in the three steps:
Money flow multiplier
The first step is to conclude each period’s money flow multiplier as follows:
MFM = ((Close value - Low value) - (High value - Close value)) ÷ (High value - Low value)
Money flow volume
The second step is to compute the money volume flow, and it can be done if you multiply the volume for the period that the money flow in multiplier, as acquired in step one. It is mainly calculated daily but it can be done otherwise, like hourly or weekly.
Money Flow Volume is equal to Money Flow Multiplier × Volume for the Period.
CMF
The third and last step is to compute the CMF value. Easily, if you divide daily money flow on a certain given time by the sum of volume for the same period. 21 days is the default number of periods for CMF as this typifies the trading over the past month.
CMF ≠ 21-day Average of the Daily Money Flow ÷ 21-day Average of the Volume
2. Demonstrate how to add the indicator to the chart on a platform other than the tradingview, highlighting how to modify the settings of the period(best setting). (screenshot required)
I'll make use of bittrex . bittrex.com is the site URL:

Bittrex home page
Click on market, then choose market

So, I clicked on indicator then I searched for CMF
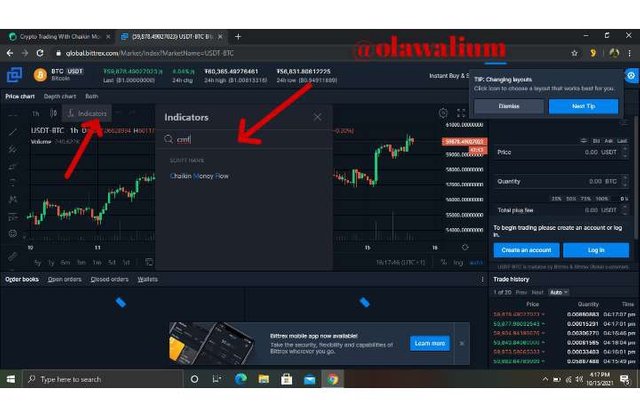
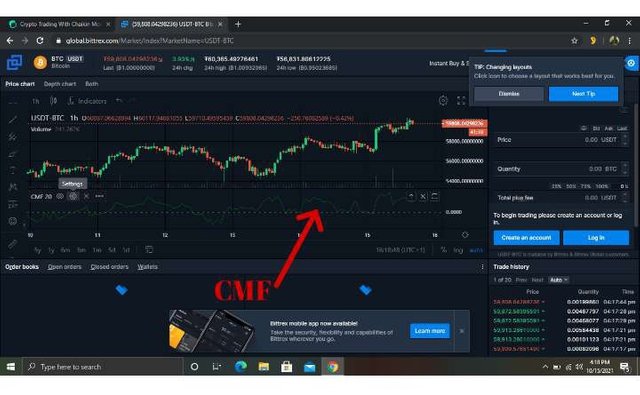
How to modify the settings of the period
I clicked on settings on the icon at the tip of the CMF Indicator then I brought input and style option
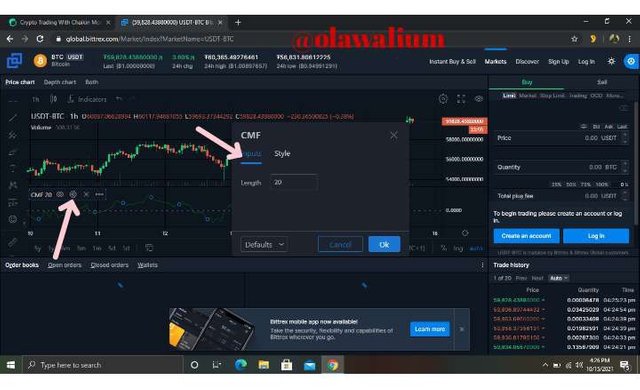
I prefer not to change the settings since the best settings are 20 to 25 and it already has 20
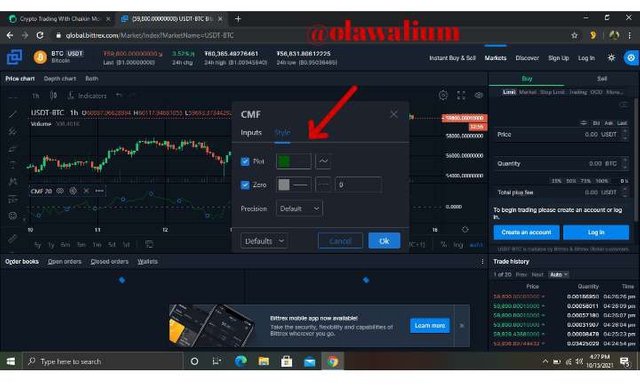
the styles
3. What is the indicator’s role in confirming the direction of trend and determining entry and exit points (buy/sell)؟(screenshot required)
Since CMF is an indicator that points out where the pressure of purchasing and selling pressure is in the market, then the purchasing and buying pressure can as well serve as a pointer to tell us where the trend is moving to if it's a Bullish trend or bearish trend or divergence trend. The movement of CMF indicator that's under the price in a chart would tell us the kind of trends that's on.
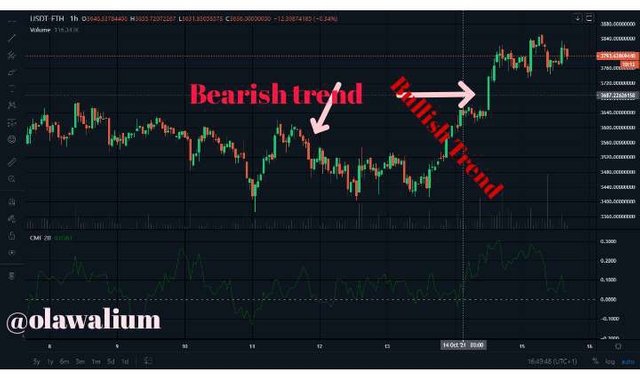
CMF indicator follows the price, as price moves, it moves as well, so it can dictate or tell us what is happening in the market, either Bullish or bearish, either to purchase or to sell.
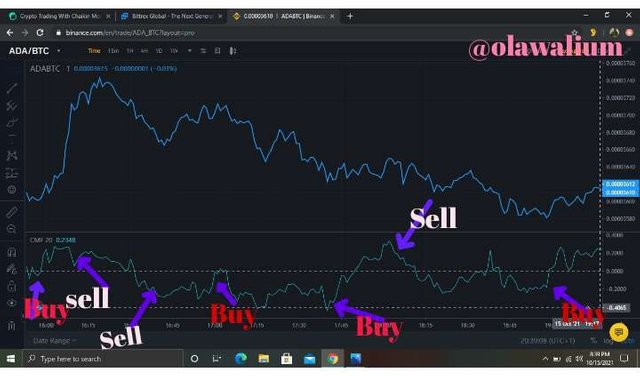
4. Trade with a crossover signal between the CMF and wider lines such as +/- 0.1 or +/- 0.15 or it can also be +/- 0.2, identify the most important signals that can be extracted using several examples. (screenshot required)
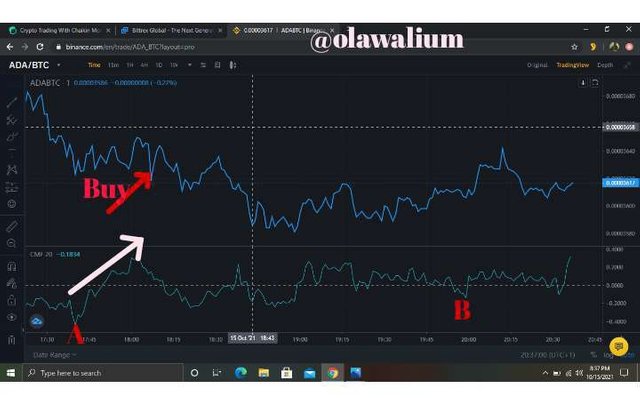
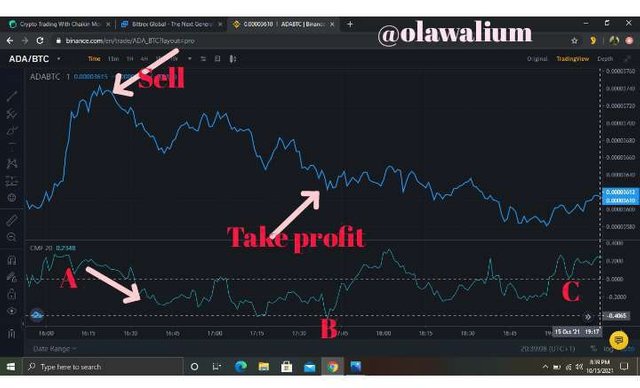
5. How to trade with divergence between the CMF and the price line? Does this trading strategy produce false signals? (screenshot required)
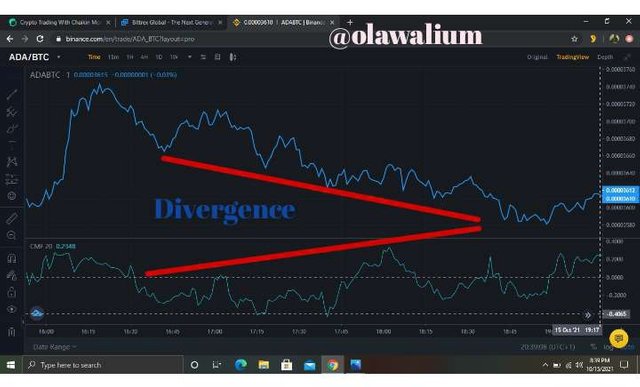
Just as divergence happens in all other indicators, it happens in CMF as well, there are times that price and CMF move in different directions in the market trends and that's called divergence but this can still be a benefit because some divergence moments can be a big trend reversal which we can trade at a perfect price.
We have Bullish divergence and bearish divergence
Bullish divergence is when the market direction is moving up in bullish trend but CMF moves down in bullish trend while Bearish divergence is when the market moves down in bearish trend but CMF moves up in bullish trend.
Conclusion.
CMF is a technical indicator that has features showing where the pressure of buying and selling is in the trading market. Several indicators have this same feature as well but in other to use it wisely, indicator like moving averages is advice to be used with it for successful or smooth trading.
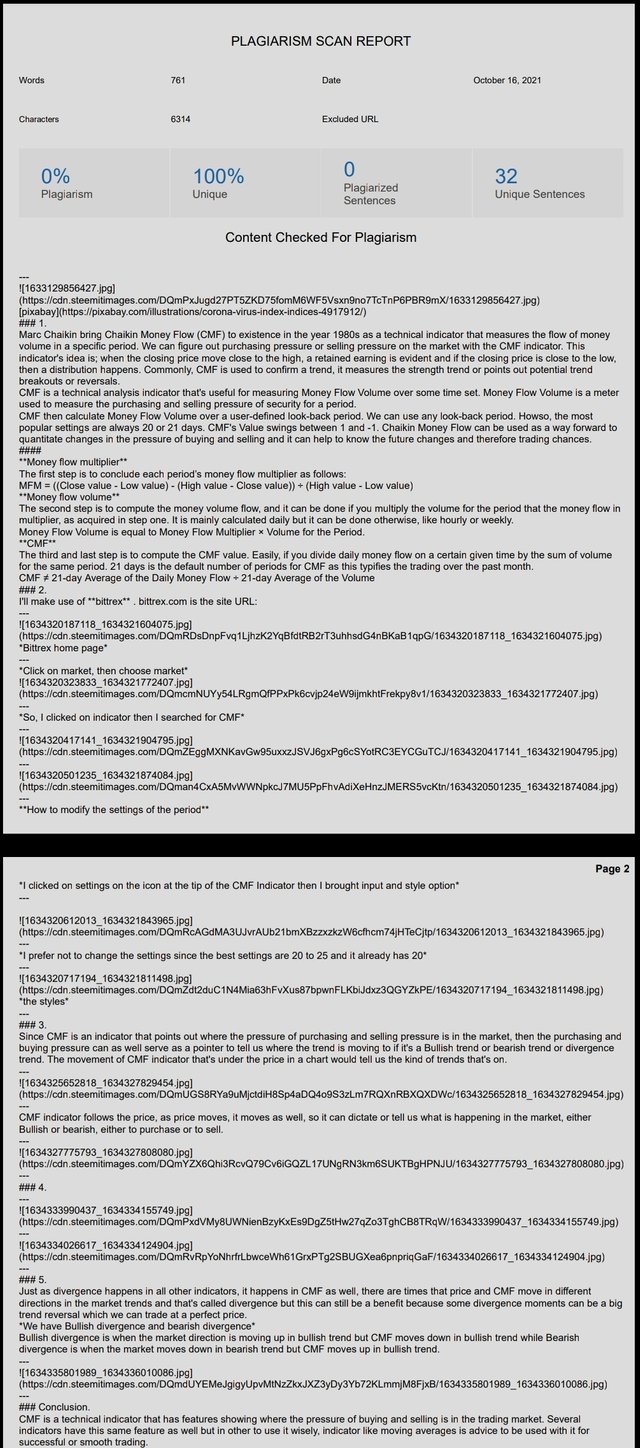
Plagiarism Report:
Thank you for your time.
My pen doesn't bleed, it speaks, with speed and ease.
Still me,
My tongue is like the pen of a ready writer.
Olawalium; (Love's chemical content, in human form). Take a dose today: doctor's order.


Unfortunately @olawalium , your article contains plagiarized/Spun content
Total|0/10 rating
Sources:
https://currency.com/how-to-read-and-use-the-chaikin-money-flow-trading-indicator
https://patternswizard.com/chaikin-money-flow-indicator/
The Steemit Crypto Academy community does not allow these practices. On the contrary, our goal is to encourage you to publish writing based on your own experience (or as per the mission requirements). Any spam/plagiarism/spun action reduces PoB's idea of rewarding good content.
Thank you.
Cc: -@endingplagiarism @sapwood
Downvoting a post can decrease pending rewards and make it less visible. Common reasons:
Submit