Hello everyone, this is season 5 week 8 of the steemit crypto academy. This week’s lecture was delivered by professor @reddileep and it was on Fractals. After going through this lecture, I have decided to try my hands on the given task.

1- Define Fractals in your own words.
As we have learnt previously, the forces of demand and supply have a huge influence on cryptocurrencies and for this reason prices in the crypto market fluctuates constantly on a daily basis. The patterns that are formed during these changes tend to repeat themselves periodically and traders rely on these repetitions to make their predictions. Some of these patterns that are used by traders include; engulfing patterns, inverted hammer, double bottoms, double top among others.
When using the chats for analysis, these patterns are formed on the chart and they provide the necessary ingredients that traders need to make their predictions. When these patterns repeat themselves they are referred to as fractals. The market situation at a particular point in time determines the structure of the fractal which can either be bullish or bearish. Most traders rely hugely on these fractals to make their entries and exits in a market. When they see similar patterns appearing again, the traders expect that the market will follow a similar trend again and they make a decision at that point.
The idea of fractals has been used to design most of the technical indicators that traders use for their analysis. It makes it easier for these indicators to identify the fractals patterns on the crypto charts. One of the common indicators that was developed to to spot these fractals is the Williams Fractal Indicator.

2- Explain major rules for identifying fractals. (Screenshots required)
In trading, some procedures must be followed in order to get the correct criteria that can be used to implement the strategies correctly. The identification of fractals is not an exception and in this section I will be discussing the rules to be followed in the identification of these fractals.
To start with, we have to ensure that we see an impulse that we can see at least 5 consecutive candles in a certain pattern. When we observe a pattern but the consecutive candles are less than 5, it is an indication that the fractal pattern might not be very precise and it has a low accuracy level. The best decision to take is to find s movement that will give a fractal pattern of 5 consecutive patterns and this pattern is more likely to be very accurate.
After that, we have to be clear as to whether we are looking for a bullish fractal or a bearish fractal. At this point we identify the direction of the asset at this moment and then study it properly with the hope that that same trend will repeat itself at some point and that it will be a fractal.
We will now take a look at the two types of fractals which are the bullish fractal and bearish fractal.
Bullish Fractal
The identification of a bullish fractal is very simple when we pay close attention. In our attempt to identify the bullish fractal, we must ensure that we can see a lower low and 2 higher lows on either side of the middle candle. This middle candle in this situation must be the lowest low as seen in the chart below. When this happens we can conclude that there is a bullish fractal.
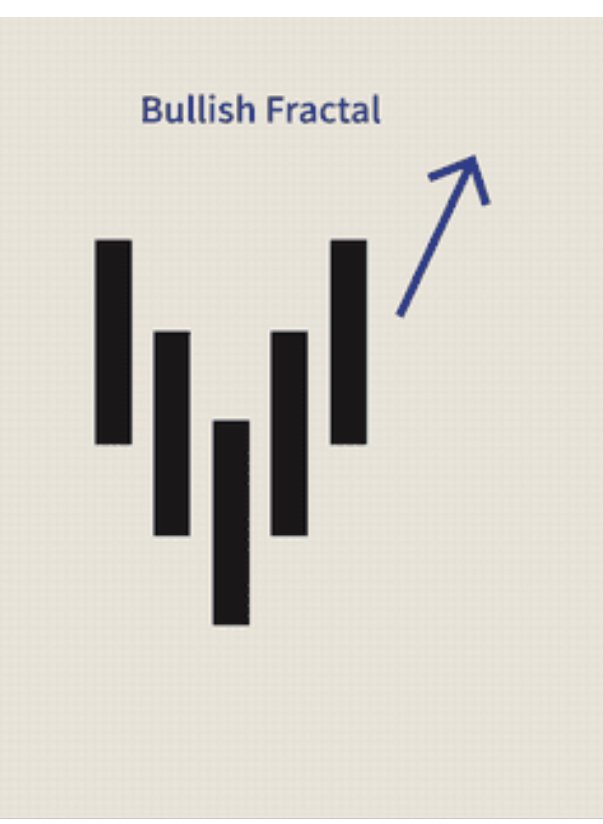
source
The picture above is an indication of how a bullish fractal can be identified. Looking at it we could see that there is a candle that is the lower low and then there is a higher low on the other side. When this happens we can conclude that there is a bullish fractal.
Bearish Fractal
Finding the bearish fractal means we will apply the inverse of the procedures we discussed in the bullish fractal. In our attempt to identify the bearish fractal, we must ensure that we can see a higher high and 2 lower highs on either side of the middle candle. This middle candle in this situation must be the highest high as seen in the chart below. When this happens we can conclude that there is a bearish fractal.
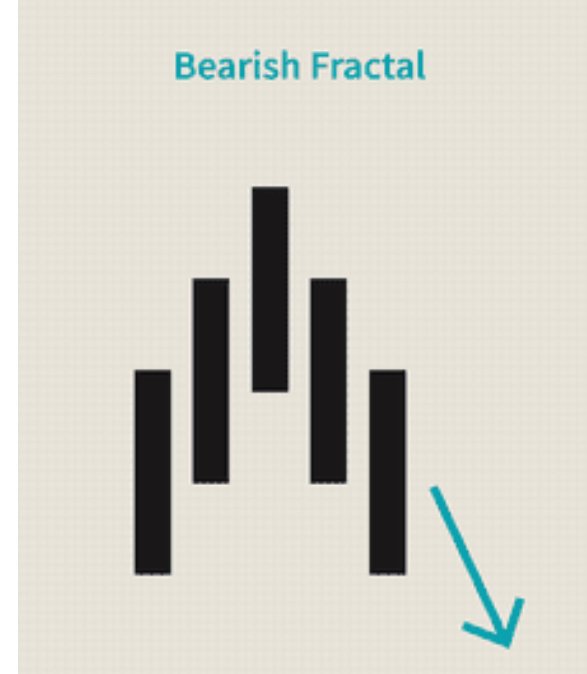
Source
The picture above is an indication of how a bearish fractal can be identified. Looking at it we could see that there is a candle that is the higher high and then there is a lower high on the other side. When this happens we can conclude that there is a bearish fractal.

3- What are the different Indicators that we can use for identifying Fractals easily? (Screenshots required)
In the previous questions, we have thrown more light on the meaning of fractals. Now that we know the meaning of fractals, let's move on to look at some of the indicators that were purposely for fractals. Some of these indicators include the Williams fractal indicator, fractal regression bands, fractal breakouts, fractal support and resistance among others. Let's discuss some of these below.
- William's Fractal Indicator
Red and green arrows appear on the chart when we add the Williams fractal indicator. These arrows represent the indicator. The bullish fractal is represented by the red arrows that can be seen at the lower side of the chart and these arrows are pointing downwards. These red arrows give an indication of a bullish trend.
The bearish fractals on the other hand are represented by green arrows and these arrows can be found on the upper part of the chart and always point upward. These green arrows give an indication of a bearish trend.
Due to the constant appearance of the fractal on the price chart, sometimes this could prove difficult to be understood by traders except for scalpers who find it much easier to use the fractals. For this reason it is not appropriate to use any point of these fractals as entry/exit points so we can use other indicators with fractals to help us in identifying entry or exit points.
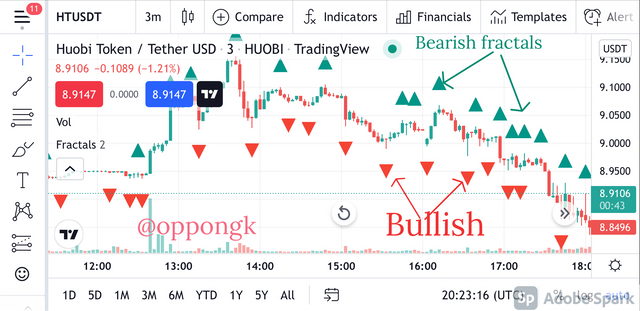
Screenshot from tradingview
The orientation of the fractal arrows can be seen clearly in the chart above.
- Fractal Support and Resistance
In this section we will discuss the fractal support and resistance as well as the fractal breakout strategy. In previous lessons we have had many discussions on support and resistance. We know that support happens when a bearish trend stops for a while and then bounces back to become a bullish trend. Resistance on the other hand happens when a bullish trend stops for a while and bounces downwards to become a bearish trend. This is the same principle that the fractal support and resistance follows. The support is denoted by the red lines whilst resistance is denoted by green lines.
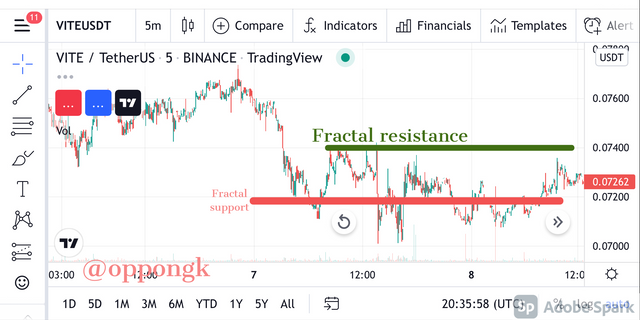
Screenshot from tradingview
Now let's take a look at how the fractal breakout strategy works. This strategy operates with the principle that at a point where the fractal support is broken, the price will continue to make a further downward trend and then traders are expected to exit the market at this point. On the other hand when the fractal resistance is broken, the price is expected to continue making an upward trend hence traders are expected to enter the market at this point.
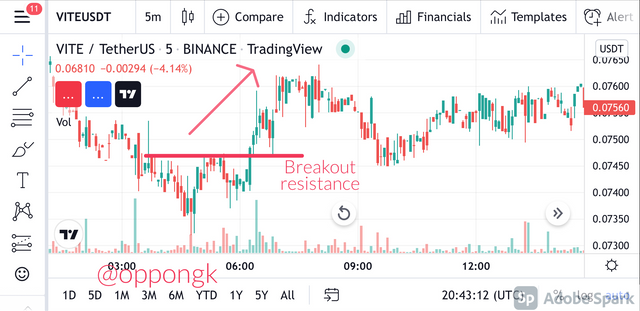
Screenshot from tradingview
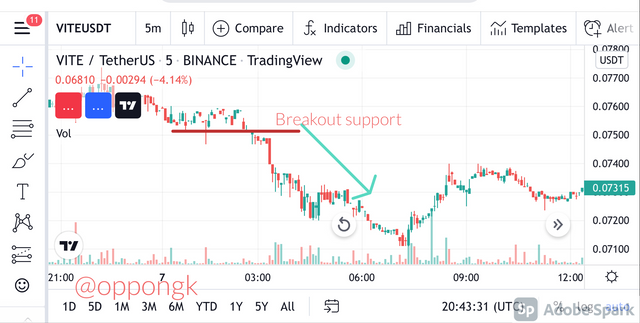
Screenshot from tradingview
The chart above clearly indicates the principle of fractal breakout for both bullish and bearish trends.

4- Graphically explore Fractals through charts. (Screenshots required)
In the previous discussions above, we have discussed a lot about fractals already. We have looked at both bearish and bullish fractals as well as how they are represented on the chart. In this section we are going to explore these fractals graphically by the use of trading tools and I have decided to use tradingview in this section.
After opening tradingview, we will select the "Bars Pattern". Then we will choose the fractals on the chart. Then we will try to find out other patterns as well on the chart.
DOT/USDT
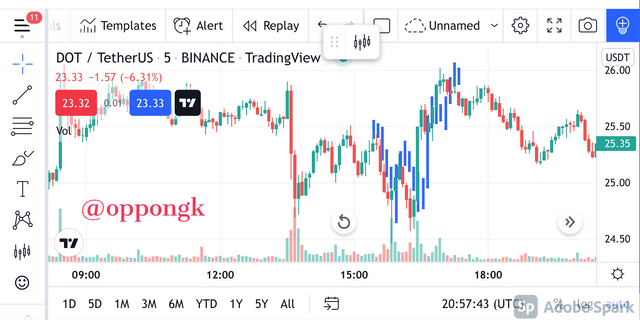
Screenshot from tradingview
Looking at the chart above, I decided to choose a point when there was an uptrend and then a sudden drop. Then subsequently I will try to locate a point on the chart when a similar trend has repeated itself. Looking at the below chart, we can see that the pattern has repeated itself though there is some slight difference. The strategy of fractals was applied to determine this.
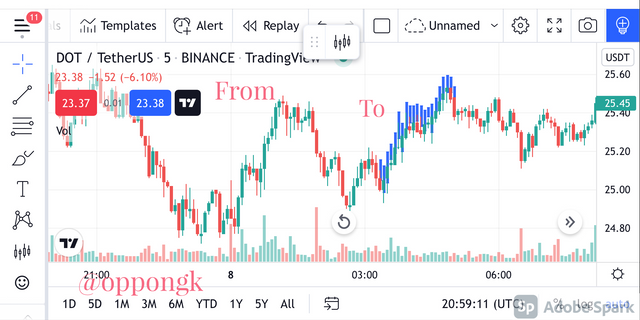
Screenshot from tradingview
RUNE/USDT
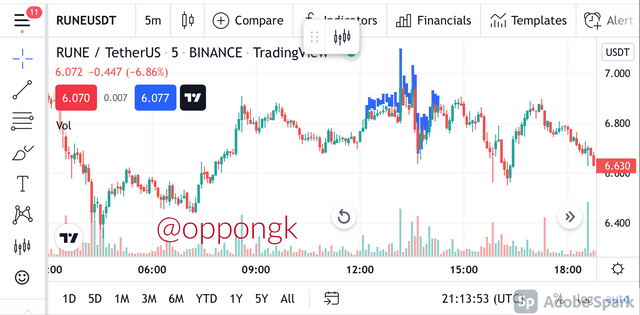
Screenshot from tradingview
In this part, I have chosen another bullish trend. But this time it is a continuous bullish trend with a swing high and a higher high. This fractal was chosen and then subsequently it repeated itself and this can be seen clearly on the chart below.
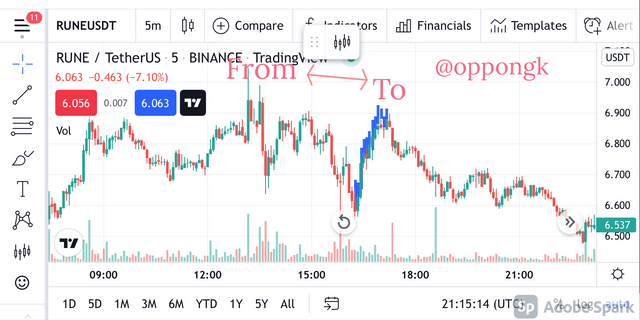
Screenshot from tradingview

5- Do a better Technical Analysis identifying Fractals and make a real purchase of a coin at a suitable entry point. Then sell that purchased coin before the next resistance line. Here you can use any other suitable indicator to find the correct entry point in addition to the fractal. (Usually, You should demonstrate all the relevant details including entry point, exit point, resistance lines, support lines or any other trading pattern)
I will be making a technical analysis on BAKE/USDT by the use of the Williams fractal indicator. I will use the tradingview site for the technical analysis and then go on to buy the asset on Huobi pro exchange.
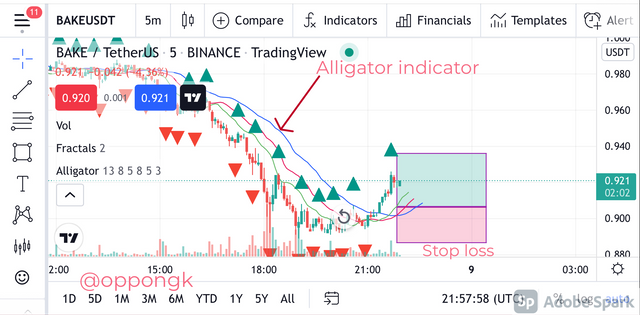
For the Williams fractal indicator to produce very accurate results, it is appropriate to combine it with another indicator to confirm the results. In this case I have decided to combine it with the Alligator indicator.
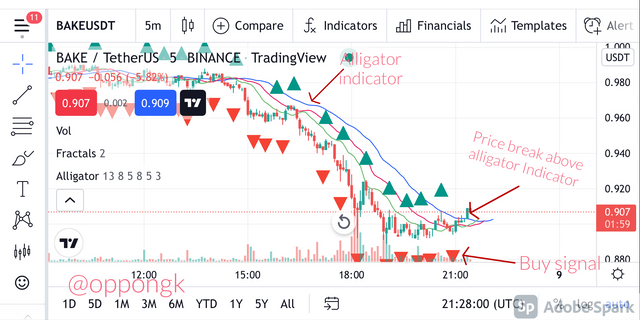
Screenshot from tradingview
For the situation in the chart above, it was an indication of a bearish trend because the price was moving below the Williams alligator. Selling signal is denoted in the market at this point. Then we can observe that the price subsequently broke and moved above the Williams alligator. This depicts a sudden change in trend from bearish to bullish. Conversely, we can see that the alligator indicator we added also showed a bullish signal by displaying a red arrow. At this point in time we had to take a buy trade when I saw the reaction of the price.
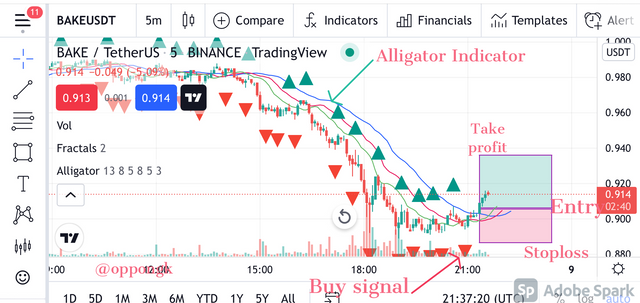
Screenshot from tradingview
I then placed my stoploss under the alligator indicator and then the take profit placed within the preceding resistance with a risk-reward ratio of 1:1RR. The steps in the chart above shows when I will exit the market.
The executed trade can be seen below.

Screenshot from tradingview : Buy order
At some point I exited the market automatically because as seen below the price came down to touch the stoploss level. Now that the price went below the Williams Alligator, the bullish setup was no longer valid.
Screenshot from tradingview

Screenshot from tradingview: Sell Order
Conclusion
Fractals can be very helpful to traders because they can help them to identify relevant chart patterns which will help them to make the best decisions for trading. As we discussed many indicators have been developed which follow the principles of fractals and they help us to spot when the patterns look likely to be repeated. However as in the case of other indicators, we cannot rely solely on these fractals for decision making and for that matter we combine them with other indicators to ensure more accurate results.
Thank you once again professor @reddileep for this detailed lecture.
Hello @oppongk,
Thank you for participating in the 8th Week Crypto Course in its 5th season and for your efforts to complete the suggested tasks, you deserve a Total|8.5/10 rating, according to the following scale:
My review :
Work with good content, because you have taken every question seriously, allowing you to get answers that are precise and in-depth in its analysis and clear in its methodology.
You have demonstrated a good understanding of fractals as a trading tool for cryptocurrencies based on your own words.
In the second question you have provided clear screenshots to explain the main rules.
In the third question you have done a good job on which you have discovered several indicators with which you can easily identify fractals with the possibility of going into certain details.
In the fourth question, a brief answer in which you provided clear graphics that allowed us to understand the exploration of fractals graphically with the possibility of deepening certain details as well.
In the fifth question, you have passed a good technical analysis to identify fractals and was followed by an actual purchase of a currency at an appropriate entry point, clearly mentioning several details of different signals such as levels support and resistance, as well as deviant entry and exit points.
Thanks again for your effort, and we look forward to reading your next work.
Sincerely,@kouba01
Downvoting a post can decrease pending rewards and make it less visible. Common reasons:
Submit
Thanks so much for verifying my work. All recommendations are welcomed! My pleasure 😃!
Downvoting a post can decrease pending rewards and make it less visible. Common reasons:
Submit