Hello everyone, welcome to season 5 week 3 of the steemit crypto academy. This week's lecture was delivered by professor @kouba01 and the topic was based on Alligator Indicator. After going through this lesson carefully and understanding it, I decided to try my hands on the task given.
1. Discuss your understanding of the use of the Alligator indicator and show how it is calculated?
Bill William invented the Alligator indicator. This indicator is used in the study of trends of prices of assets and used in the identification of buy and sell signals and also when trends are about to take a reversed pattern, this indicator is used to predict that. There are three moving averages present in the Alligator indicator. These moving averages help is to be able to identify the trends in the market by showing a clear development structure of the market.
This Alligator indicator behaves like the animal called crocodile because this animal spends most of it's time sleep and when it wakes up it feels very hungry and for that matter it attacks it's preys with much anger and aggression. this is the same scenario that usually happens in the market. It is believed that most of the time, 75% of the market is always at sleep which means there is no movement in the market whilst the remaining 25% is the part that is actively supporting the movement of trends in the market.
The graph below is an illustration of an Alligator indicator. We can see three different lines in the chart which represents the moving averages. These are likened to the mouth of a crocodile because the moving averages are used to determine the trend of the assets at a particular time.
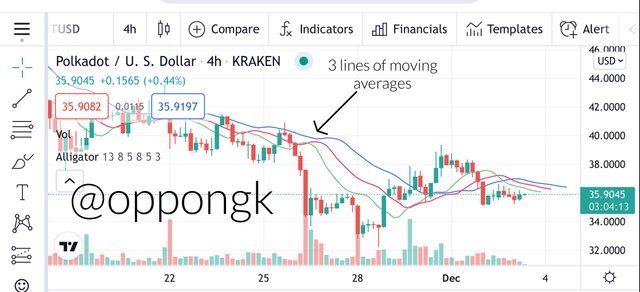
screenshot from Tradingview
For us to enter into the calculations, we have to look at the composition of the three lines have influence on the mouth of a crocodile.
Blue (Jaw): When the Alligator indicator is added to the chart, the blue line that is seen is known as the jaw. This jaw has a moving average of 13 period. It also has a future shift of 8 periods.
Red (Teeth): The line with the red color which is added is called the Teeth. The moving average of the teeth is going to 8 periods. The future shift is also going to be 5 periods.
Green (Lips): The lips is the other line in the Alligator indicator which has a color of green. The moving average of the lips is 5 periods whilst it's future shift is 3 periods.
The above features will be used to derive the formula for calculating the Alligator indicator. The steps involved are highlighted below.
Average Price = (High + Low)/2
Jaw of Alligator = SMMA (Average Price, 13, 8)
Lips of Alligator = SMMA (Average Price, 5, 3)
Teeth of Alligator = SMMA (Average Price, 8, 5)
The meaning of the shortcuts used above are explained below.
SMMA: Smoothed moving average
SMMA (1): Medium price
SMMA (2): Smoothing periods
SMMA (3): Future displacement
High : The highest point of the bar
Low : The lowest point of the bar
When we apply this formula, we will be able to attain the right information on the Alligator indicator. The indicator involves the use of mathematics so these calculations will help us attain the correct data and then after obtaining these data, we can combine this with other technical analysis tools which will help us to be able to predict the prices of assets using the signals of the combined indicators. this will help us to know when to enter and exit a market.
There can be fluctuations or display of late signals by the moving averages of the Alligator indicator. This may happen as a result of the calculation of periods that have passed already. To be able to care for this difficulty, there are displacement of future periods and these future periods have the ability to give more accurate results more than the current happenings in the market with regards to the new bars as well as they are able to spot every opportunity present in the market. So for that matter there are 3 different lines which are used for the confirmation if signals and will also help to detect whether or not the market is making a trajectory or it is in a passive stage so that we can make the right decision as traders.

2. Show how to add the indicator to the chart, How to configure the Alligator indicator and is it advisable to change its default settings ?. (Screenshot required)
Adding of Alligator Indicator to the chart
For us to be able to add the Alligator indicator to a chart, we have to visit the official site of tradingview.com before we can demonstrate it.
After opening the tradingview site successfully, we look on the homepage and click on the chart option.
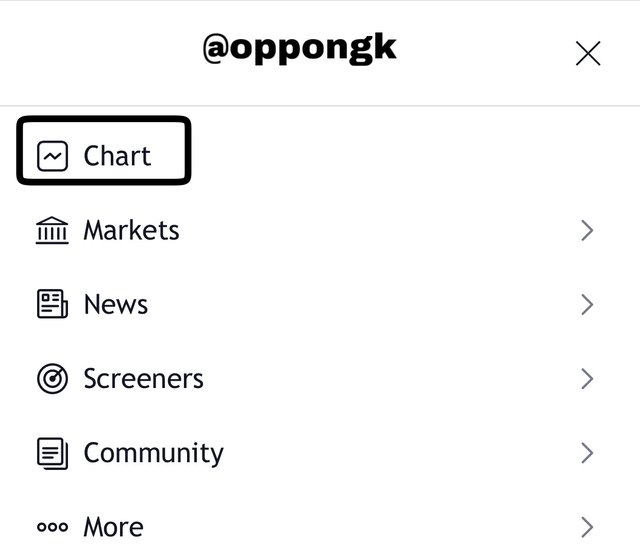
screenshot from Tradingview
Then at the top of the chart, we will see the indicator option then we click on it.
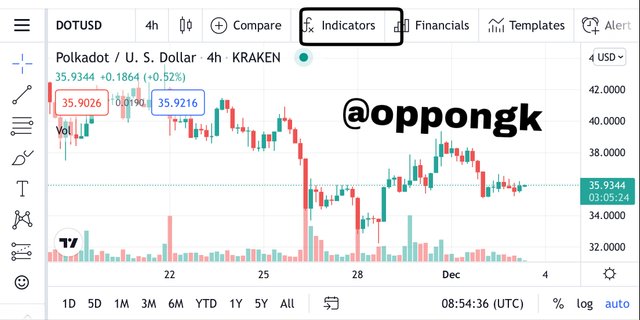
screenshot from Tradingview
A search bar will appear after we click on the indicator symbol, the we enter Alligator indicator. For this tradingview, it will appear as williams indicator so we click on it
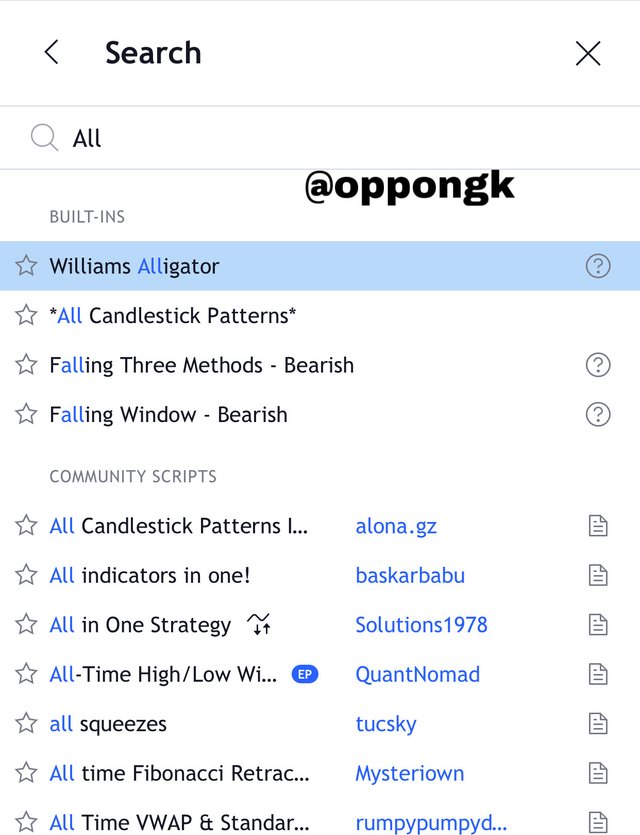
screenshot from Tradingview
The indicator will be added to the chart immediately after we click on it. This can be seen in the chart below.
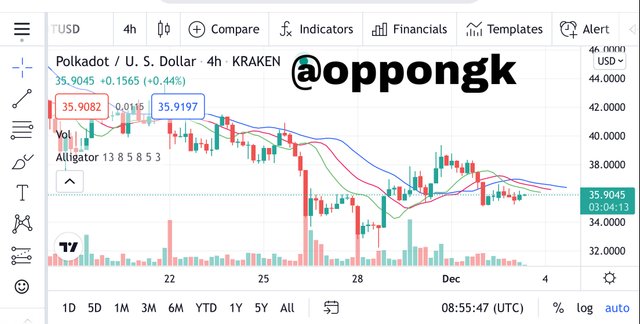
screenshot from Tradingview
How to Configure the Alligator Indicator
The Alligator indicator settings are found on the chart as shown below. So if we want to configure the indicator, we click on the settings.
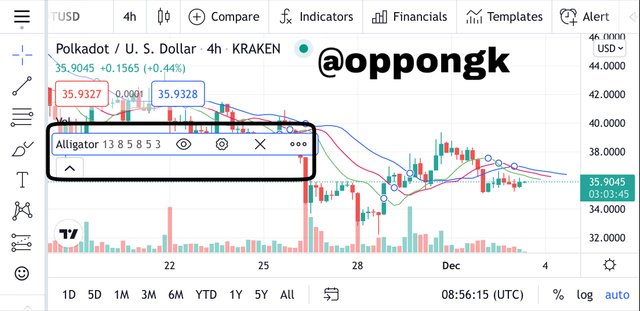
screenshot from Tradingview
Then we will click on Inputs after opening the indicator settings. The default settings of the Alligator indicator will appear. This can be seen in the chart below.
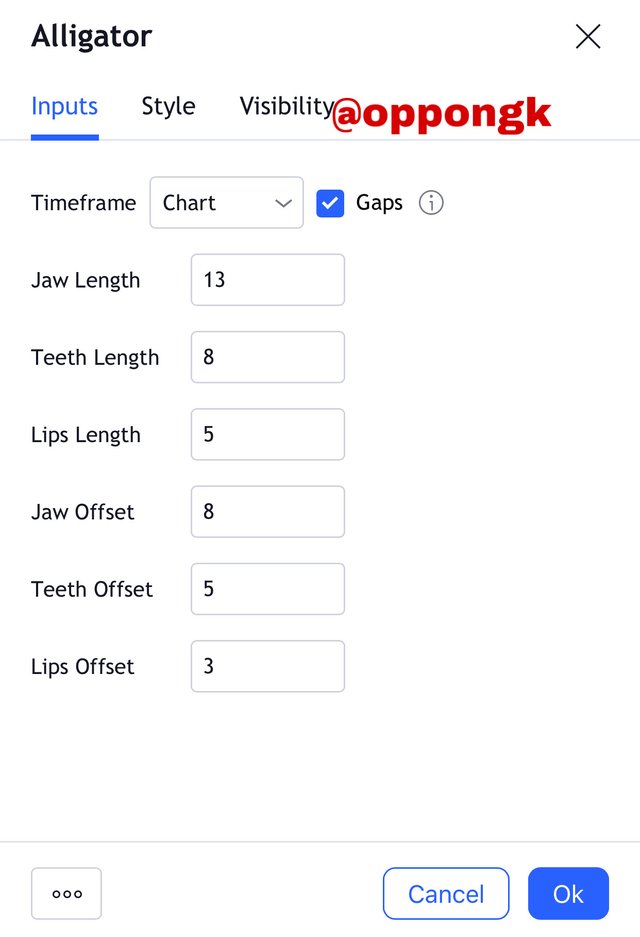
screenshot from Tradingview
After that we click on style. After that we can see that there is a pop up which shows the various style variations. The colours are assigned accordingly already, the jaw line has a blue colour, the teeth line has the red colour and finally the lips line has a green colour in that order. This how the moving averages look like and they can be seen it the chart below.
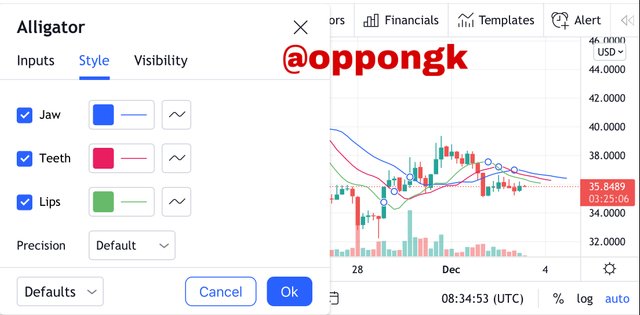
screenshot from Tradingview
Then we move on to click on visibility settings. Those settings will be displayed show their default settings. Then we can click on OK to complete the settings.
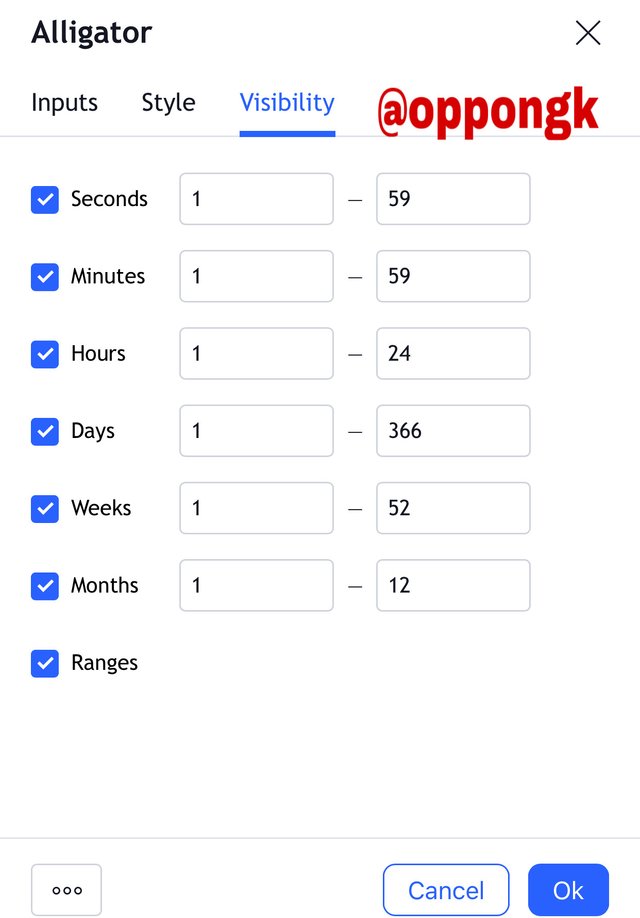
screenshot from Tradingview
When using the alligator indicator, the default settings is already given by Williams and it is best that we continue with the default settings without changing them. There is a reason for Williams using these settings after he had than a lot of research on this indicator so it is advisable that we follow his footprints. The numbers used by Williams which are 3, 5 and 8 forms part of the Fibonacci series. This Fibonacci series are very important in the concept of support and resistance.
Any change made in the period of the indicator will affect the sensitivity of the indicator. The period is inversely proportional to the sensitivity of the indicator hence when the length of the period is raised, the sensitivity of the indicator drops and on the other hand when the length of the indicator is reduced, the sensitivity rises . This will lead to the occurrence of false signals or some signals will not be detected by the indicator depending on how the settings are changed.

3. How do we interpret this indicator from its 3 phases: the period of rest(or sleep), awakening, and the meal phase?(Screenshot required)
As we discussed already, the Alligator indicator behaves like a crocodile. Now is the time for us to highlight it's range state(sleeping phase), identify the trend signal(awakening) and also identify the strong signal(food signal) in the alligator indicator.
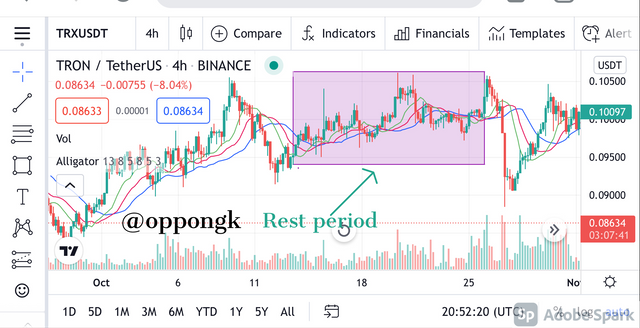
screenshot from Tradingview
From the TRX/USDT chart above, we can see that the market is in a range zone which can be detected when the chart is in a rest stage. At this stage we cannot identify the exact direction of the market and the direction the price of the market will take. For us to be able to use the moving lines of the indicator to identify this, we will observe that the jaw, the teeth and the lips have no one clear direction to repeatedly cross over one another at this particular time.
The rest period is very necessary in the use of the alligator indicator because at this stage it is not advisable to enter the market due to the fact that when the sleeping crocodile wakes up, it can attack the market in any direction that we don't know and hence we might lose our assets when it moves in opposite of the direction we invested in.
When the crocodile sleeps for a very long time, it accumulates a lot of energy and when it wakes up, it is able to move in a certain direction with full power. This means that during these consolidation stages, the price does a lot of accumulation and when it begins to make a move, the bullish or bearish trend that happens becomes very explosive.
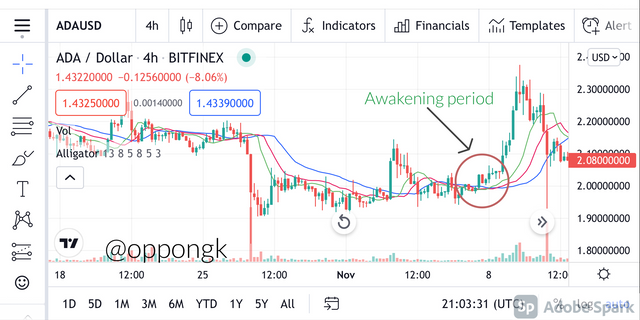
screenshot from Tradingview
Looking at the ADA/USD chart above, it can be seen clearly that the chart is in the awakening period. This is due to the fact that initially the was at rest and then suddenly the crocodile was hungry and it makes a move to go and search for food. For us to be able to recognize this period, we can observe in the chart that the green line which is the lip moves above the other two lines and it rises together with the price of the asset. This gives us a clear signal of the formation of a new trend.
It is very necessary for us to be able to detect the awakening period because it helps us to know when to enter the market as we will determine the exact point a trend is about to be formed. As we can see in the chart above, when the alligator indicator begins to rise with the price of the asset, it means an upward trend has started and the prices are going to move up.
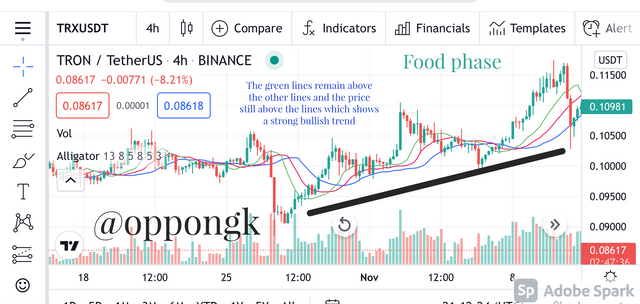
screenshot from Tradingview
Looking at the TRX/USDT chart above, we can see that the Alligator indicator is the food phase because the bullish trend is so strong and the upward movement has been continuous for a long time. For us to be able to know that it is in the food phase, we will see that the green line which is the lip will continue to be above the other two lines with the price still high above all the lines for a very long time.
What we have to take note of the point the three lines intersects because at point where the blue line moves above the green line an the price begins to fall, it is an indication that there is going to be a trend reversal and this means that the crocodile is done eating and is going back to sleep. In the use of an alligator indicator, when the blue line moves above the other two mobile lines and the price below them, we can conclude that there is going to be a downtrend.

4. Based on the layout of its three moving averages that make up the Alligator indicator, how can one predict whether the trend will be bullish or bearish (Screenshot required)
We can look at the movement of the three moving averages after the sleep phase of the alligator indicator and use it to predict the form of a trend to know whether the trend will be a bullish trend or a bearish trend.
Looking at our earlier discussions, the three moving averages are much closer to one another when the alligator indicator is at the sleep phase and then when a trend begins to appear, the moving averages begin to separate from one another and space is created between them. This means that when the moving averages start to move away from one another, that is a signal of a formation of a trend and on the other hand when the moving averages begin to move closer to one another, it means that the trend is becoming weak and most likely to fade out.
After we have been successful in identifying whether a trend is starting or just about to fade out with the alligator indicator, now our next task is to find out the type of trend. To be able to do this, we have to look at the position of the three moving averages. When a bullish trend is about to start, the green line is seen on top whilst the blue line is seen at the bottom, but when a bearish trend is about to start, we see the blue line at the top and the green line at the bottom. This is the secret in determining a bullish and bearish trend when using the alligator indicator.
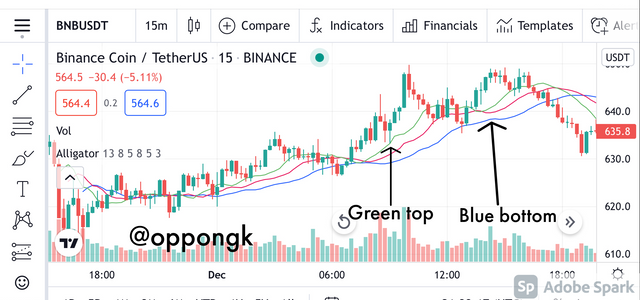
screenshot from Tradingview
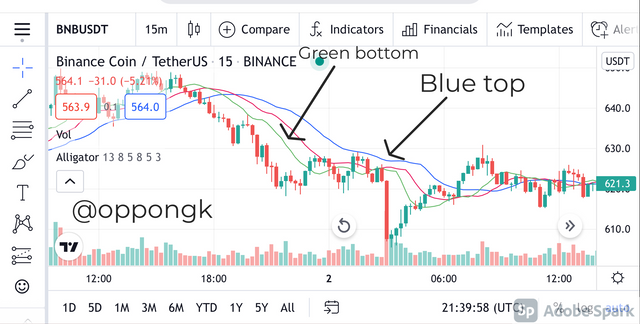
screenshot from Tradingview

5. Explain how the Alligator indicator is also used to understand sell / buy signals, by analyzing its different movements.(screenshot required)
Traders' main motive for using indicators is that they want to know the best time to enter or exit a market. In our discussions above we have been able to understand the fundamental operation of the alligator indicator so at this point we are in a we have enough idea to identify the buy and sell signals of the alligator indicator. The most important thing is that we have to know how to identify the start of a bullish trend or a bullish trend. I will summarize everything below to make it understandable.
We have to look at the position of the three moving averages to able to know whether there is a buy or sell signal.
For us to see a buy signal, we have to identify it at the start of an uptrend. And for us to be able to see a sell signal, those who took a buy position will have to identify it at the end point of an uptrend and for those who try the short market, you have to identify it at the beginning of a downtrend.
Like we said already, the position of the three lines is very necessary in the identification of buy and sell signals. When the lines are arranged in a way that the green line is at the top, the red line in the middle and the blue is bottom, we can say a buy signal is generated.
But on the other hand when the lines are arranged in a way that the blue line is at the top, the red line in the middle and the green line at the bottom, we can conclude that a sell signal has been generated.
After we have been able to confirm the trend, we will then know the precise point of the price we have to enter the market. For us to complete trend confirmation, we can use the price action to be able to determine price confirmation. For example we can look at the point at which there is a break up of a very significant price level by a very strong uptrend or downtrend movement.
When we want to close a buy or sell signal, there are several options we can consider. Some traders can decide to use the stoploss/take profit ratio to close their buy or sell positions. Advanced traders in this case most use trailing stop loss to close their positions because this is likely to give them much profit. When using the alligator indicator, some traders will close their position when the three moving averages start to move close to one another whilst other traders will decide to close their position when the 3 lines touch one another. Every trader decides on which strategy to use because there is no fixed strategy for the closing of positions.
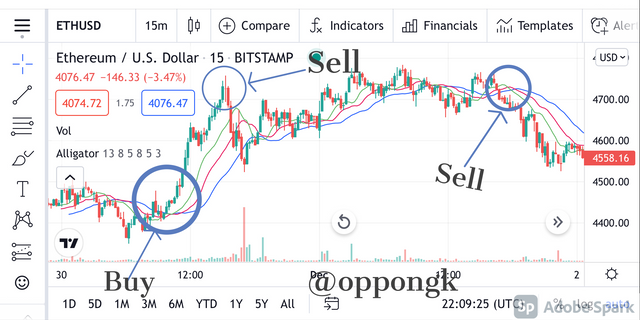
screenshot from Tradingview

6. Do you see the effectiveness of using the Alligator indicator in scalping trading style? Explain this based on a clear example.(Screenshot required)
The use of scalping involves operations that happen in a very short time frame. The time frame of candles can be as low as 1 minute and the highest time frame used in the market is 5 minutes. The traders who use scalping perform so many transactions in a single day by making good use of the slight changes that usually happen in the market within the shortest possible time. The trade they set up will usually end very fast and then they can start another one.
For me personally I think that the alligator indicator can be used as a good trading strategy in a scalping trade. The reason is that the 3 moving averages in an alligator indicator have a very short period and for this reason it can help traders to identify some good signals within a very short time and this can be used to gain profit in the market.
screenshot from Tradingview
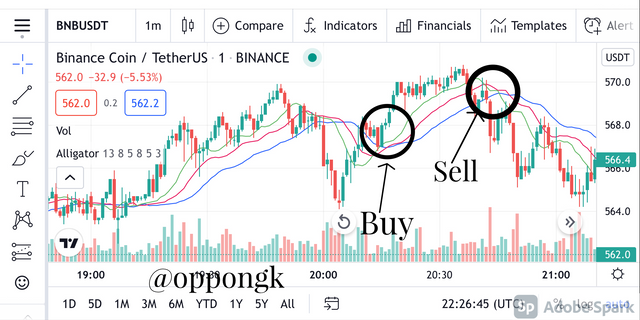
looking at the screenshot above, we observe that the BNB/USDT chart is in the range zone. However, the alligator indicator points out both a buy point signal and a sell point signal.
The trader in this situation must be ready to take advantage of the change in signals, because the trends end very fast and can change direction at any point in time. So in this situation immediately we see a signal for buy we enter the market very fast then hopefully we can make some profit before living the market. And then in the second scenario we take advantage of the sell signal that the alligator indicator displays to us. For this short entry to be possible, the fast trade must be capitalized on.
screenshot from Tradingview
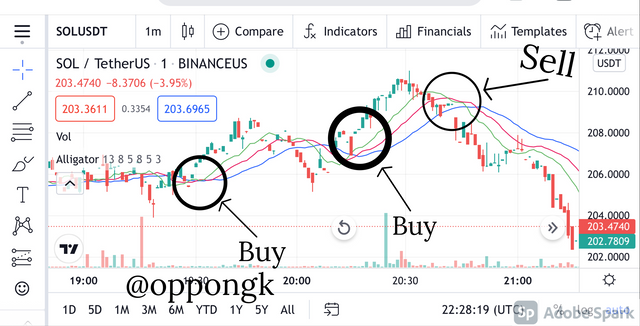
Looking at the chart above, it is a SOL/USDT chart and we can see that it is in the trend phase and that makes it very good for scalping. The crypto market is very volatile so the trader who trades in short periods will definitely want to take advantage of this feature, so that he can attain the target of movements that are formed in the process of bringing up new trends with very strong movements, so that we can use the short period to make some profit.
In this case, both the sell signal and buy signal will be present and be noticed clearly. Normally when using a short timeframe, the trend in a particular direction does not continue for a long time, so we have to get ready for a change in direction of the trend when we see that the uptrend has reached a very high level. Same way we can apply the sell signal in this case so that when the price is about to fall we can exit the market and make profit.
Both the range and trend cases have similar scalping trade signals. When the green line moves above the other 2 lines it is an indication of a buy signal and on the other hand when the blue line moves above the other 2 lines, it is an indication of a sell signal.

7. Is it necessary to add another indicator in order for the indicator to work better as a filter and help get rid of unnecessary and false signals? Use a graph to support your answer.
Combining the Alligator indicator with other Indicators
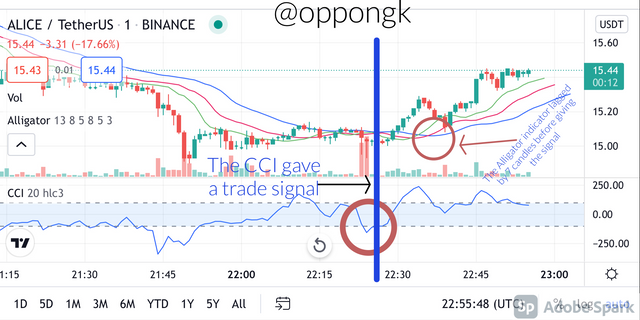
Generally when using all indicators, the generation of false signals is possible so it is best that we combine them with other indicators to reduce the risk of been affected by the generation of false signals and to make a proper confirmation of trend before entering the market. The alligator indicator is not an exception. It is very important to pair the alligator indicator with some indicators such as the momentum indicator CCI. This is due to the fact that the alligator indicator has deficiency which is time lagging because it positions itself for the future.
screenshot from Tradingview
That chart above is an ALICE/USDT chart which is a typical example of this. We can see that the CCI indicator was showing a buy signal when it below the oversold level. The Alligator Indicator was late so it lagged by 7 candles before it gave a buy signal. When this happens it means that you will lose on some profit.
Combining the alligator indicator with other indicators such as the CCI and RSI is very important because these indicators will assist the alligator indicator to identify trade signals at the right time and also help to eliminate false signals that are generated by the alligator indicator. When the trend is in the rest stage, this strategy works perfectly.

8. List the advantages and disadvantages of the Alligator indicator:
The alligator indicator has it's advantages are we saw in some of the discussions above but at the same time it also has it's own disadvantages. We will be highlighting some of these merits and demerits below.
Advantages of the Alligator Indicator
The alligator indicator is simple to use and interpret. Because of this in beginner traders can use the alligator indicator to predict the market
The rate at which the indicator gives false signals is very low because it has 3 moving averages. The ones with one or two moving averages usually give more false signals.
As we discussed already, the alligator indicator can be used for the scalping trade method.
Disadvantages of the Alligator Indicator
The lagging nature of the Alligator indicator means that we can't depend on completely for the price changes that are happening in the market currently.
When we try to change the default settings of the Alligator Indicator, it becomes very sensitive or very dormant depending on the settings we choose and this will make the alligator indicator o generate a lot of false signals.

Conclusion
After going through this lesson, we have learnt that the alligator Indicator has 3 different phases which are the rest period, awakening phase the food phase. The indicator also has three moving averages which are of different colors ( Green, blue and red) and they help in predicting and confirming trends before we enter or exit the market.
Thank you once again professor @kouba01 for this detailed lecture.