Hello Dear Students and Professers, it's another blessed week as we are still alive and kicking. This week is Season 4, week 8 and the Lecture was delivered by Professor @kouba01 on the topic: "Crypto Trading With Rate Of Change(ROC)."
The crypto trading comes with having enough Technical know how about price changes. There are many crypto indicators to measure the daily and timely pricing in order to avoid great lost of crypto assets. Because of daily volatility of most crypto assets, we always experience the down and uptrends, hence the novice in crypto should know and master the pendulum of these prices change. One of the indicators our Professor @kouba01 is offering us this week is Crypto Trading With Rate Of Change(ROC)."
1. In your own words, give an explanation of the ROC indicator with an example of how to calculate its value?And comment on the result obtained.
Rate of change ( ROC ) indicator is the momentum oscillator that illustrates the measure of percentage change in price between the current price and certain number of period of the previous price on the crypto analysis indicator. On the Rate of Change (ROC) Indicator, when the movement of the signal line crosses above the zero(0) line it demonstrates the uptrend of crypto asset and hence the trading point. On the other hand, when the signal line crosses below the the zero (0) line, it indicates the down trends or fall in price of the crypto asset, therefore good time to sell the crypto asset.
One should note that at point of oscillation one should measure the trends of price comparing to the certain number of periods. The momentum above zero (0) line indicates high purchasing power and below zero (0) line shows the selling point. It's always advisable for the traders to follow the line trends as well as the actual market price of crypto assets.
Calculation of the rate of Change(ROC)
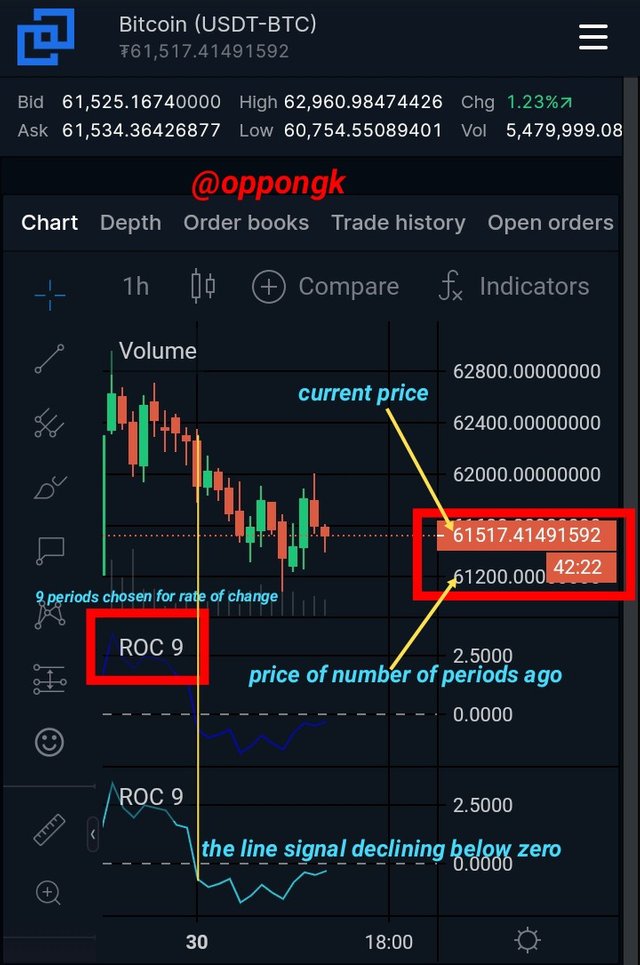
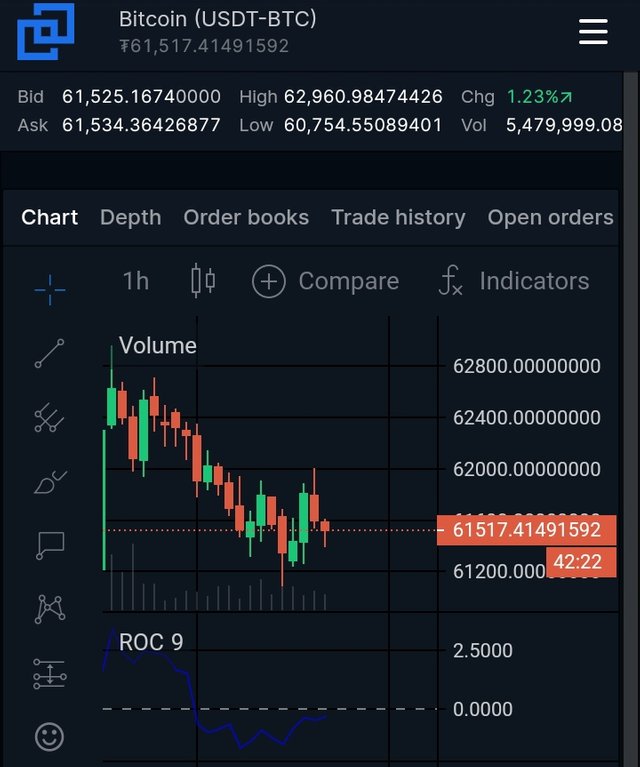
In a simple calculation, one can track back the market behaviour from the chart indicator by comparing the current price change with certain number of periods. In my case, I used Global.Bittrex.com that is more convenient for me. I chose the appropriate strength, that's 9 periods. This approximately gave me the current price volume of $61517.41 and the price of number of periods ago is $61200.00. Below is my illustration of screenshot from Global.Bittrex.com:
Formula and calculate of ROC Value
From the above screenshot, it is very simple, the calculation of the momentum or percentage change of USDT/BTC pair to find out whether there was uptrend or downtrend of the crypto asset. The following is the formula and calculation I performed:
ROC = (CP - P nth Ago) / P nth Ago × 100.
CP= Current Price
P nth = Price of number of Periods Ago.
ROC of Value = ($61517.41 -$61200.00)/ $61200.00 ×100
= $317.14/$61200.00×100
= $0.0051×100
= $0.5182 to 3 decimal place would be: $0.518
So the ROC Value = $0.518
My Comment on the result:
From the result of $0.518, there has been a decline of about 1.23% in Rate of Change Value. This is clear indication from the chart as we see the signal line crossing below the zero line corresponding to the candlestick as a drop down point. This is just Minal from the USDT/BTC pairs.
2. Demonstrate how to add the indicator to the chart on a platform other than the tradingview, highlighting how to modify the settings of the period(best setting).(screenshot required)
There are many available Technical Indicators one can add his indicator, for instance, ROC. since I found Bittrex app very useful, I would like to demonstrate how addition of indicator of ROC is done as done step by step here:
1.Log into https://Global.bittrex.com
2.This opens Bittrex app for you to select the search box at the right top corner having blue interface with some horizontal markings.

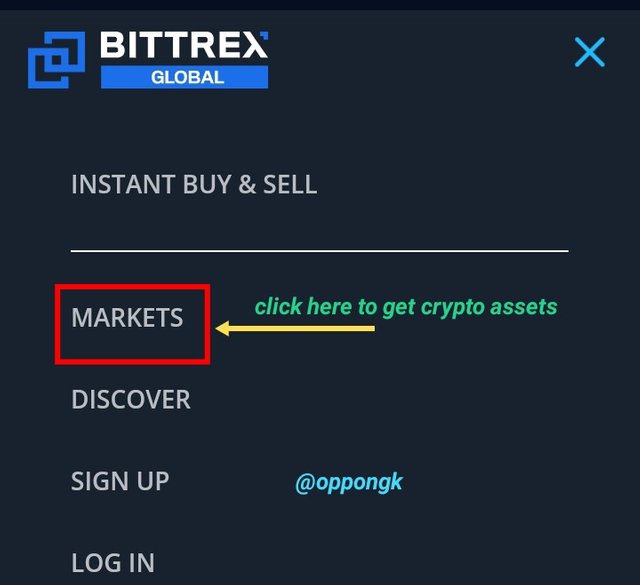
3.Click on the "Market" to get the crypto asset you wish to effect the Rate of Change or ROC as shown below the image from Bittrex:
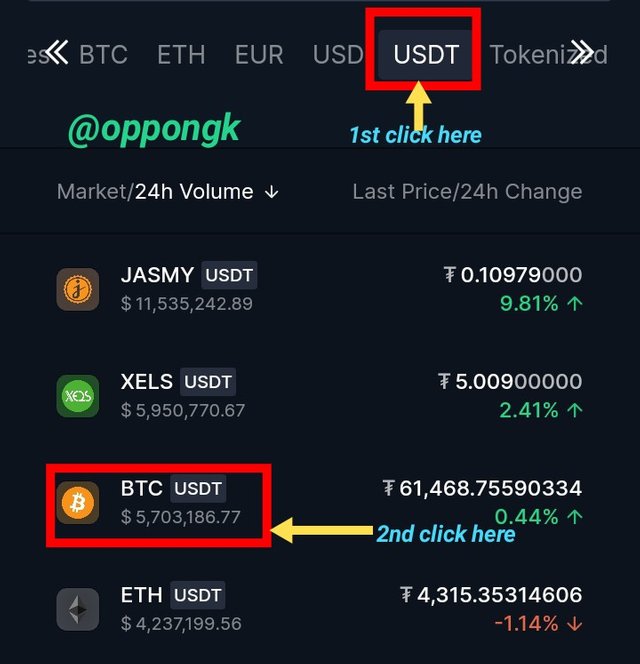
4. The next interface you will see are the list of crypto assets available at market given in a horizontal form. Try to open the full dashboard to see all the assets. Choose your crypto trading pairs. Here, I used USDT/BTC pairs as shown below:
5.You can now see the "chart" highlighted at the left corner of interface and the "indicator" too at the extreme right. Click on it to choose Rate of Change or ROC from the option of indicators.

6 .Scroll down the option of various indicators and select "Rate for change" from the alphabetical order list of indicators as viewed below:
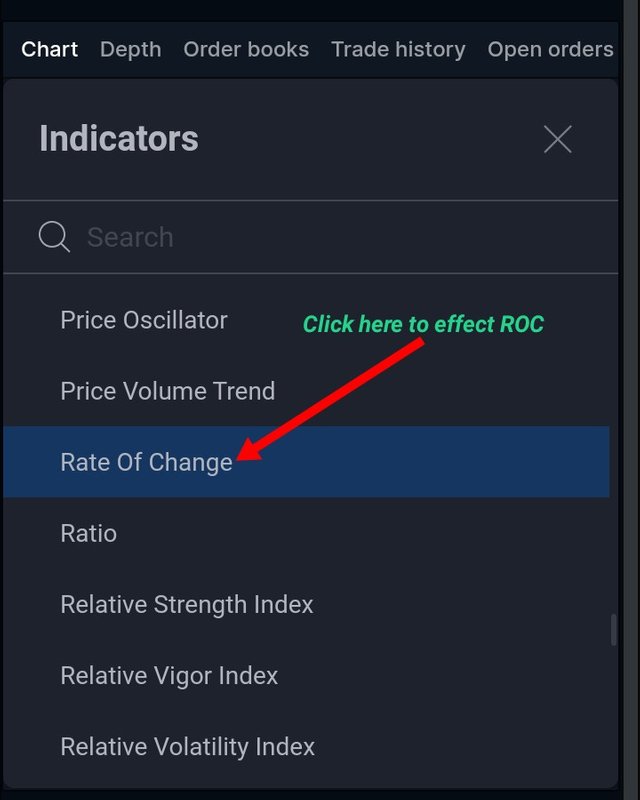
7. At the click, it opens the Rate of Change indicator where you can view the current price and the previous price beneath it. You can input your own number of period if you don't want the default one to calculate your momentum.
3. What is the ROC trend confirmation strategy? And what are the signals that detect a trend reversal? (Screenshot required).
One of the parameters traders should always focus to achieve success using Rate of Change or ROC which is a typical momentum in its measure is "Trend Strategy." The novice may focus as soon as prices trigger to upturn, but the experience traders would critically and technical observe the trends of signal lines. One of the sure way to be success is keenly focussing the intersection of the lines when it form with the zero (0) point.
The Direction of trends strategy determining Upturn and Downturn:
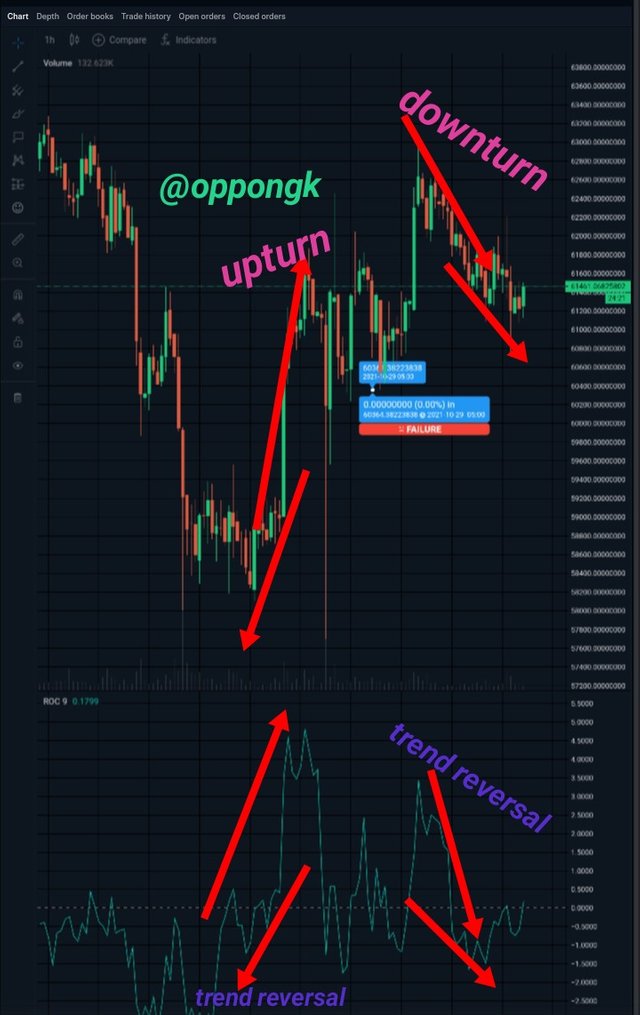
I am using two case studies here. One should be critical and focus about the motion of the line when it intersect with the zero (0) line corresponding with the candlestick above it.
- When the rate of as shown by the signal lines intersect and moves above the zero line, price upturn is effected. This changes must be read in correspond with the candlestick. But this may be unstable as crypto keeps it volatility. A trader can buy upon seeing this signal line drawing above the zero line.
- From the chart, trend reversal is confirmed when the line begins to move upwards above the zero line. This line is directly opposite to its corresponding downturn when the line begins to cross below the zero line showing negativity of price index. This is illustrated from the chart below:
- On the other hand, when the line moves below the zero line, it indicates the price down turn, hence a trader using ROC can decide to sell in order not to incur huge lost of crypto asset. This is obviously seen as it moves in corresponding to the candlestick.
4. What is the indicator’s role in determining buy and sell decision and identifying signals of overbought and oversold؟(screenshot required)
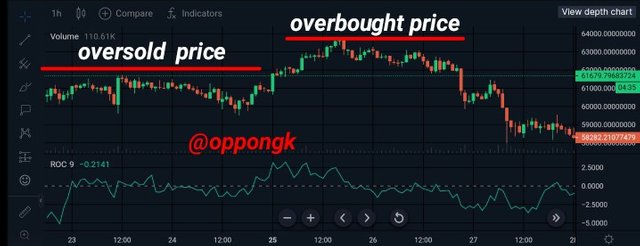
From most technical indicators it is advisable to sell your asset when you see that the price has began to fall upon studying the market trends. And again, the best time to buy when you see that price has started to move upwards. This is similar to using the Rate of Change with respect to the line crossing the zero mark. Going above zero means increasing in prices and below the zero determines the decreasing price. Hence, it's good to buy when the price crosses above the zero line and sell when the price moves below the zero line.
Identifying signals of overbought and oversold
Overbought and oversold are common action applied in most crypto trading using technical indicators. Overbought is period when the price has prolonged at its increase momentum without fall back, while oversold is a period when the price has prolong at it decreasing trends without moving upwards. In the case of rate of change, overbought can be identified below as the price is above the zero line but much is seen to be straight line. The oversold is formed as the it decreases continually in a straight line.
5. How to trade with divergence between the ROC and the price line? Does this trading strategy produce false signals?(screenshot required)
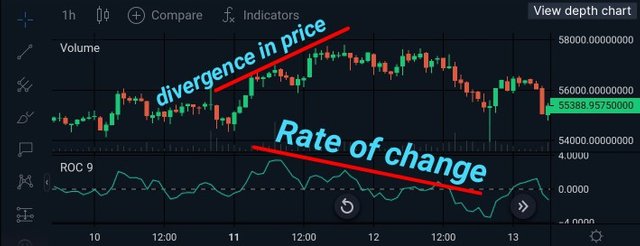
Divergence trading with Rate of Change or ROC occurs when the rate of change or momentum measures or records different trends relative to it corresponding price index. In order words, it can happens that, the signal lines is dropping down below the zero line, while the price would be moving high and vise-versa.
This is never wrong moves from the ROC Value as one can be deceived. It is another signal of price increase or fall a trader must be conscious of. When the rate of change cuts down cross the zero line whiles the price moves upward, it may be a bearish divergence where bullish market maybe experienced. In the screenshot below let's see how divergence occur between ROC and price changes:
6. How to Identify and Confirm Breakouts using ROC indicator?(screenshot required)
This is very simple as price does not move steadily in one pattern but sometimes changes it trends wait for resistant and have support. Breakout in market simply means a situation when Rate of Change signal lines move in one direction and suddenly breaks to take different route. However, it can be positive uptrend or negative uptrend. But when this happens, it helps traders to technically analyse where prices would move when the breakout is confirmed well.
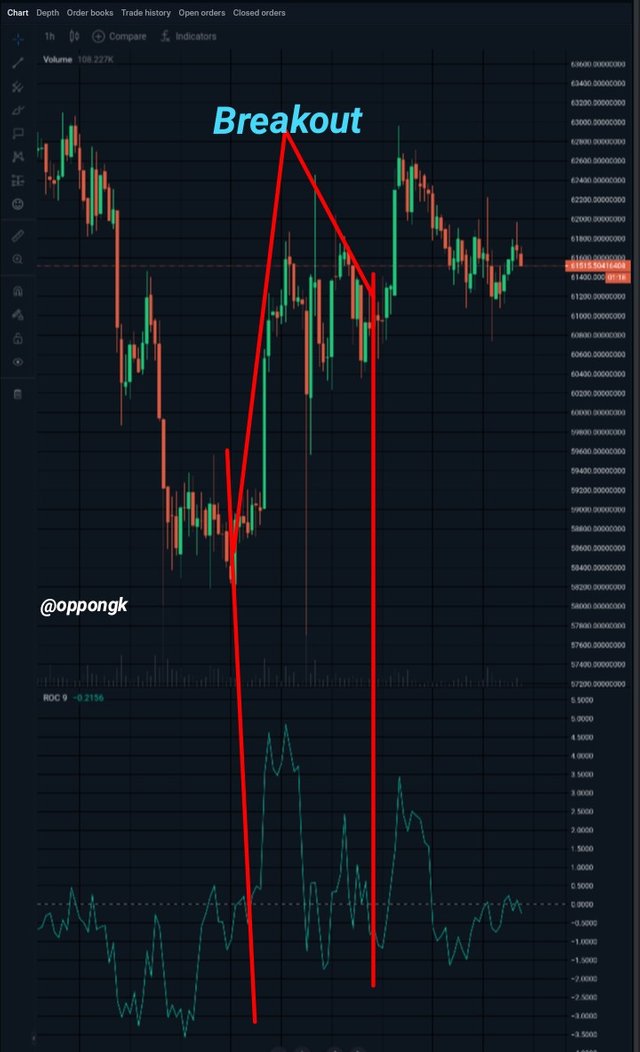
From the above tangents of ROC market, a breakout from the two extremities were drawn when the lines were moving in low and high trends showing downtrends. Lately, the line breakout. This is where the breakout in ROC was confirmed and it is shows in the screenshot above.
7. Review the chart of any crypto pair and present the various signals giving by ROC trading strategy. (Screenshot required)
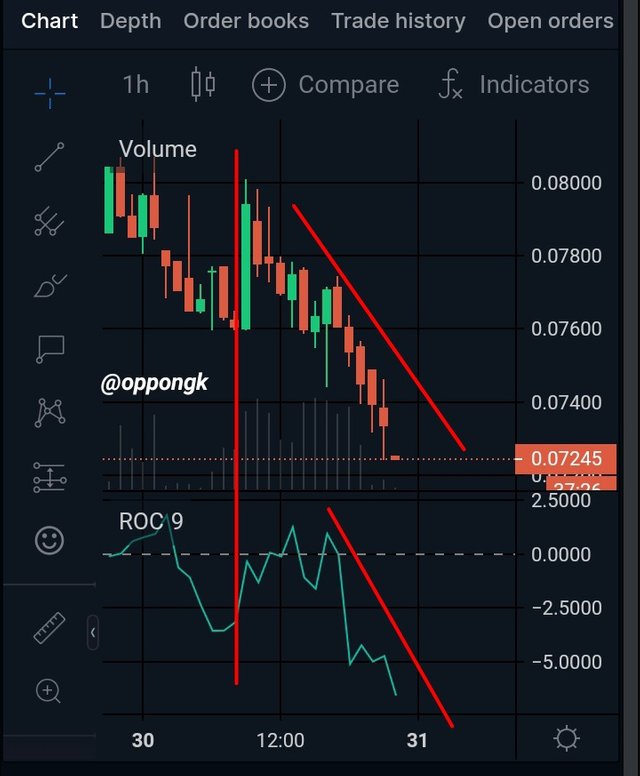
I reviewed the chart of USDT/VRA Crypto pair using Rate of change indicator. The momentum and price trends illustrates a total decrease in price. The chart maybe described been breakout from the middle point where it began to lose it value crossing the below the zero line. There was not divergence action. What this obviously interpret is that, the trader sell the crypto asset as he saw the line dropping below the zero mark and comes back again when he sees the line moves above the zero line mark.
Conclusion:
The Rate of Change or ROC helps traders to technically analyse trading trends using the zero line as benchmark, that guide him to determine the entry and exit point.
Using the percentage momentum is very convenient for one to study the chart.
Again, with the property of divergence trading, a trader with crypto assets would be smart to read and understand any contradiction between the Rate of Change and its corresponding price.
Despite the Rate of Change being good and useful indicator it would be very good to apply other indicators too as well upon studying the market trends to avoid loss of Crypto Assets.
Wow this is touching
Downvoting a post can decrease pending rewards and make it less visible. Common reasons:
Submit
Hello @oppongk,
Thank you for participating in the 8th Week Crypto Course in its 4th season and for your efforts to complete the suggested tasks, you deserve a Total|6/10 rating, according to the following scale:
My review :
Work with acceptable content. It was possible to go deeper into the ideas presented and provide several examples. Here are some notes that I bring to you.
A good explanation of the ROC indicator and especially how to calculate its value with a good existing example.
You have not deepened your analysis to interpret the best parameters of the chosen period option.
A brief explanation for trend determination and its reversal.
A superficial answer to the last question.
Thanks again for your effort, and we look forward to reading your next work.
Sincerely,@kouba01
Downvoting a post can decrease pending rewards and make it less visible. Common reasons:
Submit
Thank so much for your verification and feedbacks. I will try and provide details explanation in my next lessons.
Thank you 🙏
Downvoting a post can decrease pending rewards and make it less visible. Common reasons:
Submit