Hello everyone, this is season 5 week 4 of the steemit crypto academy. This week’s lecture is on Trading Crypto with On-Balance Indicator. The lecture was once again delivered by professor @fredquantum and after I have understood it very well, I decided to try my hands on the given task.
In your own words, explain your understanding of On-Balance Volume (OBV) Indicator.
As we all know, indicators are very necessary tools in technical analysis. They are combined with other technical analysis tools which are used in crypto charts to enable traders to predict the prices of assets. The On-Balance Volume Indicator(OBV) is classified under momentum-based indicators. This OBV indicator is used to determine the flow of both buy and sell pressures in the changing prices of crypto assets. This OBV indicator was invented by Joseph Granvile.
The OBV indicator can be used to determine the direction of the price of an asset. We use the volume to determine this. When the volume is increasing we will conclude that there is a buying pressure and likewise when the volume is decreasing, we can conclude that there is a selling pressure. The identification of this buying and selling pressure is very important because it will help traders to know the direction of the trend and they can take advantage of that.
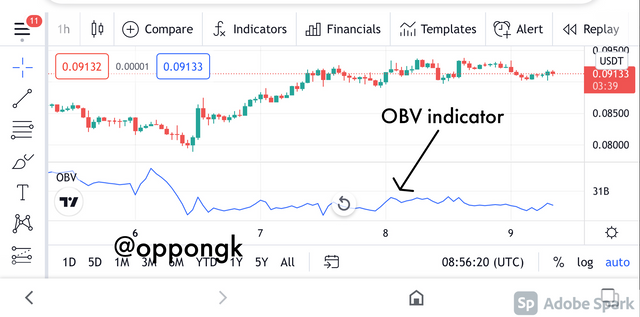
Screenshot from Tradingview
The above screenshot is an illustration of an OBV indicator on a chart. The buying and selling pressure of the asset will be measured by the oscillating line which is seen in the chart above. This is very necessary due to the fact that it will help traders to identify the start of a trend and also measure the buy and sell pressure.
When the price of an asset begins to rise, it means a lot of buyers are injecting their money into the market and this will be shown by the oscillating line when it begins to rise. Similarly, when the price of the asset begins to fall, we can say that many traders are exiting the market and this is shown by the oscillating line of the OBV indicator when it begins to reduce.


Using any charting platform of choice, add On-Balance Volume on the crypto chart. (Screenshots required).
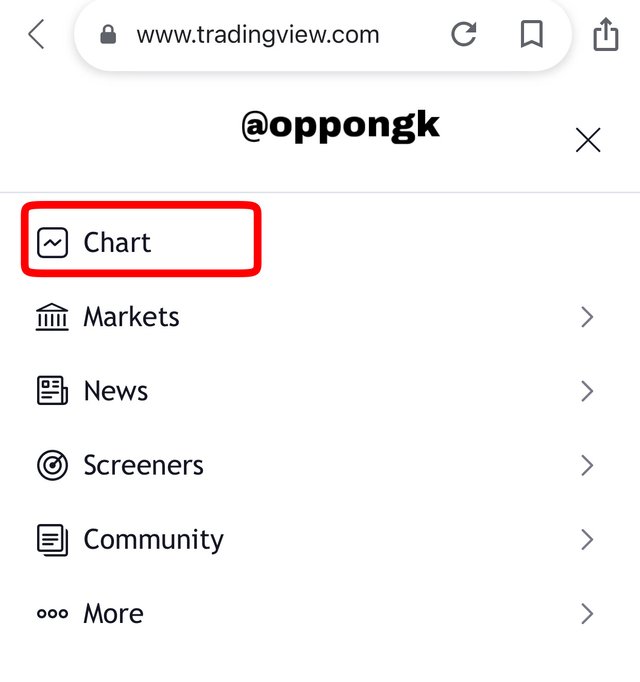
For us to add the OBV indicator, we have to first visit the tradingview site. In this site we can add indicators, thus the OBV indicator in this case to the chart in order to make our technical analysis.
After opening this site, we will select the Chart option for the graph to appear then we can start to add the OBV indicator.
Screenshot from Tradingview
After that we click on the indicator option (Fx) which is found at the top of the chart.
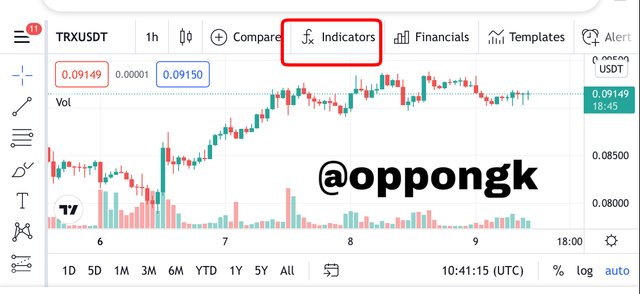
Screenshot from Tradingview
A search box will pop up where we will enter the OBV. After this the OBV indicator option will appear so you can click on it to add the indicator.
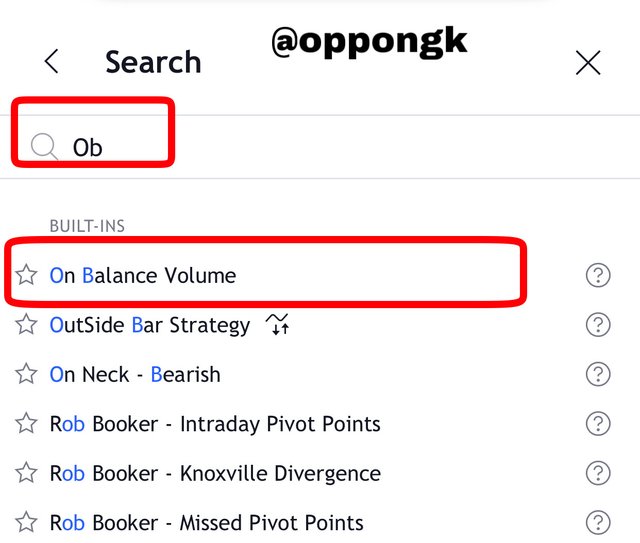
Screenshot from Tradingview
After clicking on it, the On-Balance indicator will be added as shown below. We can now start our analysis with the OBV indicator on the chart.
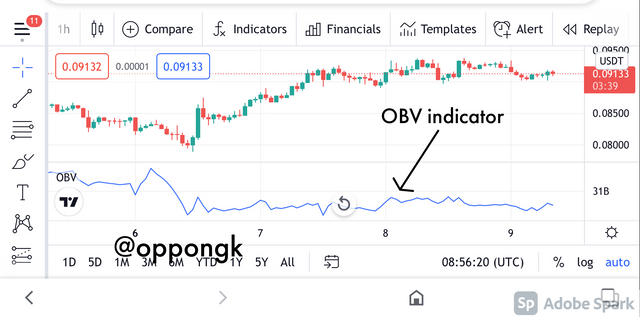
Screenshot from Tradingview


What are the Formulas and Rules for calculating On-Balance Indicator? Give an illustrative example.
Opening prices, closing prices, daily highs, daily lows are some of the mathematical parameters that are used to obtain indicators. The On-balance indicator uses the the closing day price to calculate the total volume of the asset in question. It also use the same format to identify the volume inflow. It combines the previous and present volume to come out with a solution. The steps involved are listed below. The formulas are different depending on the available conditions.
- If the current day close is more than the previous day’s close, the following formula applies;
OBV = Current day volume + Previous Day’s OBV
- If the previous day’s close is more than the current day’s close, the following formula applies;
OBV = Previous Day’s OBV - Current Day volume
- on the other hand, if the previous day’s OBV and the current day’s volume are equal, the below formula applies;
OBV = Previous day’s OBV
Illustrative example of calculating OBV
Let’s calculate using a 5-day closing period.
Day 1: Closing price = $390, Volume = 10,000
Day 2: Closing price = $450, Volume = 15,000
Day 3: Closing price = $400, Volume = 11,000
Day 4: Closing price = $480, volume = 9,000
Day 5: Closing price = $480, Volume = 9,000
We can now use this listed data to calculate the OBV. The procedure is as follows;
- OBV for Day 1 = 0
- OBV for Day 2 = 0 + 15,000 = 15,000
- OBV for Day 3 = 15,000 - 11,000 = 4,000
- OBV for Day 4 = 4,000 + 9,000 = 13,000
- OBV for Day 5 = 13,000
Looking at the calculations above, for those that the closing price is greater than the previous day’s closing price, we add their volumes. This was the case for Day 2 and Day 4. And on the other side when the previous day is greater than the closing price, we subtract and this happened in Day 3. And finally we can see that for Day 5, the previous day’s closing price and the present closing price are the same so the OBV of Day 5 is equal to Day 4.

What is Trend Confirmation using On-Balance Volume Indicator? Show it on the crypto charts in both bullish and bearish directions. (Screenshots required).
Every good trader needs to be able to interpret and understand trends very well in order to make their analysis easier.
The fundamental signals that traders rely on to make a decision in the market are trends. If you are able to identify and analyze trends properly, it will give you a fair as to when to enter the market and also exit the market without falling at a loss. So the confirmation of trends is very relevant in trading and in this part of our discussion we’re going look at how we can use the OBV indicator to confirm trends.
As we have discussed already, the volume of the selling and buying pressures in the market dictates the operation of the OBV indicator line. The OBV indicator always makes continuous higher highs and higher lows when the market is in a very strong bullish trajectory. When the indicator behaves that way, it is an indication that the market is on an upward movement and the market is most likely to continue rising. The graph below is a perfect illustration of the bullish trend of the OBV indicator.
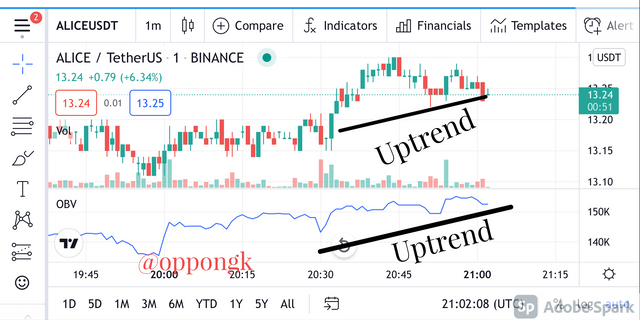
Screenshot from Tradingview
In the bearish trend scenario, the OBV indicator behaves in an exact opposite to the bullish trend. For the confirmation of a bearish trend, lower lows and lower highs are shown by the indicator whilst it is on a decline. When the indicator behaves this way, it is an indication that there is a downtrend and the price of the asset is likely to keep falling. The chart below illustrates the bearish trend of the OBV indicator.
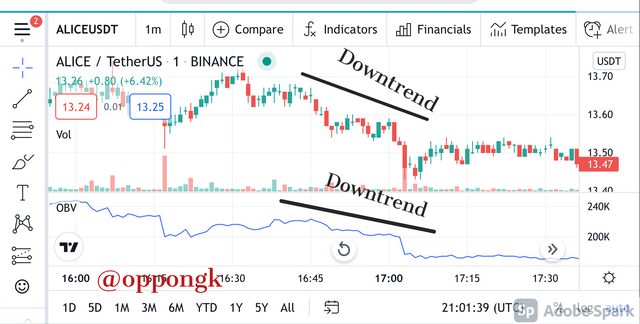
Screenshot from Tradingview

What's your understanding of Breakout Confirmation with On-Balance Volume Indicator? Show it on crypto charts, both bullish and bearish breakouts (Screenshots required).
When the price in a market moves towards a particular direction for a certain period of time, there is always a break at some point. At this point, the trend is gaining some momentum in order to return with a strong force. This stage is referred to as the accumulation phase. After this stage the price will either move in an upward or a downward direction after it hits a support or resistance area.
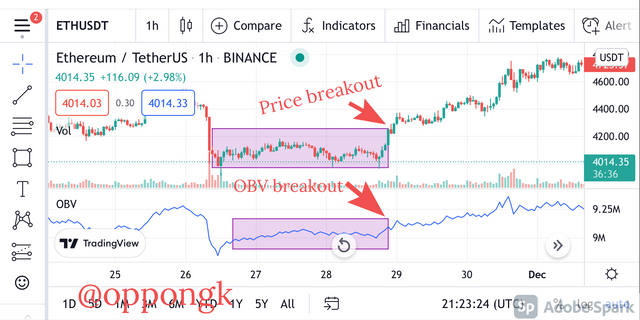
As we discussed earlier, the volume in the market affects the price movement and due to this the price breakouts can be confirmed by the OBV indicator. Looking at the below chart, we can see that the price is accumulating within the areas of the support and resistance and there will be a breakout eventually.
The OBV indicator on the chart also behaves accordingly as we can see that there is a consolidation. This consolidation proves that the price makes a movement due to the amount of volume injected into the market. We can then observe that the price breakout eventually and made an upward movement. We can also see that the OBV indicator reacted accordingly and also followed the direction of the breakout to move upward. This is a proof of the volume injected in the market at a very high buying pressure.
Screenshot from Tradingview
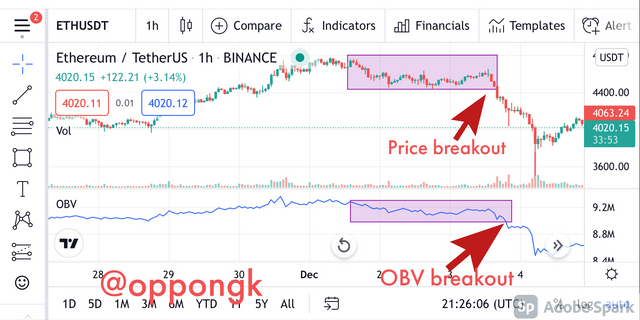
From there we can look at a scenario for a downtrend. We can then observe that the price breakout eventually and made a downward movement. We can also see that the OBV indicator reacted accordingly and also followed the direction of the breakout to move downward. This is proof that the volume injected in the market was very low and many traders were not ready to invest in the asset.
Screenshot from Tradingview

Explain Advanced Breakout with On-Balance Volume Indicator. Show it on crypto charts for both bullish and bearish. (Screenshots required).
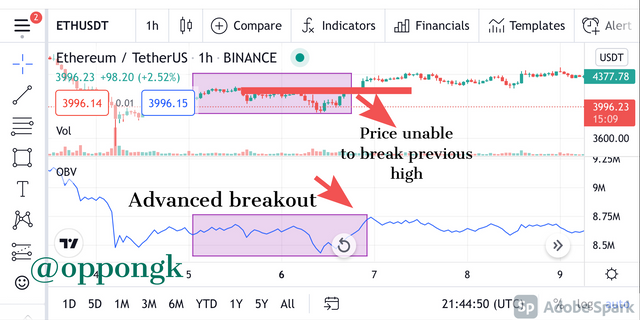
In this section, we are going to talk about how to use the OBV indicator to confirm advanced breakout. There is either upward breakout or downward breakout at the time of the movement of the market trend. Before the price breaks a previous high, the OBV indicator has already broken the previous high giving a signal that a large volume has been injected into the market. As a result of the high volume injected, the previous high will eventually break. I will illustrate this with the chart below.
Screenshot from Tradingview
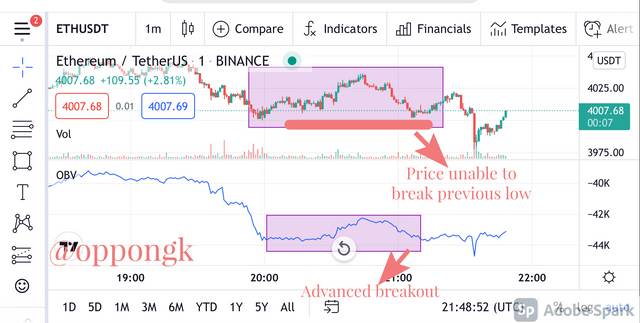
In the case of the bearish advanced breakout, the OBV indicator after the accumulation period will break the previous low whilst the price of the asset is unable to break the previous low. This is an indication that the volume in the market is reducing and the price is attempting to break the previous low due to the fact that the price keeps falling.
This strategy of advanced breakout can be used by traders to predict the direction of a breakout. This can be observed on the OBV indicator before the actual breakout takes place. Another illustration can be seen on the below chart.
Screenshot from Tradingview

Explain Bullish Divergence and Bearish Divergence with On-Balance Volume Indicator. Show both on charts. (Screenshots required).
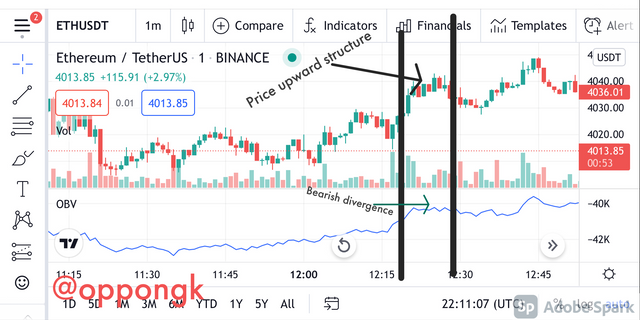
The reversals and the ending of trends can be deduced by the use of the movement of trends and other indicators through divergences. OBV indicator is one of the technical analysis tools that can be used along with the action of the prices to identify divergences. In the divergence scenario the OBV indicator behaves in an opposite direction to the trend movement. The OBV forms a lower low pattern when the price structure is bullish and showing a higher high pattern. The moment the OBV starts showing the lower low pattern, it is an indication that the volume is reducing and this gives a signal that the bullish trend is coming to an end.
When this happens, traders in the market will start to exit the market at the point of the downtrend and then wait for the right time to enter the market again. Below is a chart that illustrates this scenario.
Screenshot from Tradingview
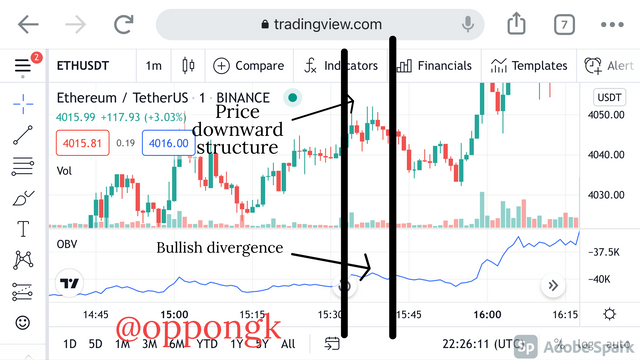
The bullish divergence is the direct opposite of what we discussed above. In the bullish divergence, whilst the price is making a lower low and lower high patterns through the formation of a downward structure, the OBV indicator will be seen forming a higher highs and higher low patterns. This upward signal given by the OBV indicator gives an impression that there is large volume that is injected into the market. The signal shows that the bearish trend is becoming weak and for that matter a bullish trend will start very soon and the price of the asset will be on the rise. Again an illustration of the bullish divergence can be seen on the chart below.
Screenshot from Tradingview

Confirm a clear trend using the OBV indicator and combine another indicator of choice with it. Use the market structure to place at least two trades (one buy and one sell) through a demo account with proper trade management. (Screenshots required).
As we all know the combination of different indicators in technical analysis is more likely to give accurate results than relying on just a single indicator. In this section I have decided to combine the OBV indicator with the stochastic oscillator indicator.
We will use the stochastic indicator to determine our entry point after the OBV indicator has confirmed the trend of the price.
Our target here is to establish how we can identify a good entry point with the OBV indicator when we combine it with the stochastic indicator. The stochastic indicator consists of the overbought region and the oversold region. The overbought region is from level 80-200 whilst the oversold region is from level 0-20.
When the market reaches a point where the sellers are about to dominate the market, it is called the overbought region and this is the best time to sell our assets. Conversely, when the market reaches a point that the buyers are about to dominate the sellers in the market, it is called the oversold region. This is the best time for traders to enter the market.
Buying Trade
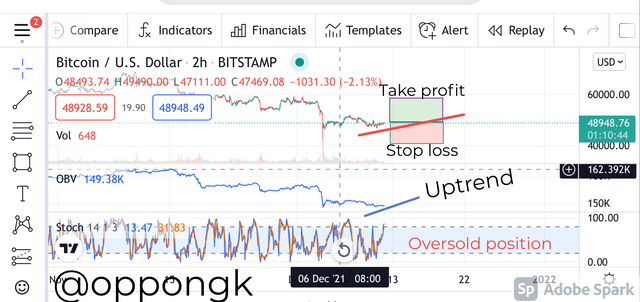
looking at the screenshot below carefully, we can observe that the uptrend signal was shown by the OBV indicator whilst at the same time the stochastic indicator reached the oversold region. This is a signal we can enter the market at this point. So I decided to make an entry and then placed a stop loss and a take profit both at 1:1RR.
Selling Trade
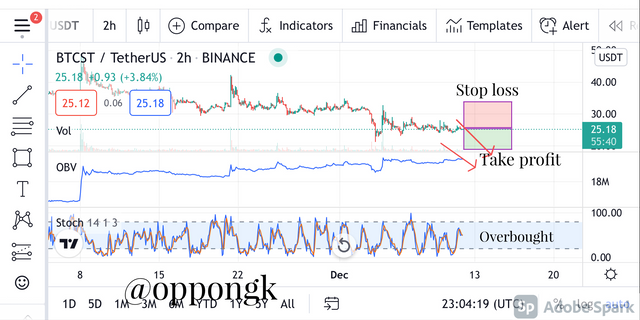
Looking at the chart below, we can see that the stochastic indicator is at the overbought region whilst at the same time the OBV indicator was signaling a bearish trend. This signal means this is the best time to exit the market. So at this point I placed a sell order with both stop loss and take profit set at 1:1RR.

What are the advantages and disadvantages of On-Balance Volume Indicator?
Advantages
The indicator is very straight forward so even beginners in trading can use it without any difficulties.
The OBV indicator has made trend confirmation very easy. This is because we can just look at the movement of the indicator either upward or downward to know whether the price of the asset is on an upward trajectory on a downward fall.
This OBV indicator helps us identify the quantity of volume entering or leaving the market.
Disadvantages
Whales in the market are able to manipulated the volume at any time so the appearance of false signals are likely to deceive traders
For proper results from this indicator, it must be combined with other indicators to get the best results. Using this indicator alone can give fake signals.
Cryptocurrencies are very volatile and for this reason the volume keeps changing quickly sometimes. When the asset behaves this way we can't rely on the OBV indicator for accurate results.
Conclusion
The trend of a market can be confirmed using the OBV indicator. This indicator is very easy to understand so it is simple to use even for beginners. The direction of prices in the market can be determined using the OBV indicator as well. For us to get the best results from this indicator, we have to combine it with other indicators for accurate results.
Thank you once again professor @fredquantum for this detailed lecture.
fredquantum-s5week4 cryptoacademy obv-indicator steemexclusive technical-indicators