Hello all,
We are back with a very educational topic in the 5th week of Steem Crypto Academy Season 5. This week, we learned in detail about the VWAP indicator, which is frequently used in technical analysis, with the explanation of our dear proseffor @lenonmc21. Let's see what we learned together.

1-)Explain and define in your own words what the “VWAP” indicator is and how it is calculated (Nothing taken from the internet)?
There are many indicators that can be used when performing a technical analysis of a commodity. These indicators help us in various ways, such as predicting future price movements, trading, or determining the direction of the trend. Some indicators are in the category of volume indicators and some indicators are in the category of momentum indicators.
Today, I will examine the Volume Weighted Average Price (VWAP) indicator, which is a volume indicator. The name of this indicator actually explains how the indicator works. In other words, the VWAP value is calculated by taking the weighted average over the volume within a certain time interval.
The VWAP indicator is an indicator that gives very successful results because it contains both price action and volume at the same time. This indicator determines the average price at which a commodity is traded during the day. In this way, this indicator informs the investor about both the value and the trend direction of the relevant commodity.
It will be beneficial for the investor to pay attention to this indicator, especially in daily transactions. This indicator is also a lagging indicator. This means that this indicator does not predict price.
When you include the VWAP indicator in your chart through any application, it appears as a line just like the MA. If the price value is above the VWAP line, it indicates that we are in a bullish market, on the contrary, if the price value is below the VWAP, then there is a bearish market.
When calculating the VWAP value, as we mentioned above, price, volume, and the number of daily candles are required.
So if we verbalize this formula; The price value is added to the daily candlestick part of the amount of money traded. In this way, the VWAP value is obtained. This formula is recalculated for each day.

2-)Explain in your own words how the “Strategy with the VWAP indicator should be applied correctly (Show at least 2 examples of possible inputs with the indicator, only own charts)?
If you are familiar with using indicators in your technical analysis, it will be very easy to add the VWAP indicator to your chart. Because adding this indicator is just like adding other indicators to the chart. Let's take a detailed look at how we can add the VWAP indicator to a chart below.
I am using the tradingview application as a technical analysis tool. For this reason, VWAP indicator was added to the chart using tradingview in this question.
First, we go to tradingview and open any chart from there. I preferred the STEEMUSDT chart for this transaction.

After opening the relevant graphic, we click on the fx indicators located on the top panel of the page (1). Here we type VWAP (2) in the search box. If you add this indicator to your favorites here, it will appear in your favorites when you search in the future. We click on the option VWAP (3). Thus, the indicator is added to our graph. In the next step, the settings of the indicator will be made.

In this section, we will make the general settings of the indicator. First, we click on the indicator added to chart(1). Then we click on the settings icon in the upper left part of the graph (2). Here we select the style (3) tab. We deselect the Upper Band and Lower Band boxes that appear on the screen (4). Finally, we complete the process by pressing the Ok button.

After the settings are completed, the graph is seen like this. Now we can start trading using the VWAP indicator.
A-Breakdown of Structure from Bearish to Bullish and Vice Versa:
Here, first of all, we need to determine the point where the LAST trends that occur according to our buying or selling situation are broken. If we are planning to buy, we need to find bearish trends, if we are planning to sell, we need to find bullish trends.
If there is a bearish trend, we need to find the last lower-low break point. On the contrary, in the bullish trend, we need to find the point where the last higher-high formations are broken.
If the price reaches this point again and the VWAP line breaks the price, the current trend is expected to change direction.
You can see an example of this situation in the below graph.
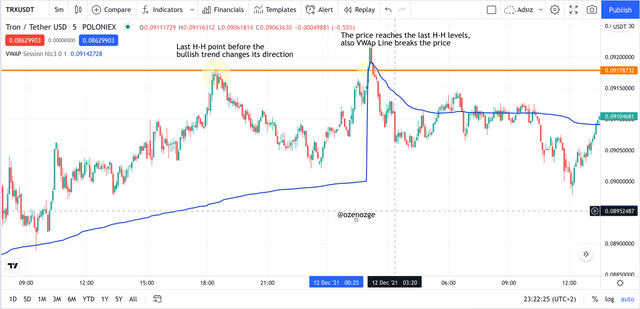
B-Retracement to the VWAP (Use of the Fibonacci):
In the next stage, we will wait for the price to make a retracement. In our example, the price starts an increase after seeing the bottom point. A Fibonacci Retracement will be drawn after the bullish trend formed after this low point is broken. After drawing this Fibonacci Retracement, the 50% and 61% levels are critical and we should pay attention to these points. If the price is in this range and broke the VWAP line, this is our entry zone.

C-Correct Management:
Finally, stop loss and demand profit zones should be determined. While below 61.8% is the stop loss, it is recommended to be approximately 1.5 times the stop loss for take profit.
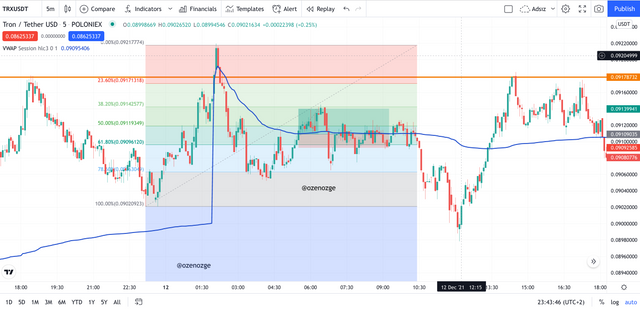
Finally, stop loss and demand profit zones should be determined. While below 61.8% is the stop loss, it is recommended to be approximately 1.5 times the stop loss for take profit.

3-)Explain in detail the trade entry and exit criteria to take into account to correctly apply the strategy with the VWAP indicator?
There are a few conditions that we must follow when we want to strategize using the VWAP indicator. If these conditions are not complied with, it will not be correct to use the VWAP indicator.
The first condition we need to look at is that if we are going to buy, the price must pass the last high-high formation. In sales, it should reach a value lower than the last low-low value. Afterwards, the price should break down from these points in the opposite direction.
The next condition is that the VWAP line coincides with the price after these critical points.
If these two conditions are met, Fibonacci Retracement should be drawn in the next step. Here we need to draw the Fibonacci starting from the last impulse to the last point of the trend. Here, the combination of price and VWAP in the region of 50-61.8% indicates that this point can be our buying or selling point.
In the next step, stop-loss should be determined first. Preferably, a little lower part of 61.8% can be determined as stop loss.
As the last step, take profit should be determined. If we accept the risk and benefit ratio as 1:1.5, the take profit should be determined as 1.5 times the stop loss area. It is recommended that this ratio be maximum 1:2.

4-)Make 2 entries (One bullish and one bearish), using the strategy with the “VWAP” indicator. These entries must be made in a demo account, keep in mind that it is not enough just to place the images of the entry, you must place additional images to observe their development in order to be correctly evaluated.
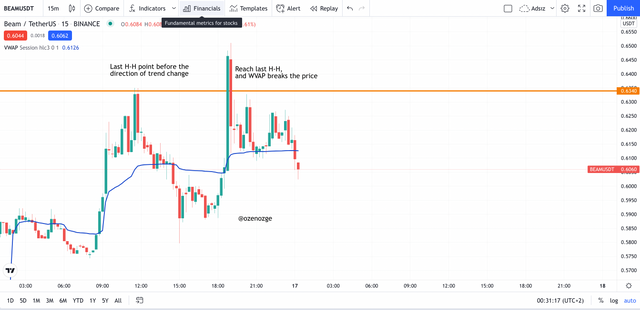
I used the 15-minute chart of BEAMUSDT pair to answer this question.
First, I looked for the Breakdown structure that we learned in question 2 in our graph. This structure is given in the image below.
In the next step, I determined the critical points by drawing the Fibonacci Retracement. As you may recall, while the 50%-61% band is critical for us, we also see that the VWAP indicator has broken the price. So we got confirmation from the indicator as well.
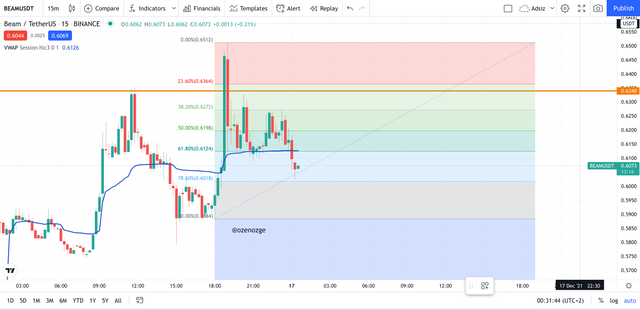
Finally, take profit and stop loss zones were determined. Here, just below the 61% region, the stop loss would be set (0.6063). Take profit is determined as 1.5 times of Stop loss. The goal here was to achieve a 1:1.5 ratio. At this point it was set at 0.6163.

A Buy order was opened using the papertrading tool of Tradingview. Here, while the price was 0.6083, a buy order was given at 0.6088. Naturally, the order took place instantly. Stop is entered as 0.6063 and take profit is entered as 0.6163.

A few minutes after the buying was made, the price started to decrease and the stop loss was activated and the sale was realized at 0.6049.

For the SELL entry, I chose the STEEMUSDT pair.
First, the Breakdown structure was searched. It was detected as follows.
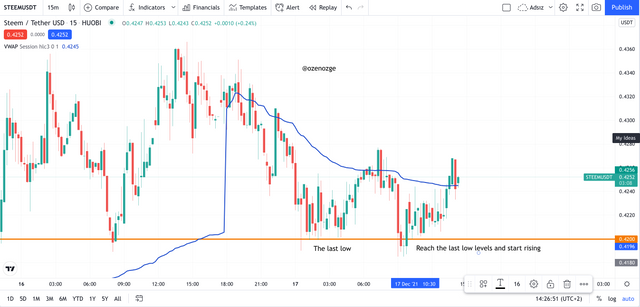
In the next step, the Fibonacci is drawn. It is seen that our price is in the critical region.

The next step is to determine the stop loss and take profit. The stop loss is slightly below 61.8%, and the take profit is about 1.5 times the stop loss.

After identifying these regions, a SELL order was created through Tradingview Paper trading. While the price was 0.4228, a SELL order was created at 0.4230. Take profit is set at 0.4155 and stop loss is set at 0.4255.


Within the scope of this week's lesson, we examined the VWAP indicator, which is used in crypto analysis as in many commodities. This indicator is an indicator where the average price is calculated based on the volume. It is an indicator that is highly trusted by investors as it is calculated using both volume and price value. However, it should not be forgotten that one should not rely on a single indicator when investing. It will be in favor of the investor to receive support from other indicators and trade accordingly.

Best regards, Özge