
This article is my homework elaboration for Beginner Level in Steemit Crypto Academy. Specifically, in the class of professor @reminiscence01 regarding Confluence Trading.

Question 1
Explain Confluence trading. Explain how a trade setup can be enhanced using confluence trading.
CONFLUENCE TRADING EXPLANATION
Basically, a confluence means two different paths that eventually assemble each other. In the world of trading, it refers to a situation where two or more technical tools produce the same trading signal. As we have learned, no trading tool can give us 100% accurate signals. Plus, the cryptocurrency market is very dynamic because it has high volatility. Therefore, relying on only one technical tool to conduct transactions in the market is not enough.
Professional traders suggest combining one to three indicators to confirm market movements. In this way, traders will get a higher indication quality than signals from just one trading indicator. This trading strategy is known as Confluence Trading, where traders combine one to three indicators or trading tools.
Overall, traders are advised to implement the confluence technique since it can provide a more accurate signal.

Question 2
Explain the importance of confluence trading in the crypto market?
THE IMPORTANCE OF CONFLUENCE TRADING
There is a skill for traders to master in analyzing the trend movement. In light of all trading decisions depend on the market condition. Furthermore, it is difficult for traders to get an accurate market signal if they only rely on one technique to read candlestick movements on market charts. The reason is due to the high volatility of the cryptocurrency market. Thus, the confluence trading technique does help traders to analyze the current market movements and predict the future market. Here is the essence of confluence trading:
1. Confirmation Support from other Indicators
By employing 2-3 indicators, traders can get more reliable signals than the signals obtained from solely an indicator. For example, the first indicator gives signal market A. However, the second and third indicators show signal market B. So, the signal obtained from the second and third indicators is more accurate.
2. Avoid false signals
Since traders use more than one indicator, traders may be able to avoid false signals from one of the indicators used. As in the example above, the first indicator indicates signal A, but other indicators give signal B. Thus, utilizing the confluence technique can filter out false signals.
3. Good Analytical Quality
The use of the confluence technique can improve the quality of market analysis. With good quality analysis, psychology traders will increase. It is because traders believe that the market assessment they do is pleasing. As a result, traders can reduce the risk of losses or avoid any mental issues such as depression if the traders experience losses on the day.
4. Good Decision-Making
Traders who can predict the upcoming market movement well, then they can make good decisions too. Hence, they can determine the trade setup according to the trending market.
5. Money Management
Indeed, confluence trading techniques can help traders get more accurate market signals. Therefore, traders can maximize their profit and reduce the risk of loss in trading. In short, the confluence technique allows traders to manage their earnings possibilities

Question 3
Explain 2-level and 3-level confirmation confluence trading using any crypto chart.
Research finds that the confluence technique does not have a specific classification. Traders are free to combine any indicators based on their style. Nevertheless, research suggests operating indicators that are independent. It means the indicators used do not rely on each other to produce market signals. If traders use the dependent trading indicators, the technique is risky to implement. Due to the trading tools may provide the wrong market signal.
To add the weight of the argument, Our Professor also recommends using 2 or 3 indicators (multiple indicators) when using the confluence technique. Consequently, the signals that emerge from these indicators are much more qualified and effective. As the number of indicators used, this technique describes the name of multiple levels indicators to confirm confluence trading.
2 LEVEL CONFIRMATION CONFLUENCE TRADING
Two-level confirmation confluence trading means traders use two trading indicators or trading tools to confirm market signals. I use the RSI and the Donchian Channel as my 2 level confluence strategy to confirm the market.
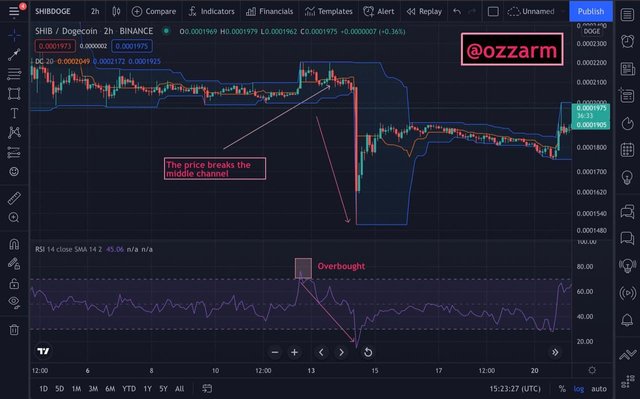
As the screenshot above, I open the SHIB/DOGE cryptocurrency market. The graph at the RSI indicators shows an overbought point after the sideways market. It is a sign that the trend tends to indicate a bearish trend. Then, for the second indicator to confirm the signal, I use the Donchian Channel. From the Donchian Channel, we can notice three crucial points such as the highest channel, the middle channel, and the lowest channel. The function of the channels is to predict the market tendency. If the price breaks the middle channel, a new market would probably picture on the graph. As in the image, there is a breakout in the middle channel. Thus, the price is predicted to move to a bearish trend.
3 LEVELS CONFIRMATION CONFLUENCE TRADING
It is where the traders take advantage of 3 indicators and trading tools to analyze the market directions. I will use the same indicators as my 2 level confluence strategy, and then I will add the support and resistance trendlines to confirm the market signal.
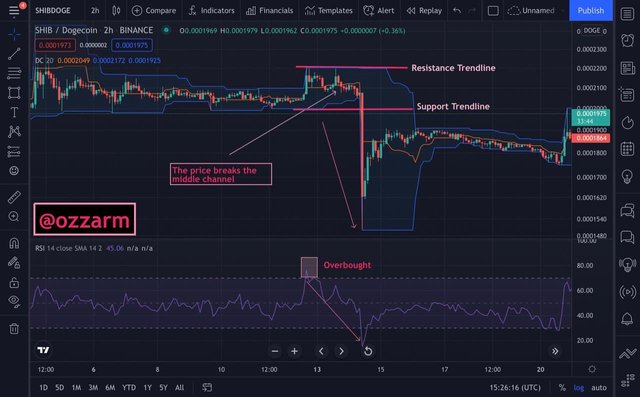
Same as the 2-level confirmation confluence trading strategy, the RSI and the Donchian Channel already confirmed the same signal. Not to forget to mention that I open the same market crypto pair that is SHIB/DOGE market. Following that, by using the trendlines tool to affirm the indication once again, I draw the resistance and support trends. In addition, the price action also breaks the support trendlines. In other words, it is positive that the market moved to a downtrend. Consequently, all three trading tools show the downtrend market. All in all, the 3-level confirmation confluence strategy gives the more accurate new market direction.

Question 4
Analyze and Open a demo trade on two crypto asset pairs using confluence trading. The following are expected in this question.
• a) Identify the trend.
• b) Explain the strategies/trading tools for your confluence.
• c) What are the different signals observed on the chart?
A. TREND IDENTIFICATION
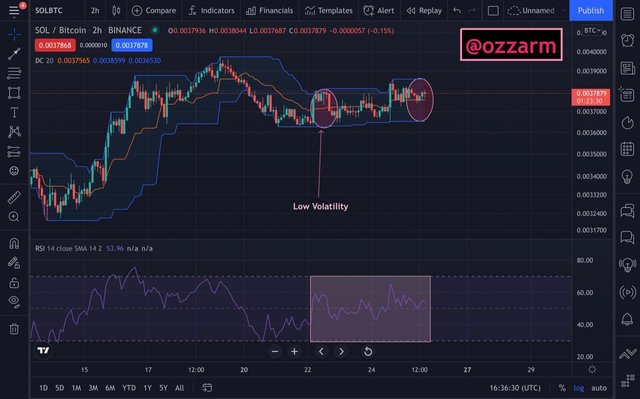
In this practice, I opened the cryptocurrency market of SOL/BTC. We can identify the current trend. SOL/BTC price is currently sideways. Moreover, we still can indicate the price trend even without the indicators by looking at the price trend movement. The market chart displays trendless since the candlestick moves horizontally. The sideways trend defines that the market condition is neutral. It is where the buyers and sellers have equal strength on the market.
Apart from the price chart, we can also identify trends using the RSI and the Donchian Channel. The line graph of RSI shows that the price does not display an overbought or oversold region. So, the trend is sideways. The Donchian Channel also implies the same trend because low volatility indicates that price action is not in a strong trend.
B. CONFLUENCE STRATEGY
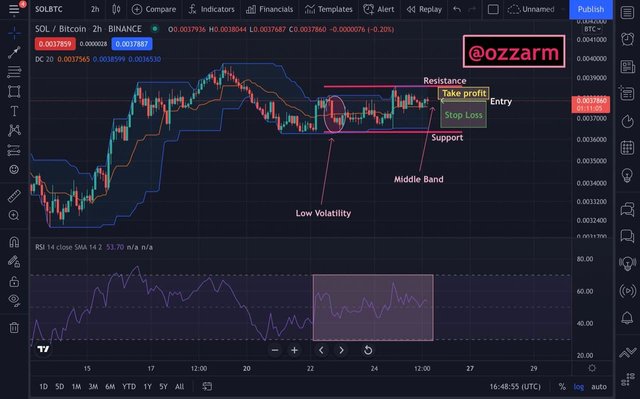
In fact, trading in a sideways trend is a bit risky. However, I will show my trading strategy in short-term trading. I use a 3-level confirmation confluence trading strategy with the RSI, the Donchian Channel indicators, and resistance and support trendlines to confirm the market signal.
From the three trading indicators and tools, we can pinpoint that the market is in the consolidation stage. In this trend, we can determine the entry point as long as the candlestick has not touched the middle band on the Donchian Channel. With the help of Resistance and Support trendlines, we can determine the time to take profit and stop-loss.
It is time to profit as long as the candlestick is between the entry point and resistance level whereas the time for stop-loss is when the candlestick is below the entry point and before crossing the support trendline. Since the candlestick is above the middle band, traders can be in a buy position.
C. THE SIGNALS PRODUCED
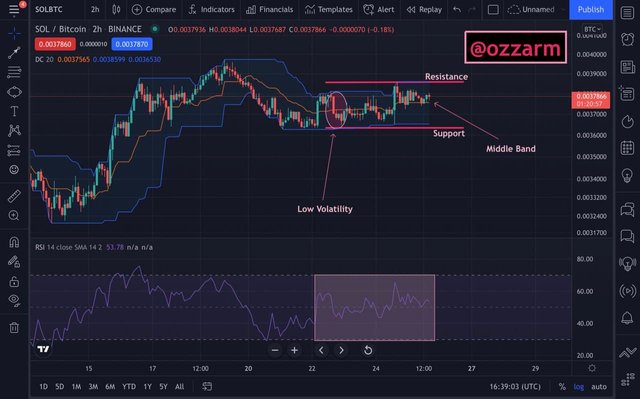
Although we use three trading indicators and tools to predict the new market in the SOL/BTC cryptocurrency, it is hard for us to predict the next trend in the market. It is due to the price action has not shown any signs of a reversal or continuation.
We can catch from the RSI indicator that the line graph does not show signs of overbought or oversold areas. It means that the market will still be in the consolidation stage.
The Donchian Channel indicator also shows the same thing. The distance between the highest and the lowest channel is still close. It indicates that the market is sideways because it has low volatility. The price action has not yet broken the middle band. Plus, the price still has not formed the highest or the lowest point. Therefore, it is still difficult for us to determine a trend reversal or continuation as long as the price is still moving in the same trend.
Resistance and Support trendlines also confirm sideways signals because price action only moves in a zigzag between the two trendlines. Unless the price action breaks one of the trendlines, new traders can determine the reversal or continuation of the trend. If the price moves up and crosses the resistance level, a bullish trend may be created on the market. Vice versa, if the price is in the downward direction and the breakout occurs at the support trendline, then the bearish trend may be displayed.

CONCLUSION
Indeed, applying the confluence strategy in trading is highly recommended. It is because traders can predict market movements more accurately. With more than two indicators giving the same signal, traders can determine more reliable decisions. Hence, traders can optimize their profits and reduce the risk of losses. Vital, traders are also free to combine trading indicators and tools as they like. Yet, it is crucial to note that the trading indicators and tools used should not be dependent.

Thank you to all professors who enlighten all the students in Steemit Crypto Academy through their guidance and knowledge. Your support always helps us present and future.
Signed.
@ozzarm
Hello @ozzarm, I’m glad you participated in the 6th week Season 5 of the Beginner’s class at the Steemit Crypto Academy. Your grades in this task are as follows:
Observations:
Yes, this is correct.
Recommendation / Feedback:
Thank you for submitting your homework task.
Downvoting a post can decrease pending rewards and make it less visible. Common reasons:
Submit