
Introduction
Various tools prove useful to traders when doing predictive analysis on the market. These tools are broadly grouped into two segments, namely: fundamental tools and technical tools.
While the Fundamental tools utilize data from sources like news, social media activities, events, whale movements, etc., to make predictions on the future possibilities of an asset's price; Technical tools make use of historical price data and buyers/sellers behaviour to make market predictions.
Donchian Channels is an example of a Technical tool for market analysis and we will be delving into understanding its dynamics in the paragraphs that follow.
Q1: Explain and define in your own words what the Donchian Channels are?
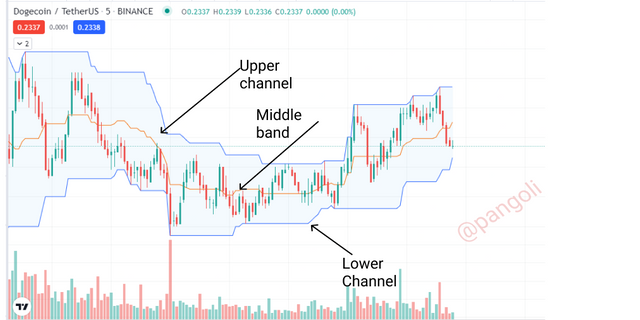
The Donchian Channels indicator can be described as one that creates a connection between the price and trading range of an asset over some time. It is quite similar to the famous Bollinger Bands indicator and also comprises three lines that are situated at the upper, middle and lower parts of the channel.
Screenshot
The channel here is defined as the area between the upper and lower boundaries. By default, the Donchian channel is set to 20 periods; and the upper and lower limits represent the highest and lowest price points over the set period, respectively.
Normally, the Donchian Channels indicator functions in many capacities. It helps traders identify the direction of market trends, high and low points, overbought and oversold regions, trend reversals, as well as market volatility.
It uses historical price data set by default (can be adjusted to suit trader's preference) to a length of twenty periods. This means that the indicator derives its structure from computations drawn from 20 previous candlesticks formed on the price chart.
Q2: Explain in detail how Donchian Channels are calculated (without copying and pasting from the internet)
The Donchian channels indicator is relatively easy to compute and set up. Its overall computation makes use of the following parameters:
- Highest price point in the last "N" periods (usually 20)
- Lowest price point in the last "N" periods.
- Period = minutes, hours, days, weeks, etc.
- Number of periods ("N") = 5, 10, 15, etc.
Once the above parameters are defined, we proceed to obtain the values of the Upper, Lower, and Middle lines of the Donchian Channel using the following procedure:
Lower Channel (LC)
- Define period component - Minutes, hours, days, weeks, months, etc. This will directly imply the chart you're analyzing. You can set it to the Minutes, hourly, daily, weekly, or monthly timeframe.
- Define the number of periods ("N"). By default, this is set equal to 20. Assuming I am on the daily timeframe, this would imply that my Donchian channels are derived from 20-day price data.
- Trace the low price point for each period over the specified range and choose the lowest point.
- Plot the result.
Upper Channel (HC)
- Define period component - Minutes, hours, days, weeks, months, etc. This will directly imply the chart you're analyzing. You can set it to the Minutes, hourly, daily, weekly, or monthly timeframe.
- Define the number of periods ("N"). By default, this is set equal to 20. Assuming I am on the daily timeframe, this would imply that my Donchian channels are derived from 20-day price data.
- Trace the high price point for each period over the specified range and choose the highest point.
- Plot the result.
Center Channel (CC)
- Define period component - Minutes, hours, days, weeks, months, etc. This will directly imply the chart you're analyzing. You can set it to the Minutes, hourly, daily, weekly, or monthly timeframe.
- Define the number of periods ("N"). By default, this is set equal to 20. Assuming I am on the daily timeframe, this would imply that my Donchian channels are derived from 20-day price data.
- Trace the high and low points for each period over the specified range.
- Select the highest high and the lowest low
- Subtract the lowest low value from the highest high value and divide the result by 2.
- Plot the result
Q3: Explain the different types of uses and interpretations of Donchian Channels (With examples of bullish and bearish trades)?
Donchian Channels function in a variety of use-cases. These include:
- Volatility indicator
- Overbought/Oversold indicator
- Trend indicator
- Breakout/Reversal indicator
Volatility indicator*
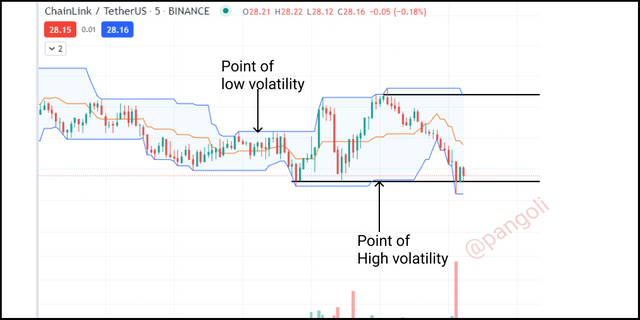
Donchian channels can be very useful in spotting the volatility situation of the market. Every trader would agree with the fact that volatility is what makes the market desirable. Without it, the market would be continuously quiet without any form of activity.
Volatility keeps the market active; and provides a means for traders to speculate for gains. Donchian channels provide a method for traders to identify the volatility situations of the market and apply the same to their trading decisions.
Screenshot
Usually, during periods of low volatility, the channels squeeze into a narrow tunnel as depicted in the image above. And, during periods of high volatility, the channels expand and go far apart from each other.
Overbought and Oversold regions
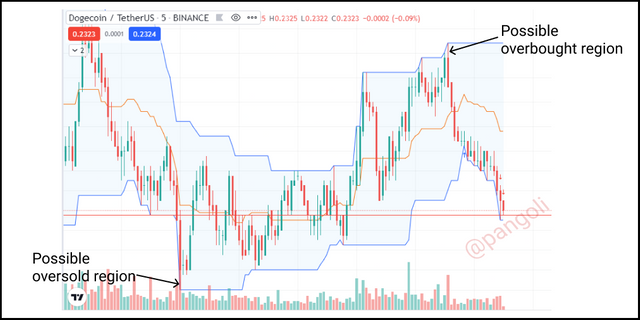
Overbought and oversold regions are critical points in the market that give insights into the direction of the next moves. In these regions, the current market trend is said to be over-stretched and due for a reversal.
Hence, using Donchian channels, a trader can easily identify when the market has reached such limits and take the necessary precautions.
Screenshot
Typically, when the market is in a potential overbought or oversold region, the price action candlesticks tend to align closely with either of the two extremes - highest high or lowest low- within the period in view. In other words, the candlesticks get to touch either the upper or lower channel in repeated succession.
Trend indicator
Screenshot
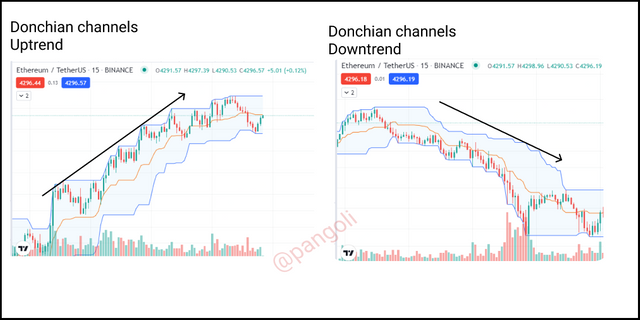
Donchian channels are also very useful in spotting the direction of the market trends. The upper channel switches between successive higher highs in an uptrend, while the lower channel establishes successive lower lows in the case of a downtrend.
Breakout indicator
At any point in the market where there is a change in the dynamics of the Donchian channels indicator, there is vital information that can be drawn therefrom.
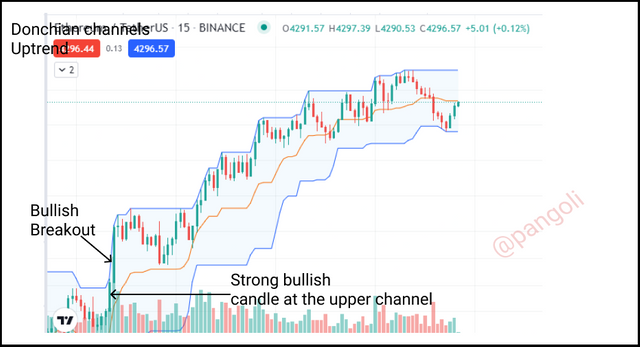
Oftentimes, the possibility of a breakout becomes noticeable using the Donchian Channels before they occur.
Screenshot
For instance, if the market is currently in an uptrend and the candlesticks have touched the upper channel derived for the period while maintaining high volatility alongside the bullish momentum. It is common to expect an upward price breakout to establish a new high point.
Conversely, if the market is currently in a downtrend and the candlesticks have touched the lower channel derived for the period while maintaining high volatility alongside the bearish momentum. It is expected that a downward price breakout would occur.
Reversal indicator
Donchian channels are also very effective is in identifying turning points in the market. These are points where the market trend gets to reverse in the opposite direction.
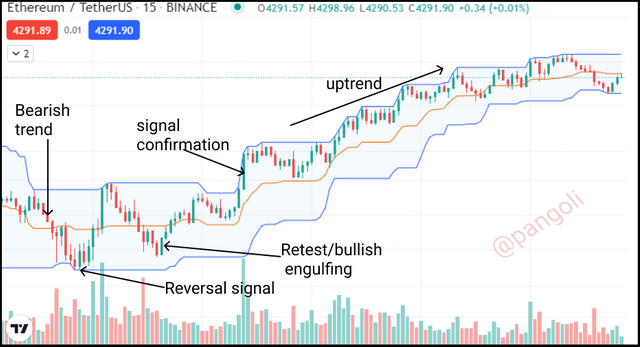
Usually, when price action moves closer to either of the upper or lower channels, and volumes begin to decrease - often indicated by Doji's and shorter candlesticks. The immediate interpretation is that the current market trend is exhausted, and the trend is due for a reversal.
Screenshot
From the image above, we can see price action approaching the lower channel and showing signs of trend exhaustion by printing doji's and shorter candlesticks. As expected, the price bounces off the channel and reverts in the opposite direction - an uptrend.
In another instance, if price action approaches the lower channel and shows signs of trend exhaustion. Similarly, the price bounces off the lower channel and reverts into an uptrend.
Practical Illustration
Donchian Channel Breakout Strategy
Screenshot
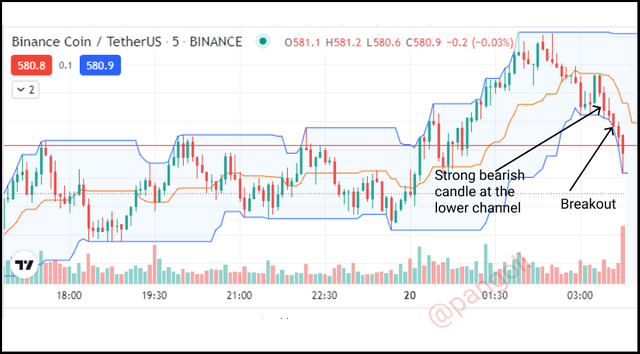
From the chart above, the price trend has touched the lower channel of the Donchian channels indicator. At this point, the price is supposed to have bounced off the lower channel to continue in the opposite direction.
However, the case here is different. The bearish candlesticks continue with even more serious momentum on approaching the lower channel of the Donchian Channels. This signifies a possible downward break-out.
As expected, the price breaks out to the downside and is easily observed from the expansion of the lower Donchian channel. Hence, I will proceed to take a short trade, having gotten that much information.
Screenshot
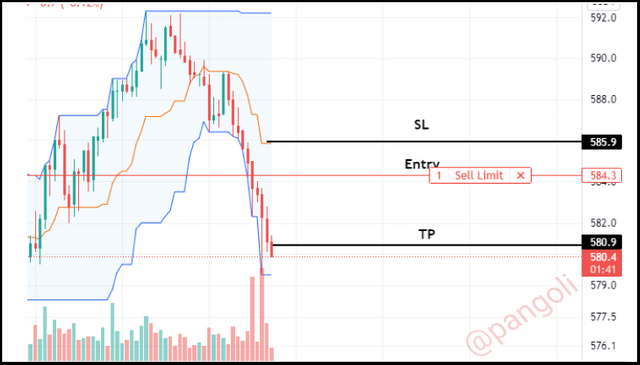
I proceeded to define my entry points, as well as set my Take-profit and stop-loss orders using the paper trading feature on the tradingview platform. At the time of writing, all my targets have been hit, and the trade still had a few more legs down to go.
Reversal and Retracement Strategy
Screenshot
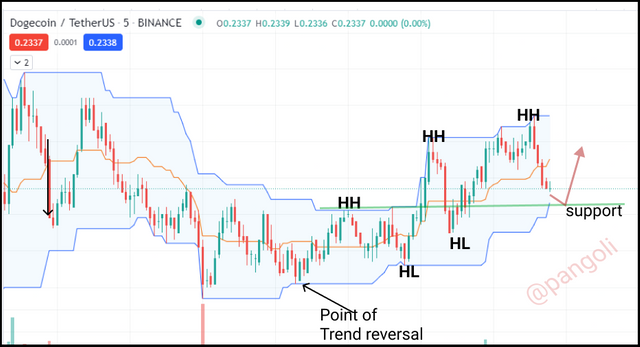
From the image above, the price reversed from a sustained downtrend and has printed three (3) consecutive higher highs. A rebound occurs after the third consecutive higher high, and like the previous two, it is expected to bottom out and make a Higher Low (HL) at the green support line.
Screenshot
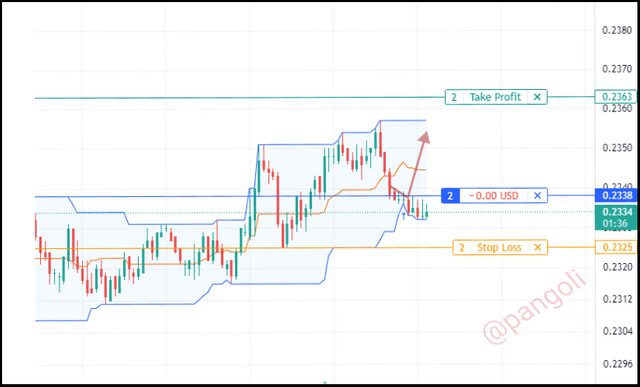
After gathering the necessary insight above, I applied it to the trading view paper trade to see how it plays out. I defined my entry point as well as my exit order and stop-loss order. As is already obvious on the chart, the trade did not play out as I had expected.
At the time of writing, my trade had already broken the support zone and was consolidating.
Conclusion
Technical indicators are always a great way to obtain market insights from historical price data. With a technical indicator like the Donchian Channels, not only is it possible for traders to uncover trend patterns, they can also determine the volatility situation, overbought and oversold regions of the market, as well as possible breakout or reversal points.
Hence, having a good knowledge of the dynamics around the Donchian channels indicator; as well as knowing the right set of indicators to pair up with it for further clarity, can help a trader stay profitable in trade.
Thank you for reading...
CC:-
@lemonc21
#club5050
Downvoting a post can decrease pending rewards and make it less visible. Common reasons:
Submit