 Made with LogoMaker
Hello family, I trust all is well with you. I am very pleased to partake in the season-6 of the steemit cryptoacademy. Below is my presentation.
1.- In your own words, what is fundamental analysis? Do you think it is important for a trader? Justify the answer.
The main objective of fundamental analysis is to evaluate a security’s intrinsic value and tally it with the current stock price of the security, thus to determine if the security is undervalued or overvalued in the stock market.
Yes, I think fundamental analysis is of essence to a stock market trader and this is because, the trader gets the opportunity to find stocks that are currently trading at prices that are higher or lower than their real value, of which the trader can utilize to make some level of profits.
But, I think fundamental analysis is of less essence to crypto traders due to the aforementioned factors that are being considered in the analysis process, and of course fundamental analysis demands a lot of time and efforts, which wouldn't be suitable and necessary for a crypto trader.
I think it would be of less relevance for a cryto trader to be considering a network's hash rate, block addresses etc. before making a trading decision.

2.- Explain what you understand by technical analysis and show the differences with fundamental analysis.
To my understanding, technical analysis is the process of studying the historical price data or trends of an asset to forecast the future price of the asset. In predicting the future price of an asset, traders apply the various technical analysis tools such as indicators, on a price chart to solidify their predictions.
Technical analysis is easily carried out on a chart within a short period of time.
Differences between technical analysis and fundamental analysis.
Technical analysis entails the usage of historical price data (trends and volume) to forecast future prices, whereas fundamental analysis comprises the utilization of public economic data to evaluate the value of a security.
Charts are the initial steps for technical analysis, whiles fundamental analysis begins with the consideration of various macro and micreconomic factors.
Technical analysis demands shorter periods, whereas fundamental analysis demands a longer period of time to successfully complete. Meaning technical analysis is a short-term approach, whiles fundamental analysis is a long term approach.
Technical analysis has a short-term profit making goal, whiles fundamental analysis possesses a long-term profit goal.

3.- In a demo account, execute a sell order in the cryptocurrency market, placing the support and resistance lines in time frames of 1 hour and 30 minutes. Screenshots are required.
Support level is a situation or area of the market whereby the buying forces by the buyers become very effective to stop the price of an asset from falling any further.
As mentioned earlier, the Support level emerges at downtrends (downswings), in some cases after the market has experienced an upward breakage of a ranging.
We have to construct our Support line before we can conclude with the Identification of the Support level, and by doing so, we have to find the recent or previous lows and connect them with a horizontal line.
Our constructed Support level line will be of more essence if it is attached by 3 or more low swing points.
Conversely, Resistance level is a situation or area of the market whereby the selling capacity of the sellers become very effective to limit the price of an asset from rising any further.
The Resistance level emerges in uptrends by upswings, in some cases after the market has experienced a downward breakage of a ranging.
We need to construct our Resistance line before we can confirm the Identification of the Resistance level, and by doing so, we have to find the recent or previous highs and connect them with a horizontal line.
Our constructed Resistance level line will be of more essence if it is attached by 3 or more high swing price points.
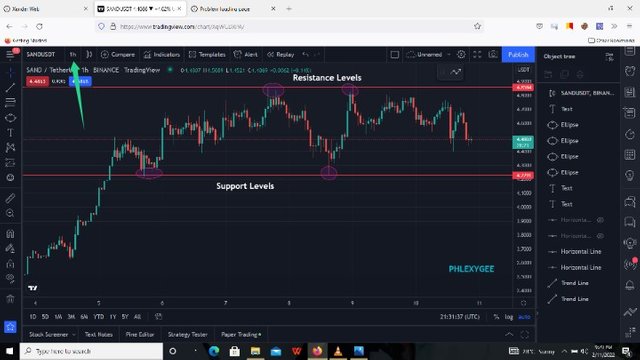
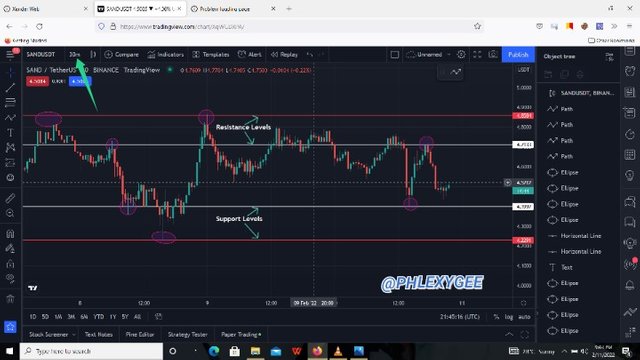
For the purpose of this homework I have initiated the Support and Resistance lines in two time frames, thus 1h and 30min to execute my SAND/USDT sell order.
The above SAND/USDT chart entails the red Support and Resistance lines for an hour time frame.
The above chart is a 30min time frame with white Support and Resistance lines combined with the previous red Support and Resistance lines of an hour time frame.
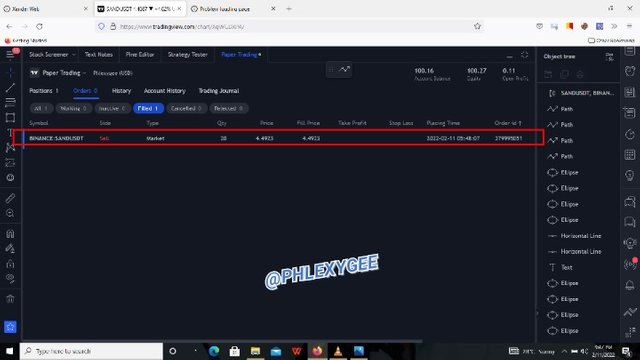
Based on the Support lines, I placed a 20 SAND/USDT sell order, as price was approaching the Support line to prevent further loss, because price has the potential of breaking the Support lines downwards.
The above is an image of my executed 20 SAND/USDT sell order.

4.- In a demo account, execute a buy order in the cryptocurrency market, placing the support and resistance lines in time frames of 1 day and 4 hours.
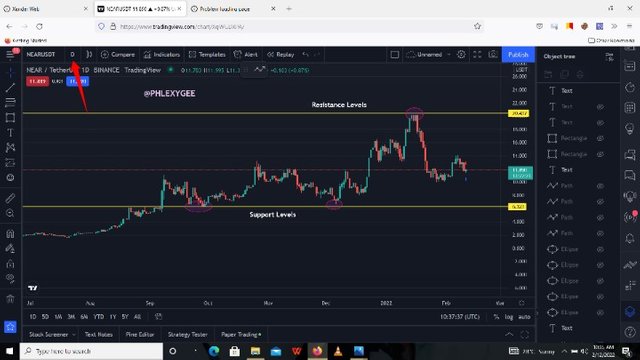
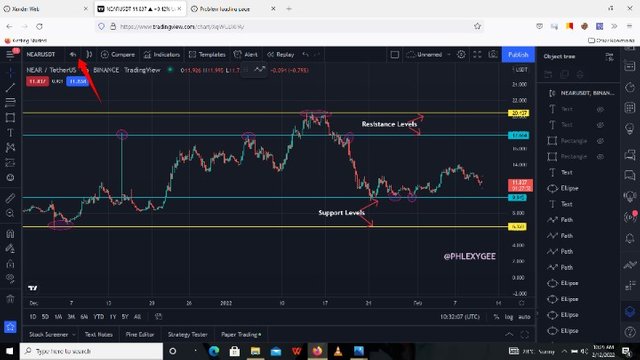
For this question I have initiated the Support and Resistance lines in two different time frames, thus 1D and 4h to execute my NEAR/USDT sell order.
The above NEAR/USDT chart entails yellow Support and Resistance lines for a day time frame.
The above chart is 4 hours time frame with light blue Support and Resistance lines attached with the previous yellow Support and Resistance lines which are made of a day time frame.
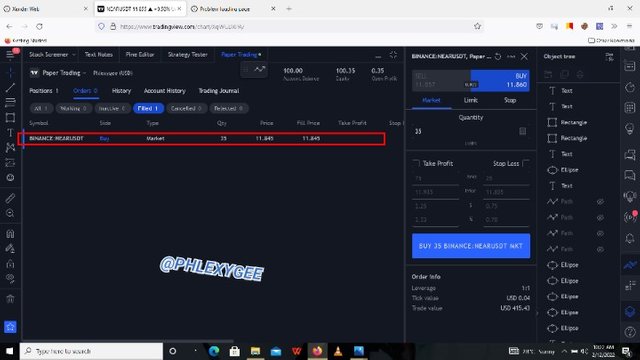
Based on the Support and Resistance lines, the historical data of the asset and the current formation of an uptrend, I think the price will move to the Resistance level in the future, therefore I placed 35 NEAR/USDT buy order in order to sell when there is a favourable price increase.
The above is an image of my executed 35 NEAR/USDT buy order.

5.- Explain the “Hanging Man” and “Leaking Star” candlestick patterns. Show both candlestick patterns on a cryptocurrency market chart. Screenshot is required.
Hanging Man and the Shooting Star candlestick are bearish candlesticks that signal bearish reversals if effectively formed. As with other technical analysis tools, it necessary to use confluence trading in consideration with these candlesticks before one will open a trade.
Now, I will ponder on them one after the other in the following section.
Hanging Man Candlestick
A Hanging Man candlestick resembles a Hammer candlestick, but it takes place during or after an uptrend and it signals for a bearish price reversal.
It comprises of a small real body with a long lower wick, and little or no upper wick.
The Hanging Man candlestick indicates the influence of sellers in the market, since price opens, falls significantly and bounce up to close at the open.
To validate the Hanging Man candlestick, the following candlestick to the Hanging Man must experience some level of price decrement (downtrend).
The above image is an ALGO/USD pair chart which demonstrates the formation of a Hanging Man candlestick.
A Hanging Man candlestick is a warning of bearish reversal, and therefore, most traders exit their long trades or enter into short trades during or after the confirmation candle.
Shooting Star Candlestick
A Shooting Star candlestick has a shape like the inverted Hammer, but it forms during or after an uptrend, unlike the inverted Hammer which takes place after down trends and it signals for a bearish price reversal.
It is made up of a small lower real body with a long upper wick (at least twice the real body), and little or no lower wick.
The above ALGO/USD pair chart gives an illustration about the emergence of a Shooting Star candlestick.
A Shooting Star candlestick exhibits the gradual dominance of sellers in the market, since price opens, rise significantly to make the upper long wick and then fall or close near the open price.
Just like the Hanging Man candlestick, there should be a downtrend afterwards in order to validate
Knowing that it is a bearish reversal signal especially after a couple of high-highs, traders then exit their long trade setups and enter to short trades during or after the confirmation candlestick.

6.- Conclusion.
Fundamental analysis, technical analysis and the utilization of candlestick patterns are powerful analysis methods that if properly utilize have the tendency of positively influencing one's trading decisions.
Confluence trading is key to the success rate of traders and investors in their endeavors, since no analysis tools provide accurate results or predictions.
Thank you Prof. @pelon53 for this week's interesting lesson delivery.
.png)
.png)