Hello family,
I hope you are doing great.
Today marks the fifth week of steemit cryptoacdemy Season-5, and I am glad to be a part.
Below is my presentation.
 Made with iMarkup
1. Explain Wedge Pattern in your own word.
Wedge Pattern
A Wedge Pattern that forms after an uptrend is termed as Rising Wedge, whiles a Wedge Pattern that takes place after a downtrend is referred to as Falling Wedge.
The above BTCUSD pair chart is an example of a Wedge pattern, and to be precise, it is a Falling Wedge Pattern as we can witness the converging and downward slope of the Trendlines.

2. Explain both types of Wedges and How to identify them in detail. (Screenshots required)
Rising Wedge Patterns
As mentioned earlier, Rising Wedge patterns are Usually formed at the end of bullish trends, although they might sometimes take place in downtrends, which leads to trend continuation and a later downward breakout.
With Rising Wedges, the two converging Trendlines slope in upward direction and there is a later downward breakout.
Rising Wedges in general normally signal bearish trend reversal.
Risen Wedges are usually confirmed after the price consolidates within the converging up-slopping Trendlines, and a downward breakout normally indicates the emergence of a downtrend.
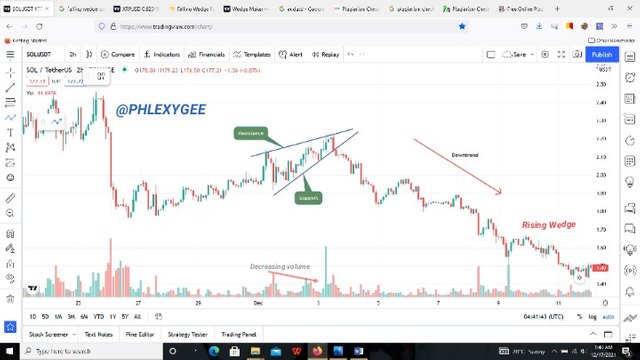
The above screenshot is a SOLUSDT pair chart with a Rising Wedge pattern. As shown in the chart, the price action narrowed into the two up-slopping converging Trendlines with about 6 touches, and later reversed to bearish at the breakout point.
How to identify Rising Wedge Patterns
There are various things to consider when we want to identify Rising Wedge Patterns, and below are some of them.
Consider a bullish trend ending; Rising Wedges are normally formed at the end of bullish trends, so we should consider the market trend when we want to identify them.
Check out the compatibility of the price action with two up-slopping converging Trendlines; we need to apply two (Resistance and Support) Trendlines that will converge upwards together with the minor high and low prices.
In simple terms, both Trendlines must move upwards and converge.There has to be multiple spaced touches on both Resistance and Support Trendlines; there should be a minimum total of five touches on both Trendlines without a break unless at the breakout point. There must be at least three touches on one Trendline and two touches on the other Trendlines.
There should exist a downward volume trend; in a Rising Wedge, the market volume normally trends downwards.
Consider a low breakout volume; the breakout volume for Rising Wedges are normally below average, although there are some exceptions.
Falling Wedge Patterns
Falling Wedges are Usually formed at the end of bearish trends, although sometimes they might as well be formed in downtrends, which leads to trend continuation and a later upward breakout.
With Falling Wedges, the two converging Trendlines slope in downward direction.
Falling Wedges in general normally signal a bullish trend reversal.
Falling Wedges takes place after the price consolidates within the converging down-slopping Trendlines, and an upward breakout normally indicates the emergence of an uptrend.
The above is a BTCUSD pair chart with a Falling Wedge pattern. As displayed, the price action narrowed into the two down-slopping converging Trendlines with about 7 touches, and reversed to bullish at the breakout point.
How to identify Falling Wedge Patterns
Although Falling Wedges are not quite easy to identify, however there are some key things to consider when we want to identify them, and beneath are some of them.
Look for a bearish trend ending; Falling Wedges basically forms at the end of a bearish trend, so we should take note of that when we want to identify them.
Check the compatibility of the price action with two down-sloping converging Trendlines; we have to draw two (Resistance and Support) Trendlines that will converge downwards together with the minor high and low prices.
In simple terms, both Trendlines must move in downward direction and converge.There should be multiple spaced touches on both Resistance and Support Trendlines; there must be a minimum total of five touches on both Trendlines without a break, unless at the breakout point. There has to be at least three touches on one Trendline and two touches on the other Trendline.
There should be a downward volume trend; in Falling Wedges, the market volume normally trends downwards just like with that of the Rising Wedges.

3. Do the breakout of these Wedge Patterns produce False Signals sometimes? If yes, then Explain how to filter out these False signals.
Yes, sometimes the breakout of the Wedge Patterns produce false signals, since no pattern or indicator gives 100% accurate prediction or results.
Fortunately, there are certain measures we can utilize in order to filter out these false breakout signals, and below are my contributions.
First, we can filter out these false signals when we witness an immediate price ranging instead of a price reversal after the breakout has taken place. Thus, there should be a trend reversal after the breakout before we can guarantee the genuineness of the breakout or pattern.
Another way to detect these false signals is to check if there is more than one breakout in the converging Trendlines, because sometimes a false breakout can take place within the converging Trendlines before the actual breakout, which mislead traders, therefore we should take note of such circumstances. The price should not break above or below the Trendlines unless at the final breakout point, which leads to a trend reversal.
Also, we can detect these false signals when we come across a diverging breakout of the Trendlines. For example, a Rising Wedge should be formed at the end of a bullish trend and there should be a downward break of the support Trendline, but not an upward break of the Resistance Trendline, so there will be a false breakout signal if the price break the Resistance Trendlines instead of the Support Trendline.
In simple terms, an upward breakout of a Rising Wedge and a downward breakout of a Falling Wedge indicates a false breakout signal, therefore we should avoid such breakouts as our entry because we will run at a lost instead.
We can equally utilize indicators in the chart in order to filter out these false breakout signals. Indicators such as Moving Average Convergence Divergence (MACD), Relative Strength Index (RSI), Average True Range (ATR) etc. can be used to filter out such false signals.
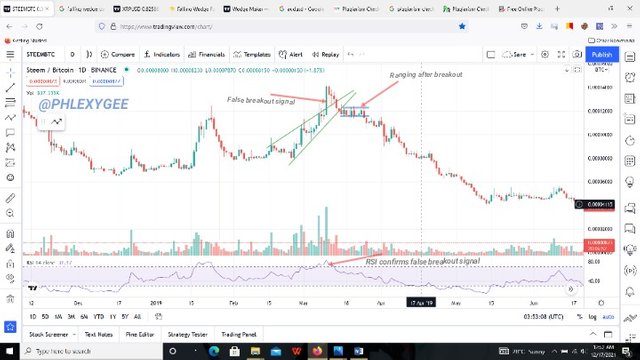
The above STEEMUSDT pair chart is an example of a false breakout signal in a Rising Wedge, and the RSI indicator confirmed it. The Rising Wedge Pattern misled the traders by signaling an uptrend breakout, meanwhile after a short period, the price fell back in the Trendlines and reversed to a downtrend which made the initial breakout a false breakout.
 source This chart comprises of two false breakout signals
Another example of a false breakout signal in a Rising Wedge is the above STEEMBTC pair chart whereby the price action initially broke the Resistance Trendline, dropped back in Wegde and moved into a ranging after the final breakout, instead of an immediate bearish trend reversal.

4. Show full trade setup using this pattern for both types of Wedges.( Entry Point, Take Profit, Stop Loss, Breakout)
Sell trade setup using Rising Wedge
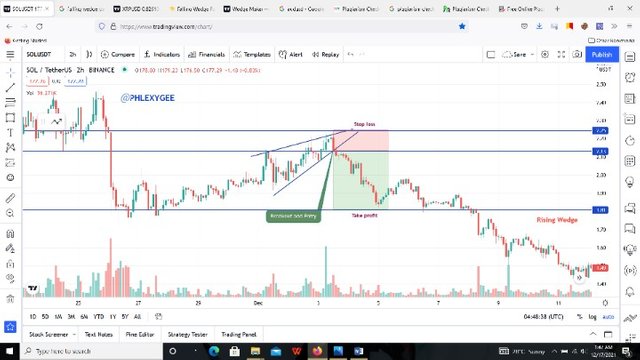
The above is a SOLUSD pair chart with a Rising Wedge pattern, and I used it to set up my sell order. As displayed on the chart, the price broke below the support trendline to a downtrend, which served as my sell entry. The breakout which was my buy entry point took place at $2.13, my stop loss was set at $2.25 and my take profit was placed at $1.81
Buy trade setup using Falling Wedge
The above is a BTCUSD pair chart with a Falling Wedge pattern, and I used it to initiate my buy order. As shown on the chart, the price broke above the resistance trendline to an uptrend, which served as my buy entry. The breakout which was my buy entry point took place at $33,509.39, my stop loss was set at $27,558 and my take profit was placed at $53,383.76

5. Conclusion
The formation of patterns also have effect in our trading decisions, therefore it is necessary for us to learn and understand the various trend patterns including the Wedge Pattern so that we will become successful with our trading endeavors.
We should take note that no technical analysis tools including the Wedge Patterns provide 100% accurate predictions, therefore there is the necessity to combine the best tools in order to make the best out the market.
Patience and good technical analysis is the key to trading success.
I have learned a lot.
Thank you Prof. @sachino8 for this week's insightful lesson.
.png)

.png)

.png)