Hey guys,
Welcome to the 4th week of the season 5 SteemitCryptoAcademy intermediate lecture by Professor @utsavsaxena11.
Without wasting much of our time, let me quickly proceed with the given tasks.

QUESTION 1
Explain Puria method indicative strategy, what are its main settings. which timeframe is best to setup this trade and why? (Screenshot needed and try to explain in detail)
The Puria method indicative strategy is a trading method that deals with the combination of different indicators such as One Moving Average Convergence Divergence (MACD) and Two Moving Average Weighted indicators.
The two moving average weighted indicators will be set to have different periods and sources in other for it to detect price changes at different levels.
Also, the moving average indicator helps to identify price direction by filtering out minor price functions on the market thereby making apparent the actual overall price movement.
The Moving Average Weighted indicators identify a price movement by lying either below or above the price chart. When it is trending below the price chart, it shows a bullish trend movement and when it trends above the price chart, it indicates a bullish price movement.
While the MADC indicator serves to identify a change in price momentum thereby providing signals which aid traders to identify when a bullish or bearish momentum is high. This helps them take either a buy or sell position.
The MACD indicator also comprises a signal line that lies in the middle. When the MACD line crosses over the signal line, it indicates a high bullish momentum which in turn signals a possible start of a bullish price movement.
When the MACD line crosses below the signal line, it indicates a high bearish momentum which in turn signals a possible start of a bearish trend and discontinuation of the now formal bullish trend.
Just as I have already stated above, the proper combination of these two indicators is what makes up the Puria method indicative strategy.
- IT'S MAIN SETTINGS
In setting up the Puria method of indicative strategy, three indicators are required to be properly set.
These three indicators include two Moving Average Weighted Indicators and one Moving Average Convergence Divergence indicator.
The period of the first moving average indicator is set at 75 length while the source is set at low. Coming to the second moving average indicator, its period is set at 85 with its source closed. The time frame used in these two indicators is the same as the chart.
- screenshots
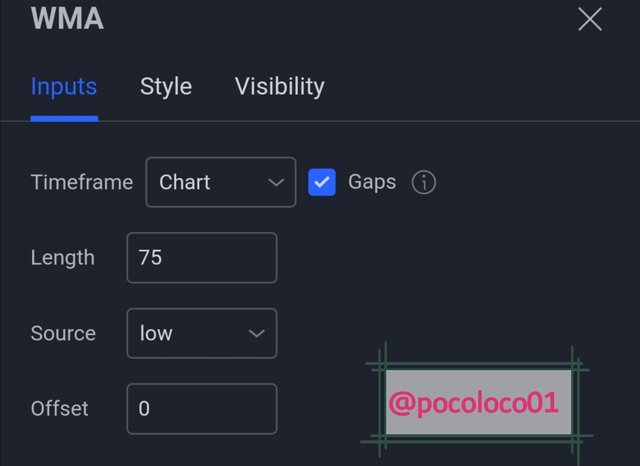
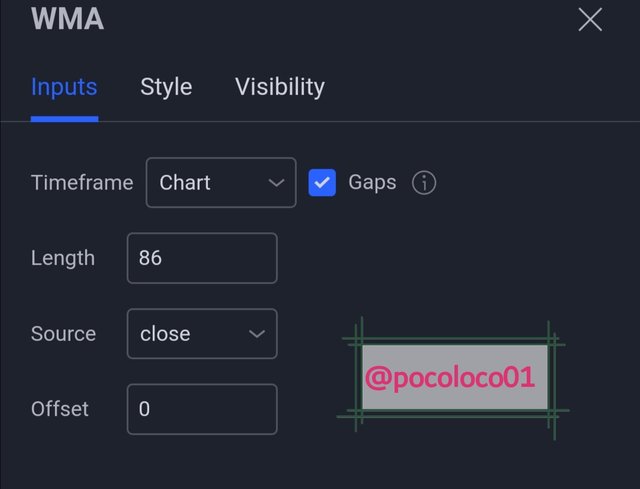
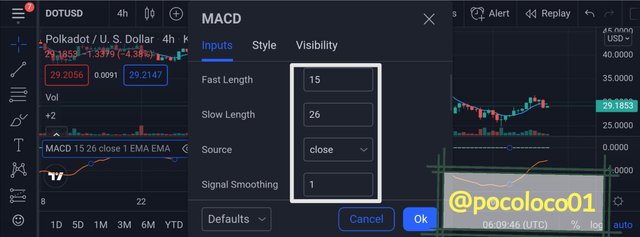
Setting the Moving Average Convergence Divergence (MACD), three changes are to be made on the settings and this includes changing the first length from default to 15, changing the low length to 26, and setting the signal smoothing from 9 to 1.
- Screenshot
- THE BEST TIMEFRAME FOR THIS TRADE
The timeframe best for this trading method are daily timeframes such as M1, M3, M5, M15, M30, H1 and H4 and other daily time frames.
This is because the trading method is more profitable and is mostly used by intraday traders. It allows them to make small but regular profits during Intraday trading due to the frequent signal it generates.
In as much as this trading, the method is applicable to all timeframes, the lesser the timeframe, the more profitable because it will allow traders to take more advantage of the frequent signals it produces at different intervals.
- FULL APPLICATION OF PURIA METHOD INDICATIVE STRATEGY
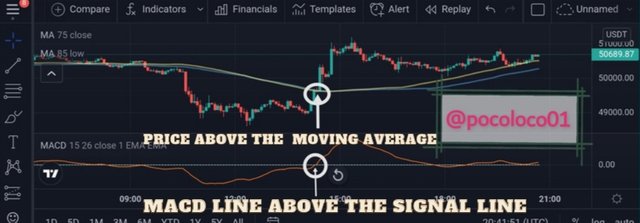
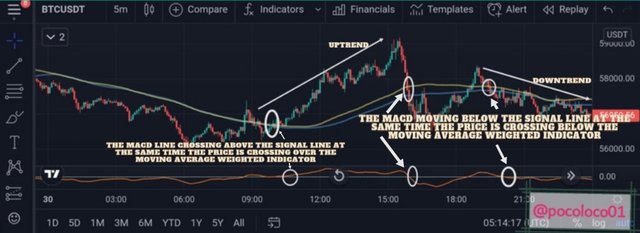
After setting the indicators as explained above, a trader is expected to observe the movement of the MACD line. Once the line moves over the signal line, it shows that there is a high bullish momentum in the market and a possible uptrend is expected.
A trader using the Puria method indicative strategy is expected to take a buy position here. He or She is also expected to wait and observe the price closing above the moving average before making this trading decision.
- screenshot
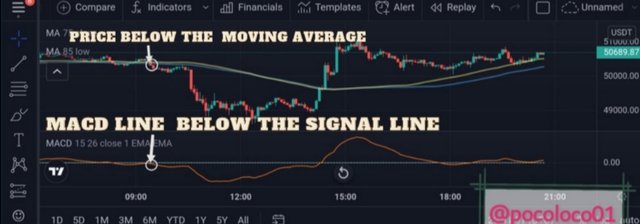
For a bearish price movement, a trader is expected to wait for the MACD line to move below the signal line. Once that happens, he or she is also expected to check if the price has also moved below the moving average indicator before taking a sell position.
- Screenshot

QUESTION 2
How to identify trends in the market using the puria method. Is it possible to identify trend reversal in the market by using this strategy? Give examples to support your article and explain them. (screenshot needed)
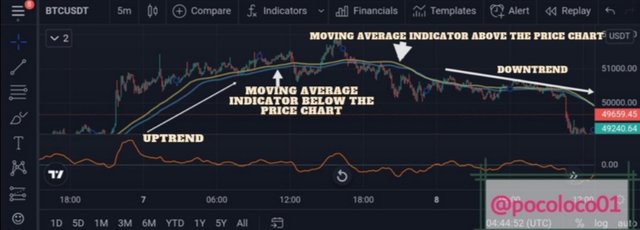
In using the Puria method, trends and trend directions are usually identified using the moving average weighted indicators. This indicator works by identifying trend directions by filtering out minor price fluctuations (noise) thereby making obvious the actual trend direction.
It does this by trending either below or above the price chart. When the moving average weighted indicator trends above the price chart, it indicates an uptrend moving of the price chart and when it trends below the price chart, it indicates a downtrend movement of the price chart within a certain period.
- Screenshot
- Is IT POSSIBLE TO IDENTIFY TREND REVERSAL IN THE MARKET USING THE PURIA METHOD
YES!!
The Puria method allows a trader to identify a possible trend reversal.
When the MACD moves above the signal line, it signals a bearish-to-bullish trend reversal and when it does move below the signal line, it signals a bullish-to-bearish trend reversal.
In addition, the price moves and closes above the moving average weighted indicator for a bullish-to-bearish trend reversal and also moves and closes below the moving average weighted indicator for a bearish-to-bullish trend reversal.
The above action of indicators and price on indicators helps a trader to speculate a possible trend reversal thereby making him or her take either a sell or buy position.
- screenshot
The issue of Divergence that can be identified using the Puria method can also serve as a trend reversal indicator.
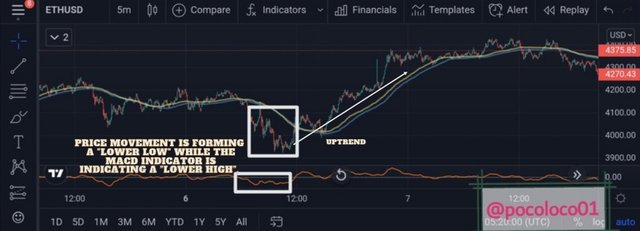
Divergence occurs when the price of an asset is moving or forming a pattern contrary to the technical indicator (in this case, MACD).
The chart below shows a bearish price chart forming a lower low which is an indication of a continuous downtrend while the MACD indicator is forming a lower high which is an indication of a bearish trend reversal.
- Screenshot
When the above happens, it indicates that the current trend is weak and prone to a possible reversal regardless of its pattern of formation.
This in turn signals a trader on the position to take thereby guiding him or her away from force signal.

QUESTION 3
In the puria strategy, we are using MACD as a signal filter, By confirming signals from it we enter the market. Can we use a signal filter other than MACD in the market for this strategy? Choose one filter(any Indicator having 0 levels) and Identify the trades in the market. (Screenshot needed).
Yes!!
Other than the MACD Indicator, we can use other indicators with zero levels (signal lines). This is for us to be and to identify when the bullish or bearish momentum is high in the market thereby knowing when to either buy or sell just the way we do use the MACD indicator.
The indicator I will be using in place of MACD is ROC Indicator which stands for RATE OF CHANGE INDICATOR.
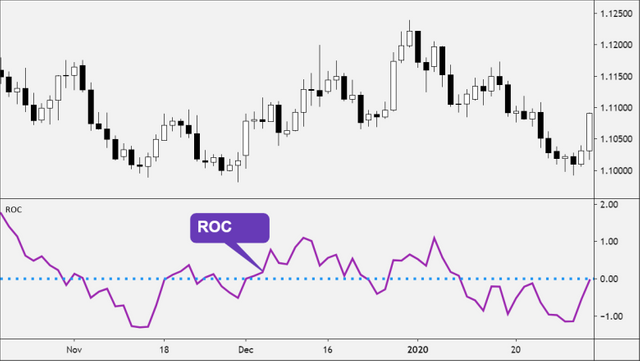
ROC INDICATOR
The ROC indicator is a trend-following momentum-based indicator that aids traders in detecting how fast the price of an asset is either falling or rising.
The ROC also determines trend direction. When the percentage change in price is negative, it indicates a downtrend while when it's positive indicates an uptrend.
Similar to the MACD, the ROC indicator identifies when the bullish or bearish price momentum is either high or low by trending either above or below its mid-point (signal line).
When the ROC line moves above the mid-point, it indicates a high bullish momentum in the market and when it moves below the mid-point, it indicates a low bullish momentum in the market. This also indicates a bearish-to-bullish and a bullish-to-bearish trend reversal.
In addition, the ROC indicator also identifies divergence by moving in contrary to price direction on the market chart. This also serves as a signal for trend discontinuation or reversal because it tells that the current price market is already weak and prone to a possible reversal.
- APPLYING ROC INDICATOR
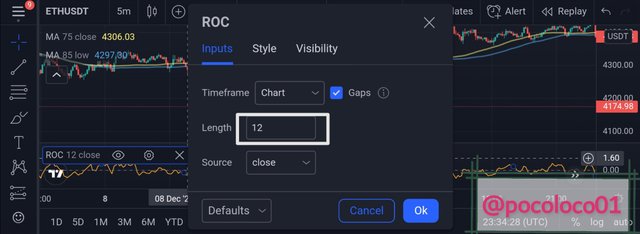
I will be using a period length of 12 on the ROC indicator. This is because we are dealing with intraday trading therefore a period length of 12 will help provide more clarity on the rate of change of price momentum.
- Screenshot
- IDENTIFYING TRADES IN THE MARKET
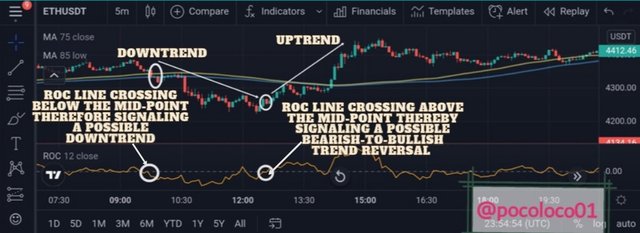
Using the ROC Indicator we can identify trades by observing the movement of the ROC line along the mid-point and it's pattern of formation.
When the ROC line crosses over the mid-point it signals a bearish-to-bullish trend reversal. And when it crosses below the mid-point, it signals a bullish-to-bearish trend reversal.
- Screenshot

QUESTION 4
Set up 10 demo Trades (5 buying and 5 selling on 5 cryptocurrency pairs using puria method indicative strategy. Explain any 2 of them in detail. Prepare a final observation table having all your P/L records in these 5 trades
I will be setting up some demo Trades using the puria method indicative strategy.
I will start by taking 5 buy positions on 5 different cryptocurrency pairs using the puria method indicative strategy.
BUY POSITIONS
(1) BUY POSITION OF BTC|USDT PAIR.
I will be explaining in detail the first buy position which is the BTC|USDT pair.
- Screenshot
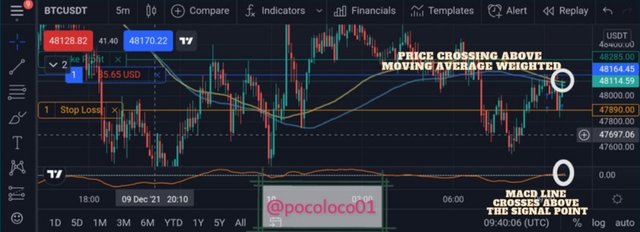
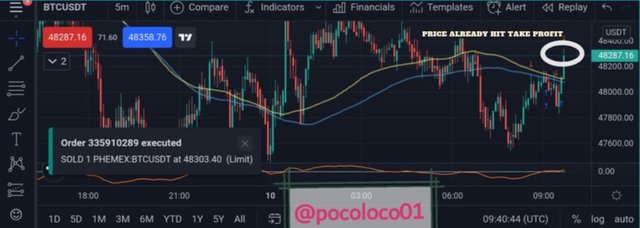
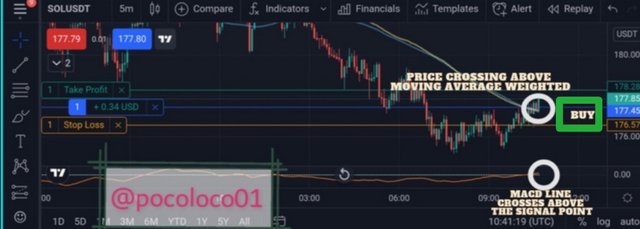
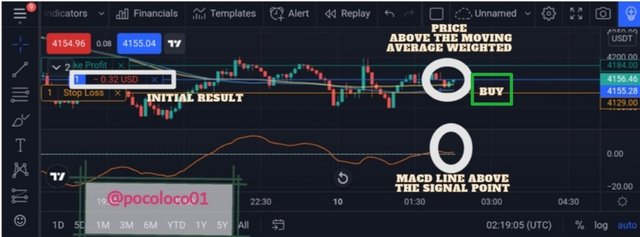
From the above analysis, the price crosses above the moving average weighted indicator and the MACD line crosses above the signal point thereby signaling a bullish movement in a M5 chart of BTC|USDT pair.
Using the Puria method indicative strategy, which is the combination of two Moving Average Weighted indicators and one MACD indicator.
The two Moving Average Weighted indicators made apparent the trend direction by filtering out minor fluctuations on the price chart.
Using the Moving Average Weighted indicators, I was able to easily decide when to make my entry because my entry was made as soon as the price crosses above the moving average after confirming the signal provided by the MACD indicator.
The MACD indicator serves to provide more accurate signals as regards trend direction and reversal.
When the MACD line crosses over its signal line, it indicates a bearish-to-bullish trend reversal, and when it crosses below its signal line, it signals a bullish-to-bearish trend reversal.
ENTRY POINT
The buy position was taken after the price closed above the moving average weighted indicator. This serves as further confirmation to the signal given by the MACD indicator.
STOP-LOSS
My stop-loss which serves to minimize risk was set slightly below the closest support zone below the current price chart.
TARGET LEVEL
The target level was set in consideration of the stop-loss which I took in the ratio of 1:1.
AFTER ANALYSIS
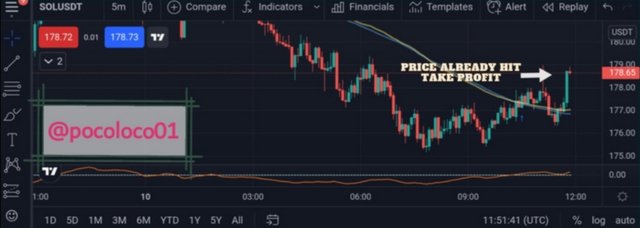
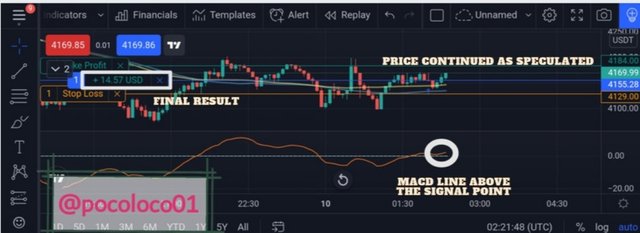
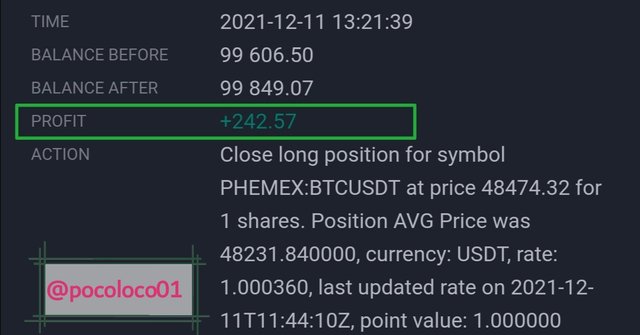
The trade went exactly as speculated using the Puria method indicative strategy and the target point was successfully attained.
- After analysis
- Result
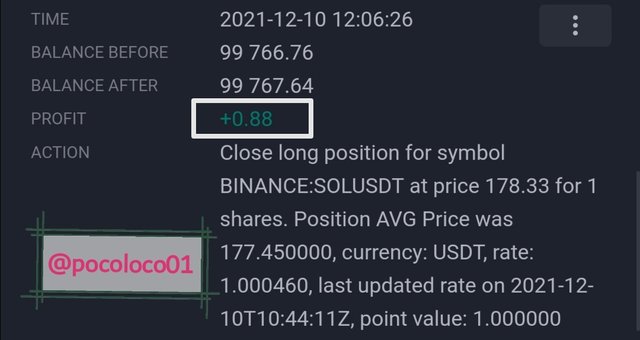
(2) SOL|USDT PAIR
- ANALYSIS
- AFTER ANALYSIS
- RESULT
(3)ETH|USDT PAIR
- ANALYSIS
- AFTER ANALYSIS
- RESULT
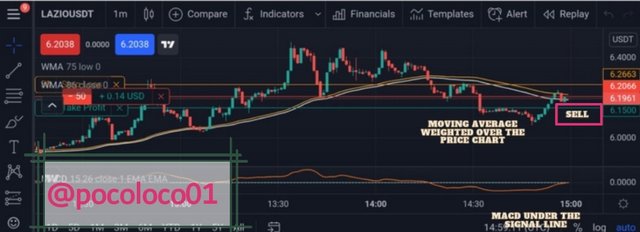
(4) LAZIO|USDT PAIR
- ANALYSIS
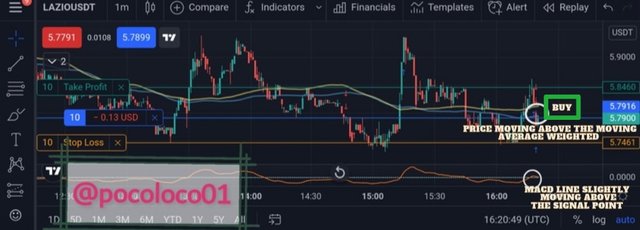
- AFTER ANALYSIS
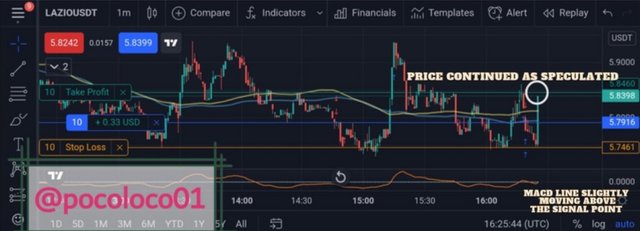
- RESULT
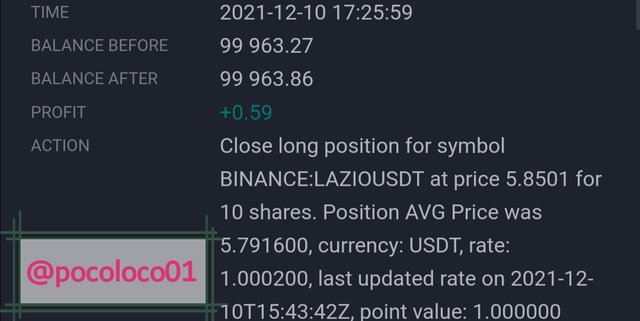
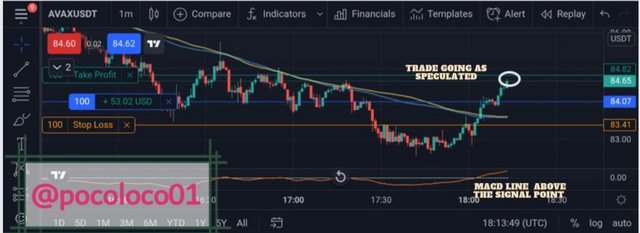
(5) AVAX|USDT PAIR
- ANALYSIS
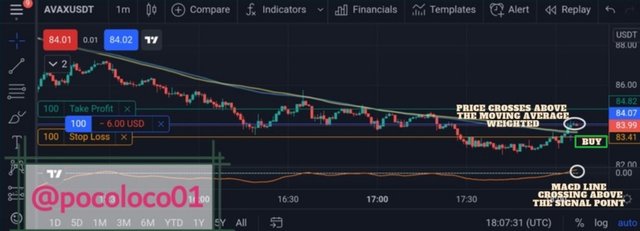
- AFTER ANALYSIS
- RESULT

BEARISH POSITIONS
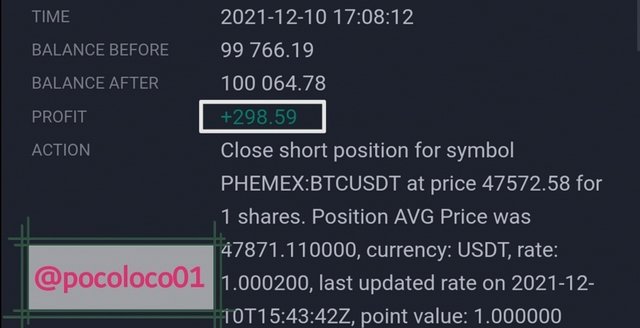
BTC|USDT PAIR
I will be explaining in detail the BTC|USDT pair.
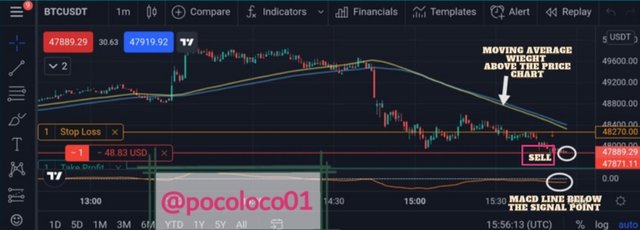
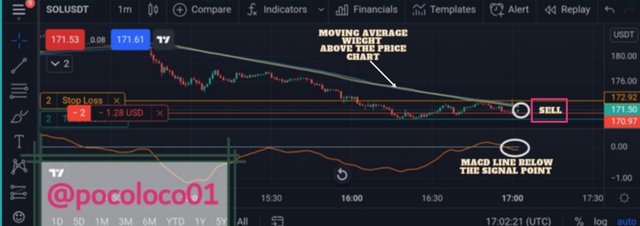
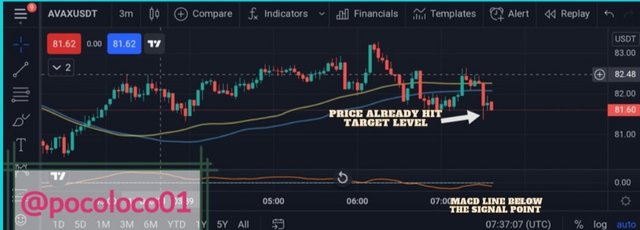
From the above analysis of BTC|USDT pair, using the Puria method indicative strategy, at first, the Moving Average Weighted Indicators were moving above the price chart which is an indication of a bearish price movement.
After successful identification of trend direction, the MACD indicator was carefully observed on a M1 chart and I saw that the MACD line crosses below its signal point thereby indicating a more bearish movement at that time.
Also, seeing that the Moving Average Weighted Indicators are still above the price chart, I decided to take a sell position.
ENTRY
Being a 1-minute chart, my entry was made almost immediately after I read the signal provided by the MACD Indicator. The signal needed no further confirmations as the price is already below the Moving Average Weighted Indicators. which is a bearish indication.
STOP-LOSS
My stop-loss was set slightly above the closest resistance zone located just above the current price. This was set to minimize loss should in case the price goes against my analysis.
TARGET LEVEL
The target level was set in consideration of the stop-loss set above in a risk-reward ratio of 1:1.
AFTER ANALYSIS
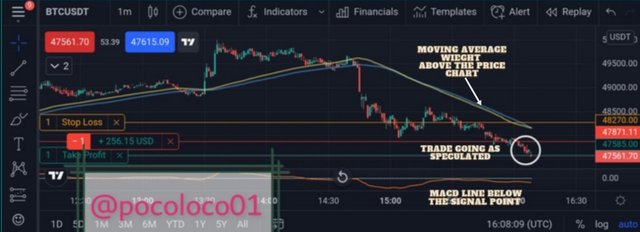
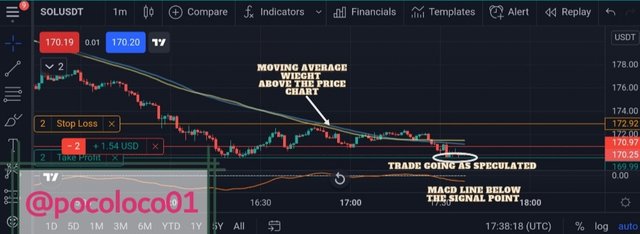
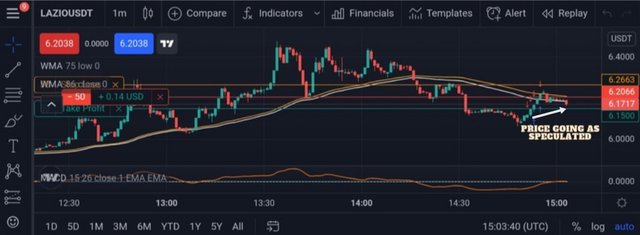
The price went exactly as speculated using the Puria method indicative strategy and I was able to secure some profits from the trade.
- After analysis
- Result
(2) SOL|USDT PAIR
- Analysis
- After Analysis
- Result
(3) ETH|USDT PAIR
- Analysis
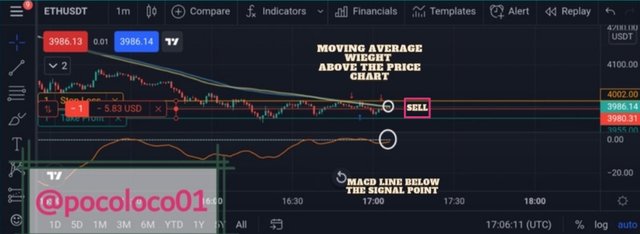
- After analysis
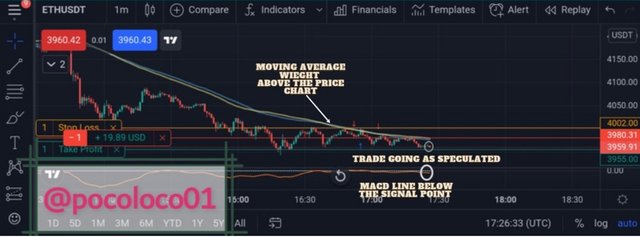
- Result
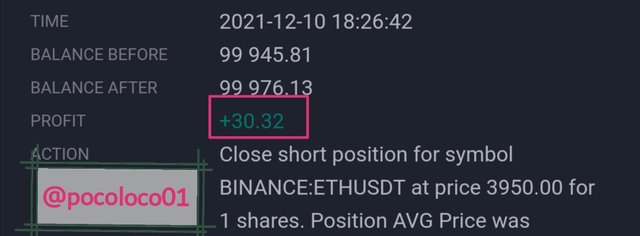
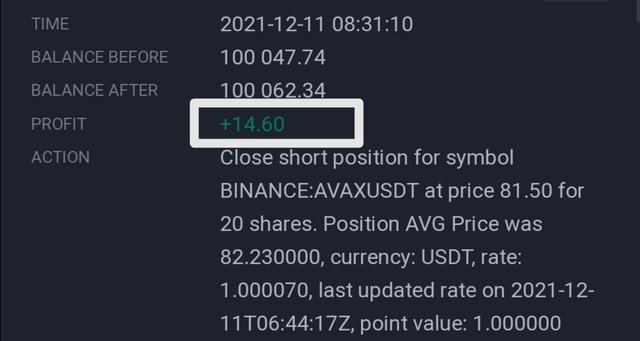
(4) AVAX|USDT PAIR
- Analysis
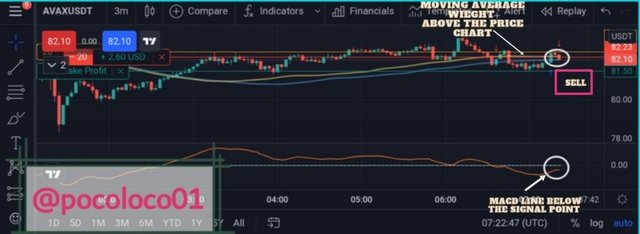
- After analysis
- Result
(5) LAZIO|USDT PAIR
- Analysis
- After analysis
- Result
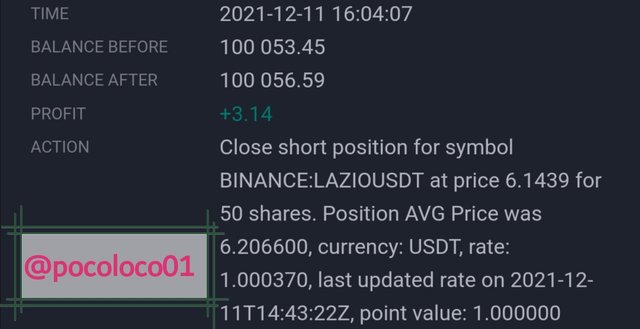
| S/N | PAIR | BUYING PRICE | SELLING PRICE | PROFIT | LOSS | TF |
|---|---|---|---|---|---|---|
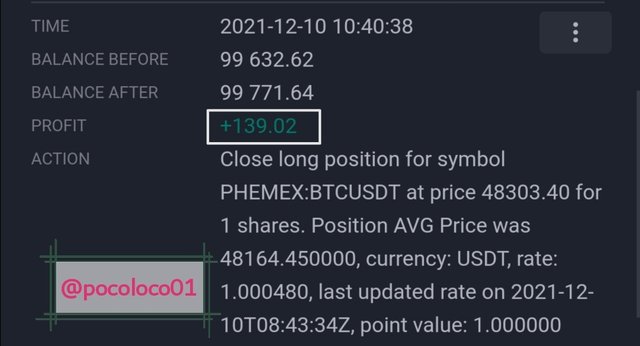
| 1 | BTC/USDT | $48,164 | Null | $319.02 | Null | 5min |
| 2 | SOL/USDT | $177.45 | Null | $0.88 | Null | 5min |
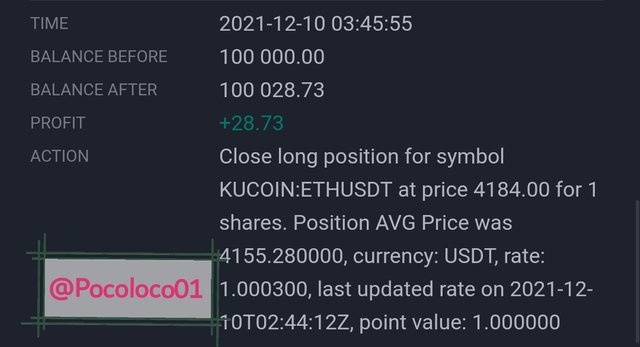
| 3 | ETH/USDT | $4,155.2 | Null | $28.73 | Null | 5min |
| 4 | LAZIO/USDT | $5.7196 | Null | $0.59 | Null | 1min |
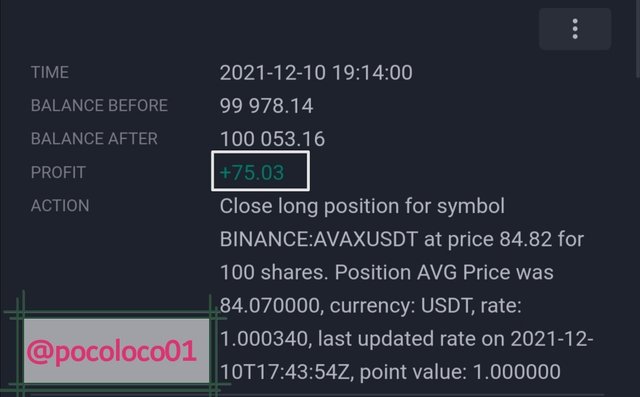
| 5 | AVAX/USDT | $84.0 | Null | $75.03 | Null | 1min |
| 6 | BTC/USDT | Null | $47,871 | $298.5 | Null | 1min |
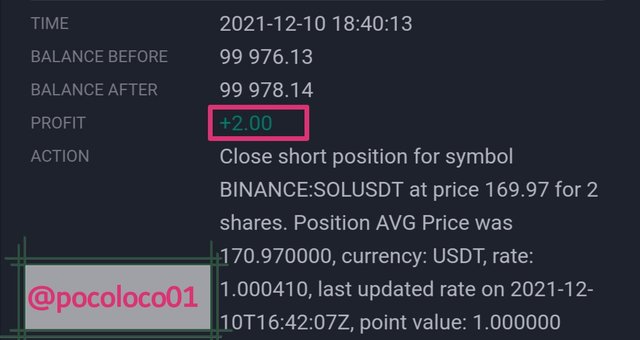
| 7 | SOL/USDT | Null | $170.97 | $2 | Null | 1min |
| 8 | ETH/USDT | Null | $3,980 | $30.32 | Null | 1min |
| 9 | AVAX/USDT | Null | $82.23 | $14.60 | Null | 1min |
| 10 | LAZIO/USDT | Null | $6.20 | $3.14 | Null | 1min |

QUESTION 5
You have to make a strategy of your own, it could be pattern-based or indicator-based. Please note that the strategy you make must use the above information. Explain full strategy including a time frame, settings, entry-exit levels, risk management, and place two demo trades, one for buying and the other for selling
Before choosing indicators for my trading strategy, I will first explain some factors to consider before choosing indicators for a trading strategy and these factors include;
- Knowing your trading strategy.
- Understanding the market trend.
- Understanding the type of indicator.
- Finding confluence.
KNOWING YOUR TRADING STRATEGY:
I purposely choose this as the number thing to consider before choosing indicators because it deals with knowing the type of trading that works for you or the one you are about venturing into.
If you're a scalper, it is best to use leading indicators such as RSI, Stochastic, Donchain channel, etc. This is because market information varies with time and these leading indicators provide fast signals which aid scalpers in decreasing the size of their stop-loss.
UNDERSTANDING THE MARKET TREND
This is also an important factor to consider because a trader should be able to know to understand different kinds of market trends and indicators suitable for each.
A market of high volatility requires a volatility-based indicator whereas a trending market requires a trend-based indicator.
UNDERSTANDING THE TYPE OF INDICATOR
This is also very vital in other to maximize profit while trading. A trader who is using a lagging indicator such as Bollinger bands or MACD and still wants to enter a trade on time will require a combination of a leading indicator in other to achieve that.
FINDING CONFLUENCE
Confluence simply means reconfirmation of a signal using a different indicator. Just like what we did above using Moving Average Weighted indicator and MACD.
The MACD provides signals that indicate trend direction and these signals are further confirmed by the Moving Average Weighted Indicators.
Having looked into the factors to consider before choosing indicators, I will be choosing two indicators which are STOCHASTIC and EMA.
MY REASON FOR CHOOSING THESE TWO INDICATORS
I chose STOCHASTIC because it is a leading indicator that aids to identify when an asset is either overbought or oversold.
Adding to this, it will also help me as a scalper in identifying new trends and maximizing profits from them even if the trend doesn't last.
Coming to the EMA, I chose it because it is a trend-based indicator that will aid me in identifying overall trend direction by filtering out minor fluctuations and this will help me to easily identify a bearish or bullish trend.
In addition to the above, the EMA is essential for me because it concentrates more on recent prices, unlike the SMA which adds equal weight to all prices.
ANALYSIS
I will start by setting up my two indicators on a BTC|USDT price chart.
I will be using the default settings for the Stochastic indicator and will only be changing the color of the EMA from blue to white for clarity's sake.
- Screenshot
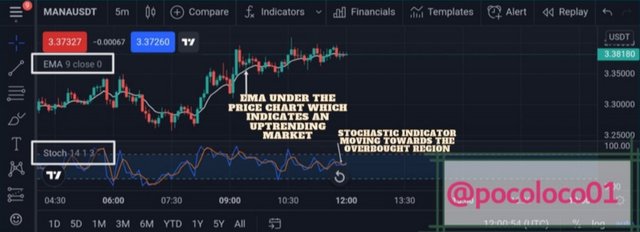
- I will start by taking a buy position using my above-mentioned trading strategy
MY BUY POSITION
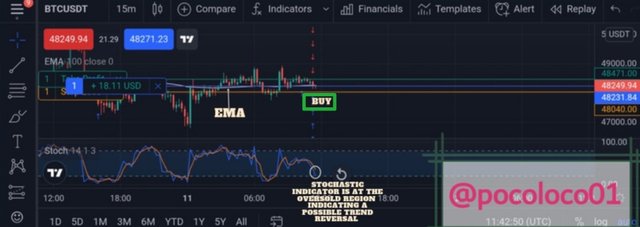
After identifying the TREND direction using the EMA, I checked and observed Stochastic indicator to be at the oversold region which signals a possible trend reversal.
Note: As a scalper, my concentration here is on the recent price and not on the overall price formation which is why I'm using an Exponential Moving average as a trend indicator.
ENTRY / EXIT LEVEL
The buy order was initiated when the price reached the oversold region as signaled by the stochastic indicator.
A Stop-loss is set slightly below the last low formed before the new price which now serves as the closest support and a Take-profit is set at the closest resistance or preferably in consideration of the stop-loss by taking them on a ratio of 1:1, 1:2 or at most 1:3.
But in my analysis, I took them on a ratio of 1:1.
- AFTER ANALYSIS
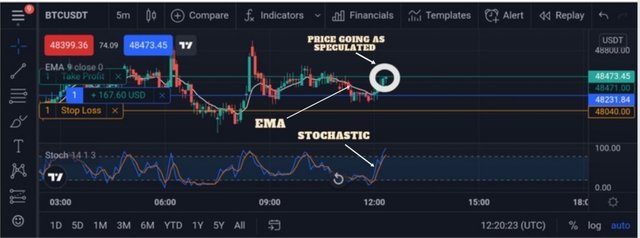
- RESULT
MY SELL POSITION
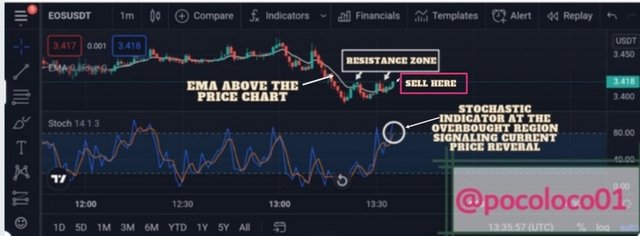
Using my strategy, the same thing is applicable here.
I first identified the trend direction using the EMA and looking at the applied stochastic indicator, it was already at the overbought position which in turn signals a trader to take a sell position.
ENTRY AND Exist LEVELS
The price was found to be at a resistant level and the stochastic indicator is at the overbought region made me take a sell position in preparation for a possible reversal.
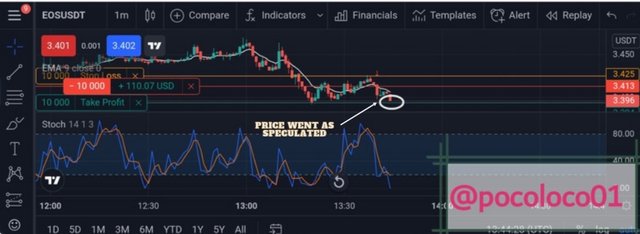
The Stop-loss was set slightly above the resistant zone with the target level taken in a ratio of 1:1 with the stop-loss.
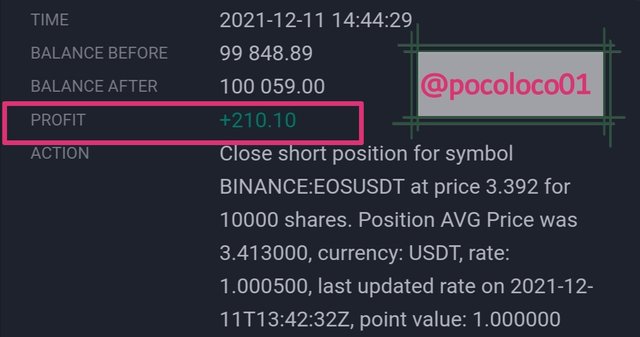
- AFTER ANALYSIS
- RESULT

CONCLUSION
Just as we have seen, Puria Method indicative Strategy is a trading method that deals with the combination of different indicators such as Two Moving Average Weighted and MACD indicator that allows traders to make daily profit out of minor price flauctions.
This trading method is specially used by scalpers therefore it is best used with reduced stop-loss and target levels in other to exist in the market even if the trend is short-lived.
Special regards to Professor @utsavsaxena11 for this beneficial lecture.
