So let's answer all the questions asked by professor:-

What do you understand about Market Structure?
As we all know that cryptocurrency is highly volatile and it's price can go up and down in a very short period of time. And this variation in price is also not linear.
This change in the price of the asset is wave like. And in this way it creates many points. And these points creates the market structure for that asset.
So in simple words we can say that :- So market structure is the graphical representation of this price volatility (price change) of any asset. As I told that volatility in price of any asset is not linear so we can't represent this change using a straight line.
Using these waves pattern, one can analyse the resistance and minimum support price of the asset. And it helps in minimising the loss and maximizing the profit by analysing the perfect entry and exit points.
Now resistance is the point where the rise in the price of any asset is expected to stop and conversely the support is the point where the drop in price of the asset is expected to stop.
Now we know that price of any asset can go only in three ways:-
Upwards (when the price of any asset increases. This is called uptrend or bullish trend)
Downwards ( When the price of any asset decreases this is also called downtrend or bearish trend)
Sideways ( when the price of any asset changes such that it remains in a certain span)

Now let's understand market structure for every situation mentioned above;-
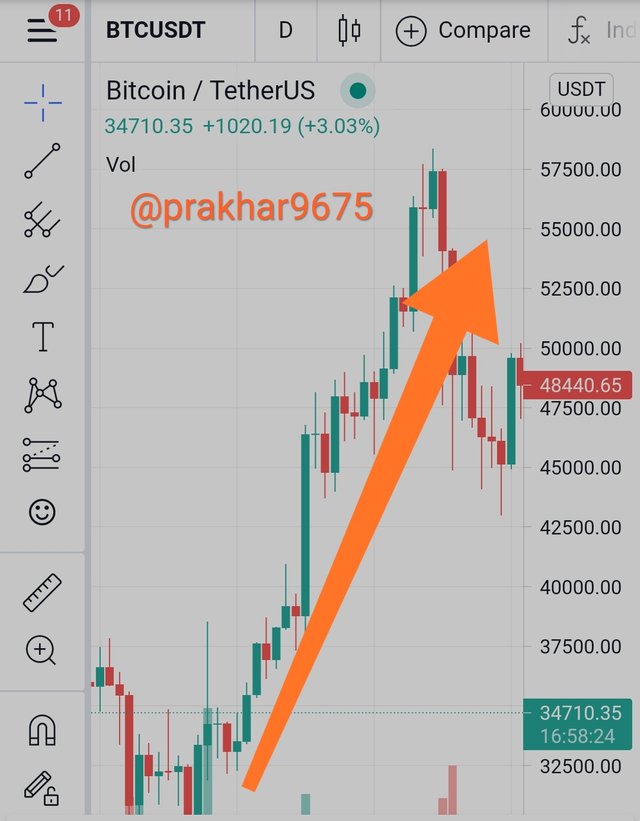
Market Structure for uptrend:-
When the price of any asset increases then market structure representing that trend is such that it consists a sequence of highs and lows in which every high is higher than its previous high.
Market Structure for downtrend:-
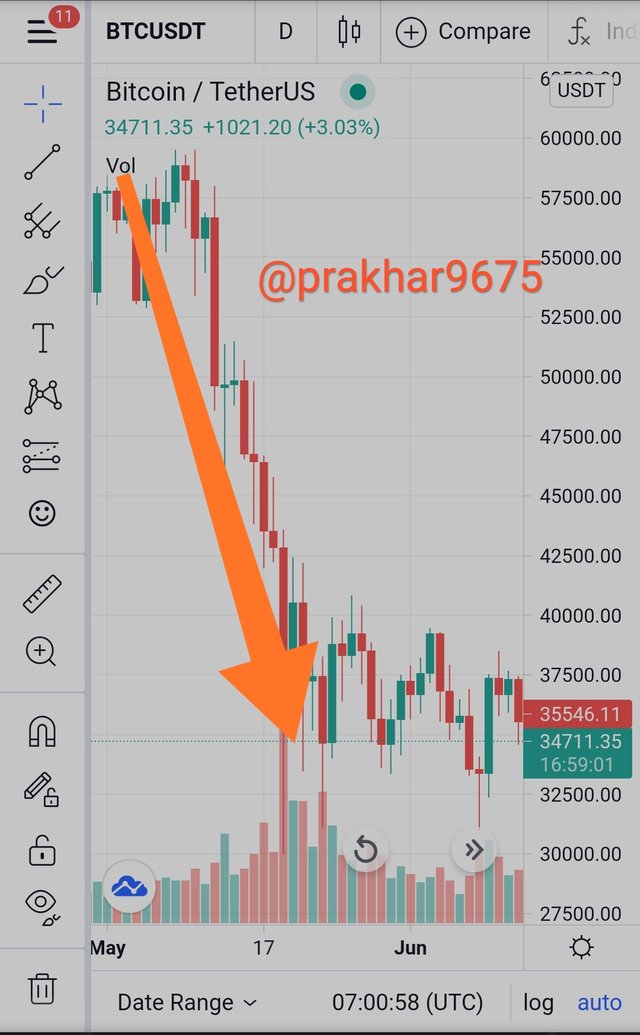
When the price of any asset decreases, then Market Structure representing that trend consists a sequence in which there are various Highs and lows similar to uptrend.
But there is a difference that in this every low is lower than previous low.
Sideways market structure:-
When the price of any asset changes such that it changes within a span, then such trend is represented by such a market structure in which every high and low is nearly equal to its previous counterpart.
And all these trend and related market structure continues till the situation or trend changes

What do you understand about Lower High and Higher Low? Give Chart Examples from Crypto Assets.
As we have discussed that price of any asset changes like a wave and in this way it creates many points that creates market structure. These points in many patterns gives us signal about highs lows and support and resistance.
So the concept of higher high, higher low is related to Highs or you can say uptrend and similarly the concept of lower high and lower low is related to downtrend.
Let me elaborate it using examples:- here I am taking BTC/USDT chart for every example
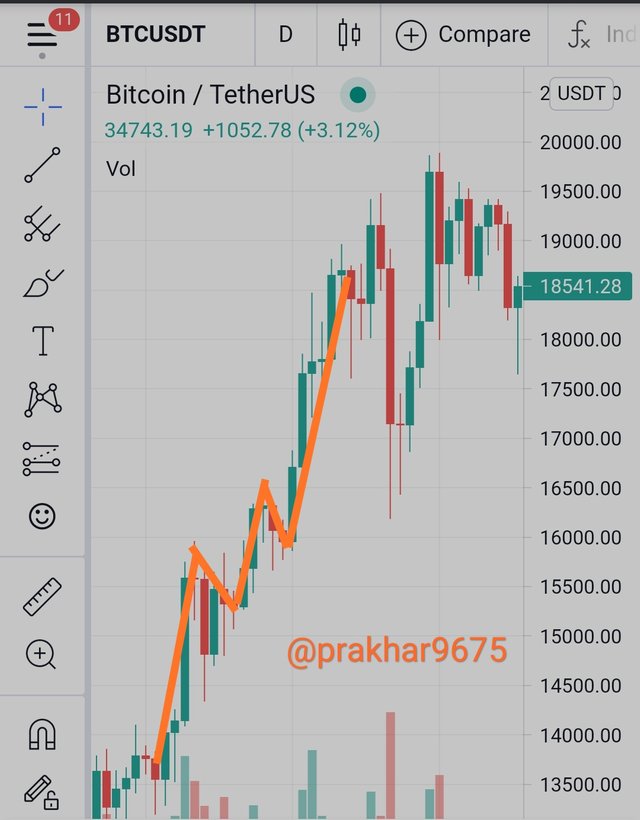
Higher high:- when the price of any asset changes such that in market structure representing this trend has many High. But these highs are such associated that a high is higher than that of previous. Then it is called higher high.
higher high
So in this chart you can see that every high is higher than the previous one.
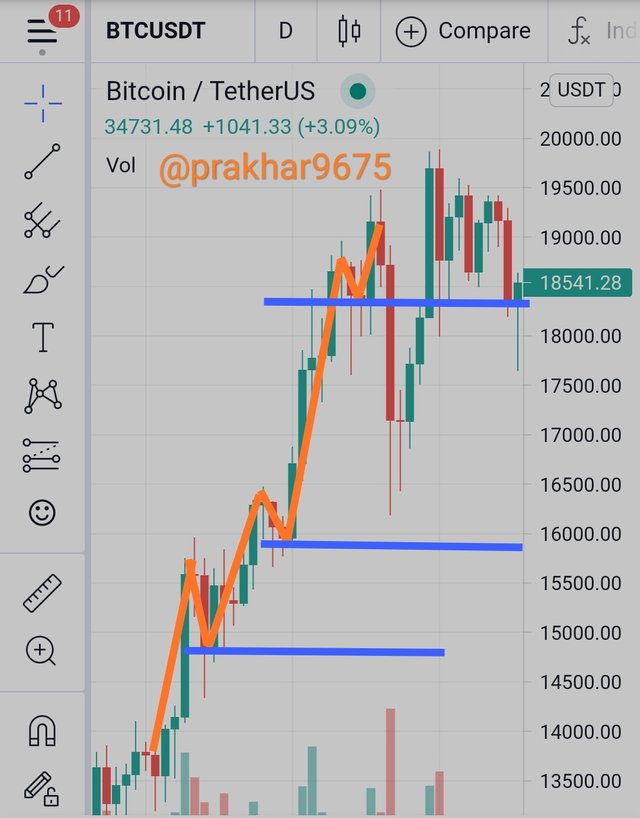
Higher low:- higher low is also associated with uptrend of any asset. When the price of any asset increases and market structure representing that trend is such that it is associated with various lows in which a low is at a higher place than that of previous.
higher low
Lower high:- lower high is associated with downtrend of any asset. When the price of any asset decreases and the market structure representing that trend shows that a high is at a lower level as compared to its previous one. Then that is called lower high.
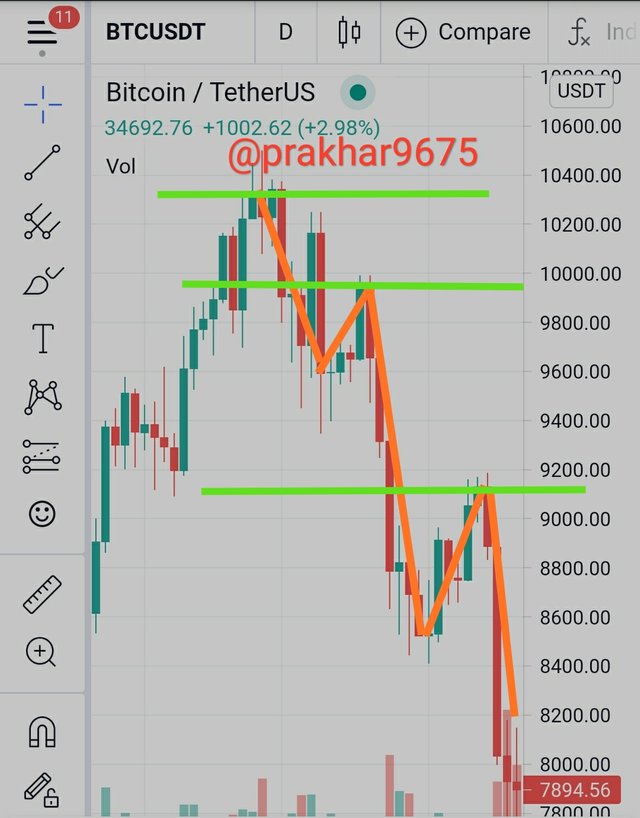
lower high
Lower low:- lower low is also associated with the downtrend of any asset. When the price decreases and market structure related to that asset shows that a low is at a lower level than its previous one then it is called lower low.
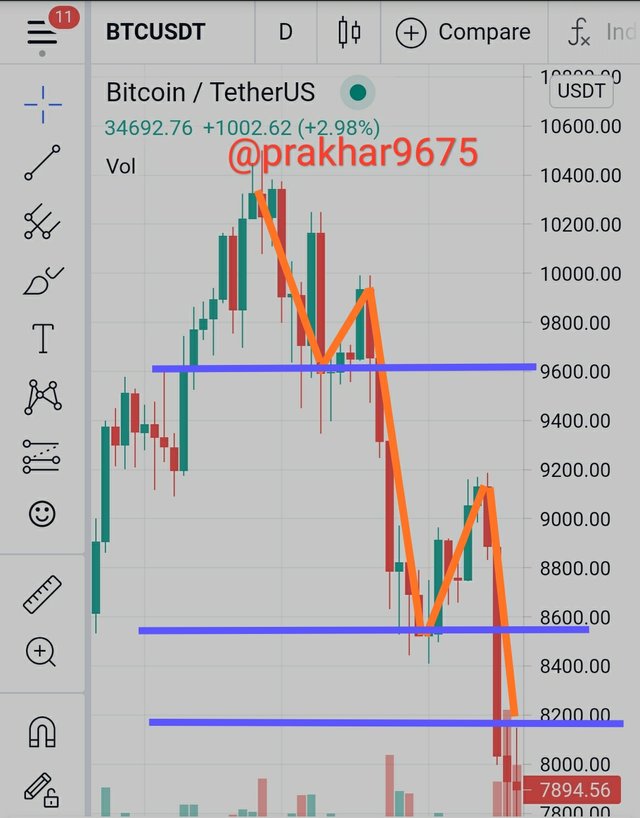
lower low
Higher low, higher high and lower high, lower Low gives us signal immediately about uptrend and downtrend respectively

How will you identify Trend Reversal early using Market Structure Break? (Screenshots Needed)
Trend reversal means the change in the market trends that is from uptrend to downtrend or vice versa. When the market structure breaks it signifies the reversal in Market trend.
As we have already discussed all the features of market structure now it's not very hard to identify Trend reversal.

Trend reversal in uptrend:-
A reversal In uptrend can be identified when a lower high is formed. With this formation, market structure signifies the trend reversal that indicates that this high and lower than its previous high and market is entering into downtrend.
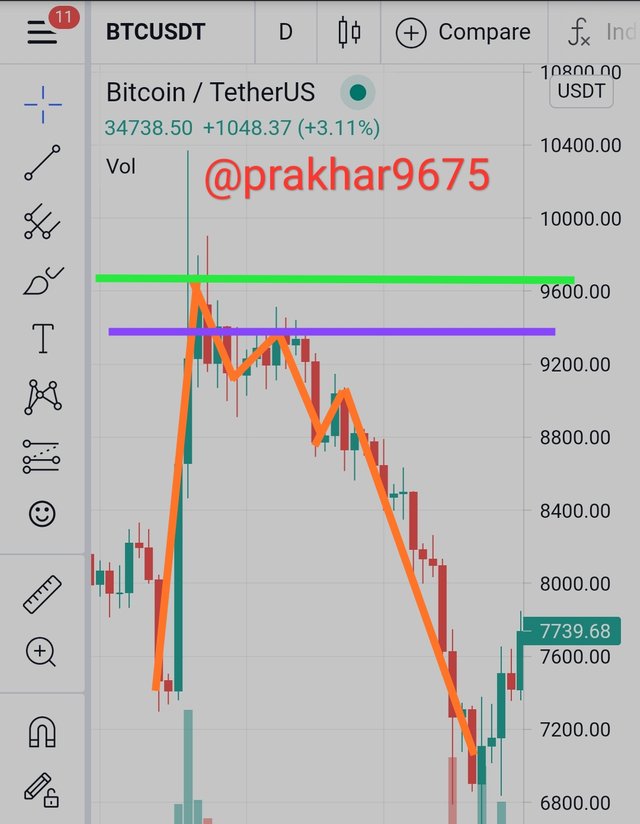
So here you can see downtrend was started with the formation of a lower high.

Trend reversal in downtrend:-
A reversal in downtrend can be identified with the formation of a higher high or higher low. With the formation of the letter we can conclude that market is now entering into uptrend.
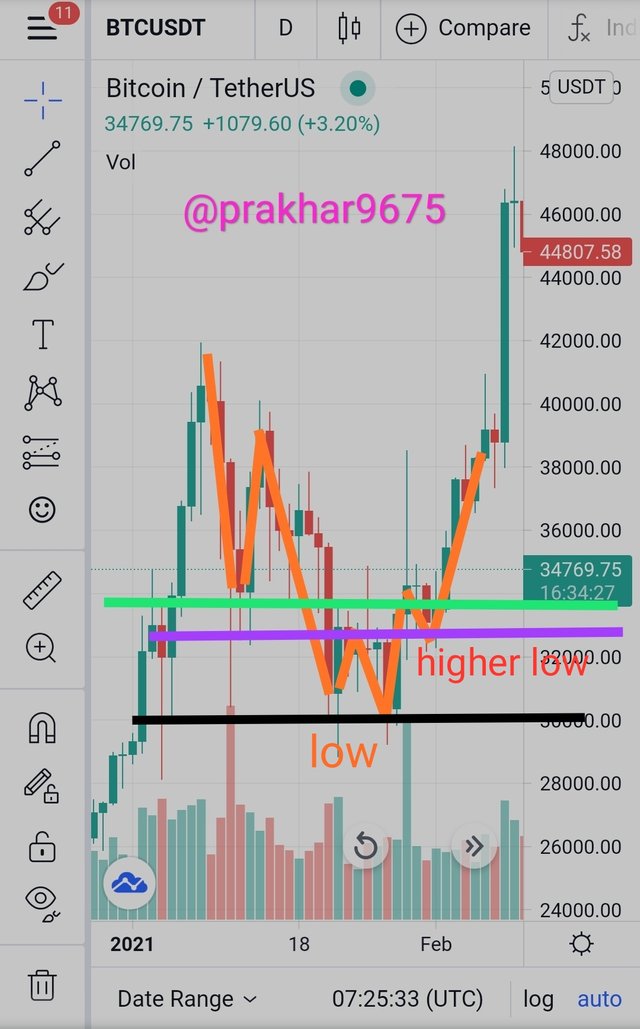
price chart of BTCUSDT
So you can see here that downtrend was uprooted and uptrend started with the formation of a higher high or you can say higher low.
So by identifying higher high, lower high and lower high or lower low, one can easily identify the trend reversal using market structure.

Explain Trade Entry and Exit Criteria on any Crypto Asset using any time frame of your choice (Screenshots Needed)
As we already discussed that market structure have many points and by analysing those points one can easily identify the resistance support and highs and lows. And by using those highs and lows one can identify buying point and selling point and these buying point and selling points helps trader to maximizing profit and minimising risk of loss
So let's understand how to identify these points using market structure:-

Buy criteria or entry point:-
To maximize profit and minimize risk of loss, one should always buy any asset or enter into market when downtrend is going on. Because at this time the price of the asset is likely to be minimum and trader can earn maximum profit.
A higher low should be formed as it is the earliest sign of upcoming uptrend. If there is no any sign of upcoming uptrend then trader might have to wait for much time for this.
A bullish candle must be closed above the previous lower high indicating that resistance is broken down.
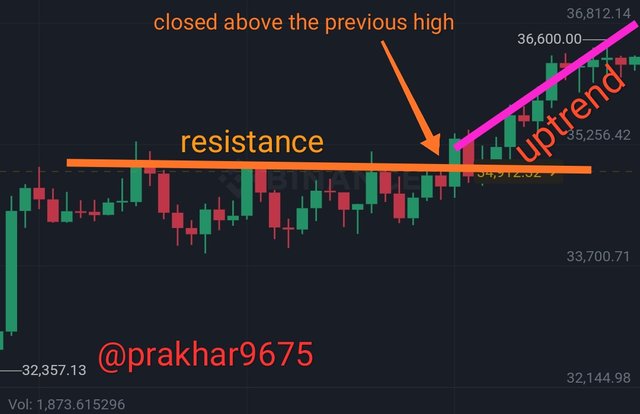
As you can see when all the conditions are fulfilled, there is high probability of upcoming uptrend and by buying asset at this time, a trader can maximize it's profit.

Sell or Exit point criteria:-
Market must be in a uptrend. Because at this time trader must be in a profit and ready to sell.
An earliest signal of upcoming downtrend which is lower high must be formed. Be this a trader can sell its asset at a highest price and can earn maximum profit.
A candle must be closed below the previous low and thus breaking the support.
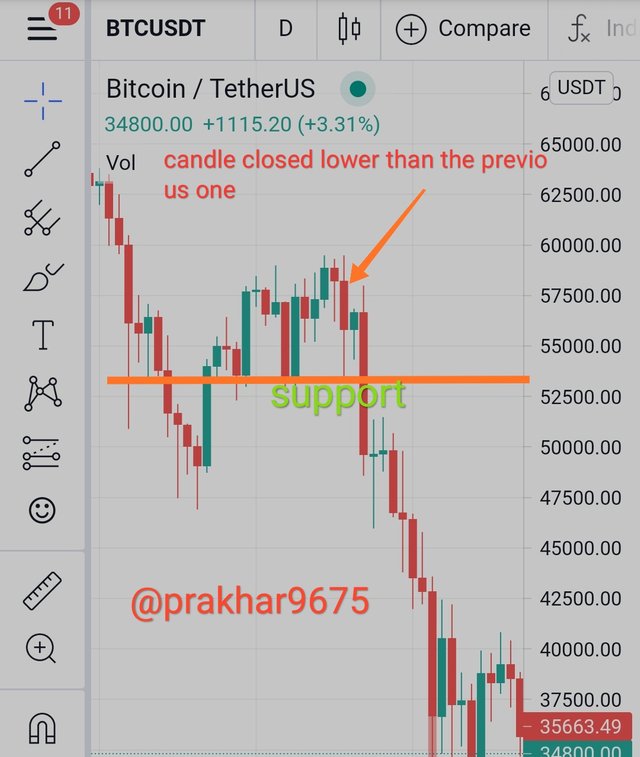
So you can see when condition are fulfilled, there was a downtrend and a seller by selling it's asset at that candle which was closed at a lower level than previous one, can earn maximum profit with low risk.
Other ways to maximize profit and minimize loss is using the stop loss order or OCO order. As we have already discussed these before so there is no point to discuss these again.
By using these types of orders one can maximize profits and if the price drops then minimize the loss.

Place 2 demo trades on crypto assets using Market Structure Break Strategy. You can use lower timeframe for these demo trades (Screenshots Needed)
Here I will place 2 demo trader. Here you can use any time frame. If you are a daily trader then you can use 30 min or 1 hours frame which is ideal for trading for short period.
If you are planning to hold for much time then using time frame more than 1 day is ideal.

Demo trade 1:-
XRP/USDT:- here in the below screenshot I am showing a price chart of XRP USDT pair. I am here going for a shorter period that is 1 hour because it is ideal for short term trading.
You can see all points that is buying point and selling point in the below screenshot
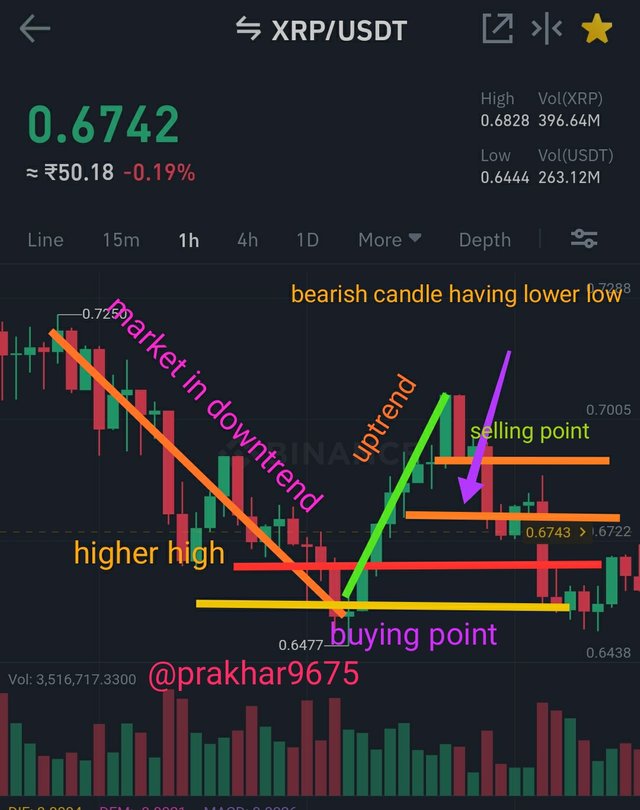
As you can see initially the market is in downtrend and suddenly a bullish candle which is higher than its previous counterpart, shows us that there is a upcoming uptrend.
At this point I will buy the asset. As all conditions are being fulfilled.
And then you can see there is a uptrend. And then suddenly a bearing candle having lower low than its previous counterpart.
And this point I will conclude this as a selling point. And as you can see that after this there is a downtrend and price of the asset drops.
And by buying at buying point and selling at selling point I can maximize my profit.

Another demo I am using that is LTC USDT pair:-
Here I am using 1 hour time frame because it is ideal for short period trading.
Here in the screenshot below you can see buying point
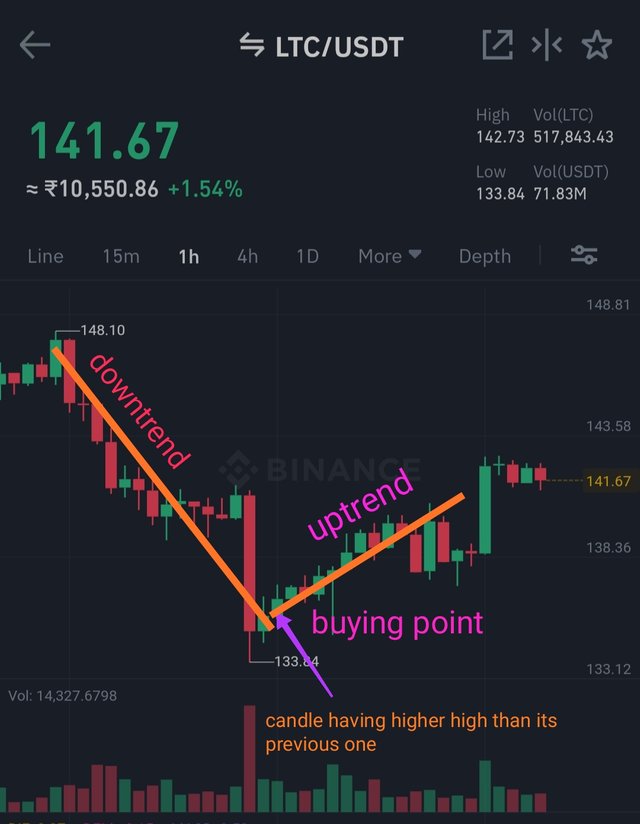
As you can see there is downtrend going on and a bullish candle is having higher high than its previous candle. Thus it is ideal condition for buying and thus it is a buying point.
And you can see there is a uptrend after this point.
Now you can see that there is a uptrend going on and there is a bearing candle having lower low than its previous one. And this is a sign of upcoming uptrend.
And thus it is a selling point.
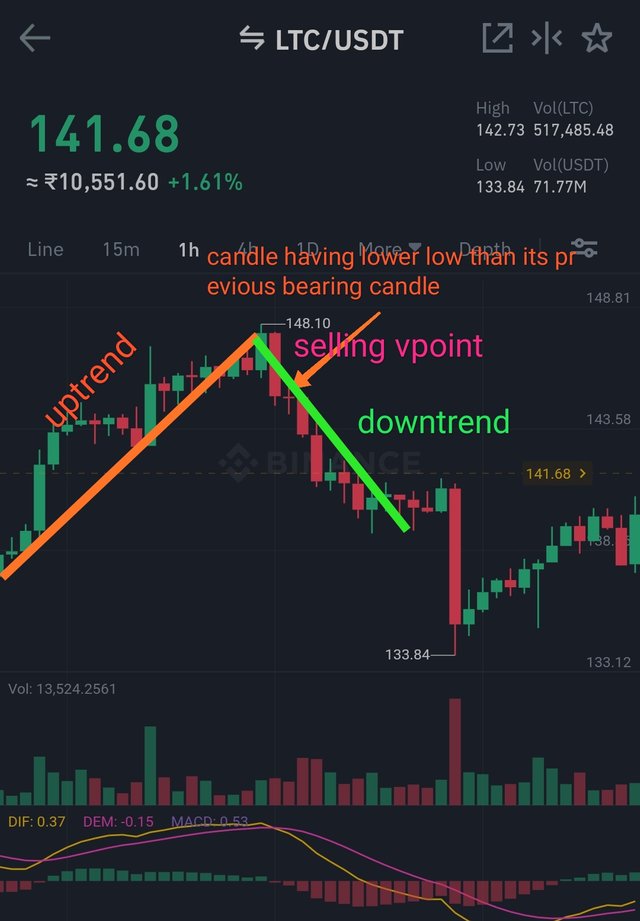
And you can see there is downtrend after this. Thus it is a ideal Condition for selling.
Now I hope you are understood how using market structure, one cab easily determine upcoming downtrend and uptrend and can sell and buy asset accordingly.
And by this can maximize profit. And can lower the risk of loss.
So that's all guys from my side.
I hope I was understood well.

.jpeg)