Hey everyone this is @prakhar9675 this side and this is a homework post for professor @sapwood.
So let's answer all the questions asked by the professor.

What is a HODL wave, how do you calculate the age of a coin(BTC, LTC) in a UTXO accounting structure? How do you interpret a HODL wave in Bull cycles
Before knowing about hodl wave, we have to know what is hodl. So hodl basically means hold which was misspelled earlier when a user wrote hodl instead of hold. So hodling means holding Crypto assets for a longer period to get profit rather than buying and selling those after some time.
Now let's discuss what is hodl wave. According to glassnode academy "Hodl wave is on-chain metrics which provides us a macro view of the age of a coin with respect to the total supply of that coin by using the different colour band for coins having different age." Source
So hodl wave categorizes the supply of an asset, based on the life span of that asset by using different colour bands in which hot colours are used for young coins and cold and coldest colours are used for representing mature and dormant coins respectively.
HODL wave is created when after a rally, an owner sells its asset at s higher price and that asset is sent to a new owner's wallet and that new owner keeps it in the wallet for a longer period after the price fell. And asset stayed there unmoved.
Now you might be wondering how we calculate the age of a coin. So the age of the coin is not calculated from the day it was mined by a miner, but it is calculated using the UTXO, which is an abbreviation for unspent account output. UTXO is the smallest amount of a coin that is left when the coin is moved from a wallet to another wallet. So basically when a coin is moved to another wallet, a UTXO is created, and ** based on that UTXO the age of the coin is determined.**
So in a nutshell we can say that the age of a coin is determined from the day when it is moved from a wallet to another wallet.
In the hodl wave, there are many colour schemes for representing the age of spent coins. In this colour scheme, there is hot colour lying at the bottom of the chart representing the coins having less age. These coins are called young coins.
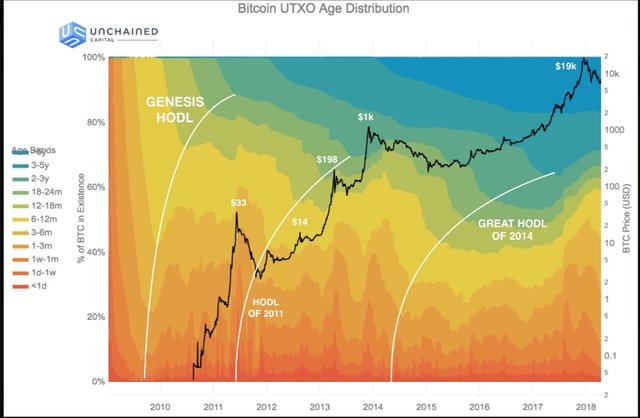
After this, some cool colour are used hanging in the middle of the chart. These coins are called mature coins
And above all, the coldest colour is found which represents the coins which aren't moved for a very long time. These coins are called dormant coins. Some of these coins might be lost coins which were mistakenly sent to the wrong address and now are lost.
HODL wave in Bullish Cycle and bearish cycle:-
As we have discussed that hodl wave shows us the age of the coin with respect to the total supply of the coin. And the hodl wave also put light on whether the coins are being accumulated or are being spent at a young age.
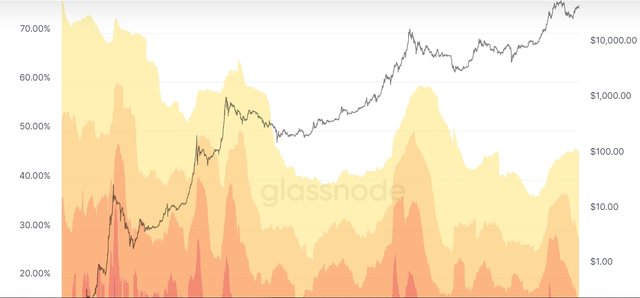
If you see closely by removing the cool colour bands, you can see that when the market was bearish, the area of the band having hot colour (coins in young age) is decreasing meaning that the young coins are converting to mature and mature coins are converting into dormant coins this also impact the demand-supply graph and it compelled the price of the coin to increase
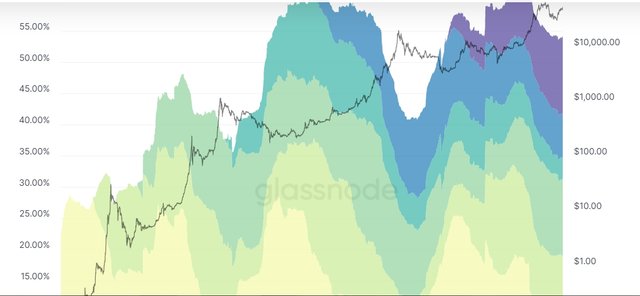
And when you see by removing the hot colour bands, you can observe that when the market is bullish, the area of bands having cool colour ( coins having mature age or dormant coins) is decreasing representing that these coins are converting into young coins and are now moving to a new Wallet creating a UTXO.
Conversely, we can determine the market cycle using the hodl wave.

Consider the on-chain metrics-- Daily Active Addresses, Transaction Volume, NVT, Exchange Flow Balance & Supply on Exchanges as a percentage of Total Supply, etc, from any reliable source(Santiment, Coinmetrics, etc), and create a fundamental analysis model for any crypto[create a model for both short-term(up to 3 months) & long-term(more than a year) & compare] and determine the price trend (or correlate the data with the price trend)w.r.t. the on-chain metrics? Examples/Analysis/Screenshot?
For on-chain metrics analysis, first of all, go to this websy and then
On the home page, click on network data section
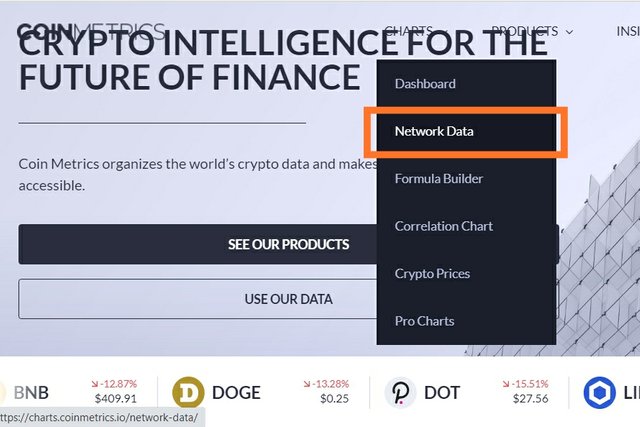
Now in the asset section, select your desirable asset. Here I am using ethereum rather than bitcoin which was set by default. I unselected bitcoin and selected ethereum.

Now in the metrics section, search and select your desirable metric.

Daily Active addresses
Daily Active addresses is an on-chain metrics that shows us the number of active addresses with respect to the change in the price of the asset.
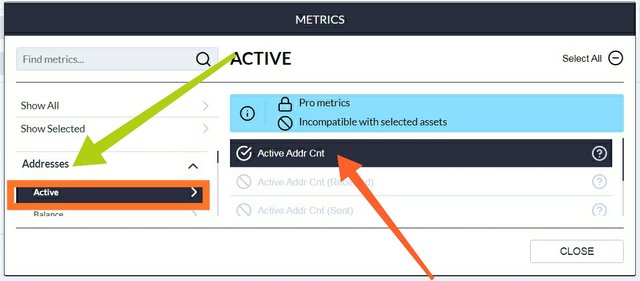
To add active account address metrics:-
- Click on metrics >> and then under addresses section click on active and then click on Active Addr Cnt. Or you can also search directly for Active Addr Cnt
Short term analysis of the relation between the number of active addresses and price of ethereum:-
| Date | Number of active addresses | price of ethereum in USD |
|---|---|---|
| 12 June 2021 | 692.247 k | 2380.84 |
| 28 June | 821.105 k | 2079.278 |
| 27 July | 734.086 k | 2286.229 |
| 27 August | 484.938 k | 3270.013 |
| 3 September | 512.274 k | 3918.583 |
From this table, we can conclude that when the number of active addresses increased from 692.247 k on 12 June to 821.105k on 28 June, the price of the asset that is ethereum decreased from 2380.84 to 2079.278.
Similarly, when the number of active addresses decreased from 821k to 734k on 27 July, the price of ethereum increased from 2079.278 to 2286.229 USD.
Now it's looking like when the number of active addresses decreases, the price of the asset increases and vice versa, but if you now observe the next period you will find,
During the period from 27 August to 3 September, the number of active addresses increased but at the same time, rather than decreasing ethereum price increased to 3918.583 from 3270.013
So by short period observation of relation of the number of active addresses and price of the asset isn't clear.
Long term analysis of price change with change in the number of active addresses
| Date | number of active addresses | price in USD |
|---|---|---|
| 16 Jan 2018 | 735.111 k | 1061.187 |
| 19 March 2018 | 356.019 k | 550.1382 |
| 28 March 2021 | 574.675 | 1685.163 |
| 25 April 2021 | 905.234 k | 2300.557 |
On the data available here we can observe that when the number of active addresses decreased from 735.111 to 356.019, the price of the asset also decreased from 1061.187 to 550.1382 USD.
Similarly, when the number of active addresses increased from 574.675 to 905.234, the price also increased from 1685.163 to 2300.557 USD.
Thus we can conclude that, even if the relation between the number of active addresses and price of the asset is unclear in short term analysis, it is quite clear in long term analysis which signals that:- with the increase in the number of active addresses, the price of the asset also increases and vice versa.

NVT
NVT is an on-chain metrics which is an abbreviation for network volume to transaction. It is also called the PE ratio. It shows the relation between the market capitalization of an asset and the transaction volume of that asset on a particular day.
It can be formulated as
| NVT= market capitalization / transaction volume of the asset on a particular day |
|---|
Now NVT signifies whether the asset is overvalued or undervalued. It is usually used with other on-chain metrics to get a clearer picture.
Increasing NVT value signifies that transaction volume is decreasing and people and it shows the accumulation of the asset. And this led to the price increase. Thus increasing NVT indicates that asset is overvalued
Similarly decreasing NVT signifies that asset is undervalued. And a price increase might take place.
Short term NVT analysis
| Date | NVT | price of ethereum |
|---|---|---|
| 14 June 2021 | 36.50383 | 2577.045 |
| 16 July 2021 | 28.10255 | 1878.108 |
| 7 August 2021 | 45.49673 | 3143.38 |
So you can see, when NVT was 36.50, as discussed, the price dropped as an asset was overpriced. And price dropped from 2577.045 to 1878.108 USD.
Similarly when NVT was less, then asset being undervalued, it's the price was increased to 3143.43 USD with NVT 45.49
Long term NVT analysis:-
| Date | NVT |
|---|---|
| 28 January 2020 | 91.88051 |
| 11 May 2021 | 19.082 |

As you can see initially when the transaction volume of ethereum was less, its NVT was as high as 91.88051 but with the increasing use of ethereum its market capitalization has increased manifolds, but with this, its Transaction volume also has increased much more than this, this is revealed by this fact that when ethereum reached as high as 4155.772 USD, it's NVT was 19.0823 because of increased transaction volume.

Exchange outflow Native Unit
Exchange outflow Native Unit on-chain metrics shows us the data of how many units of an asset are withdrawn from exchanges. And this also has a very significant relationship with the price movement of the asset.
Short term analysis of exchange outflow Native Unit:-
| Date | withdrawn unit | price |
|---|---|---|
| 8 July 2021 | 783.0151 k | 2118.924 |
| 11 July 2021 | 94.1800k | 2140.193 |
| 26 July 2021 | 557.402 k | 2241.159 |
| 8 August | 242 k | 3027 |
Here from the data, we can conclude that when exchange outflow was high at 783 k units, the price of the asset was high and when exchange outflow decreased to 94.18 k units, the price was nearly constant at 2140.193
But when on 26th July, when exchange outflow was 557.42 k units the price also increased to 2241.159 USD.
But at the same time when exchange outflow was 242 k units, the price still increased to 3027 USD.
Thus the relation between exchange outflow Native Unit and price movement is still not clear in short-term analysis.
Long term analysis of exchange outflow Native Unit
Here in long-term analysis, we can see that in September 2017 the price of the ethereum was at 263.5925 USD and the exchange outflow was 239.8088 units.
But when this exchange outflow was increased to 485.2047 k units in February 2020, the price of ethereum also increased to 283.565 USD.
And when in May 2021, when exchange outflow was at a very high point with 1.3926 million units, the price of ethereum also increased to 2535.736 USD.

Thus we can conclude that with the increase in the exchange outflow Native Unit, the price of the asset is also increased and the price is decreased with the decrease in the exchange outflow Native Unit.

Netflow of the asset on exchange in USD value.
Similar to the exchange outflow Native Unit, Netflow of assets in USD also has a significant impact on the price movement of an asset. Now using on-chain metrics let's find out the significance of this.
Short term analysis of Netflow of the asset on exchange


As you can see on June 4th, Netflow of the asset was +1.520 billion USD. And at that time the price of the asset was 2689 USD.
But when the withdrawn worth of ethereum was dropped and the Netflow of the asset was -0.5 billion USD, the price of the asset was dropped to 1867 USD on June 22nd.
Long term analysis of Netflow of the asset in USD:-
In this analysis, using on-chain data we can see that in August 2020, a total of 127.6617 million USD worth of ethereum was deposited and at the same time 70.42 million worth of ethereum was withdrawn from the exchanges so Netflow was around -57.24 million USD and at the same time, the price of the ethereum was 220.55 USD.

But when in May 2021, the Netflow reached +0.863 billion USD with 1.947 billion worth of ethereum deposited and 2.8113 billion worth of ethereum withdrawn, the price of ethereum reached 3280.03 USD.


Are the on-chain metrics that you have chosen helpful for short-term or medium-term or long term(or all)? Are they explicit w.r.t price action? What are its limitations? Examples/Screenshot?
On-chain metrics is a new concept that helps in analyzing an asset fundamentally. It provides all historical data of an asset in a very detailed manner where you can see data of every day how many native Units of an asset were withdrawn or deposited in an exchange and how much worth of asset was deposited or withdrawn from an exchange. Other than this how many active accounts were there on a particular date. And you can use all these things In combination and for two or more assets together.
The main purpose of these on-chain metrics is to provide public data more efficiently to the general public for fundamental analysis.
Now not every on-chain metrics is efficient and useful and also many on-chain metrics are useful for a particular period.
For example, here we saw that the relation between the number of active addresses and the price of the asset was unclear in a short period. But it was quite clear while the long-term analysis.
Similarly, NVT on-chain metrics didn't provide a clear picture of price movement In short-term analysis. We should use it for long-term analysis. But still using it with other on-chain metrics is useful while using it alone is not efficient. And it can also be manipulated with any new coin with low Market capitalization and high circulation supply. This will make it look like it has low NVT and the asset is undervalued.
Similarly, the Netflow of assets in USD and outflow Native Unit also provides significant information about price movement but these on-chain metrics are also useful for long-term analysis.
And the biggest limitation of these on-chain metrics is that it is not useful for scalp Trading where trader trade for a very short period. It is useful for investing money for a very long time.

Conclusion
As we know that on-chain metrics are developed especially for Crypto assets and these are very useful for fundamental analysis of Crypto assets. But as we saw in this task, not every on-chain metrics are not useful for determining price variation such as NVT and outflow Native Unit of an asset. But these on-chain metrics are useful for fundamental analysis to watch all historical data of any asset here.
But as of now only Major crypto assets such as bitcoin, ethereum, LTC supports on-chain metrics. But soon enough we will be able to see on-chain metrics of more assets. And this will take the crypto world to a new whole level.
So that's all from my side. Hope I was well understood.

Cc
@sapwood

@tipu curate
Downvoting a post can decrease pending rewards and make it less visible. Common reasons:
Submit
Upvoted 👌 (Mana: 4/5) Get profit votes with @tipU :)
Downvoting a post can decrease pending rewards and make it less visible. Common reasons:
Submit
One of the good post bro.
So lengthy i appreciate to your hardwork 💛💖
#affable
#india
Downvoting a post can decrease pending rewards and make it less visible. Common reasons:
Submit