
Hello Steemians, I welcome y’all to my homework post for the week 2, Season 6 of the Steemit Crypto Academy. This is a homework post for Professor @imagen on “Double Top and Wedge Trading”.
Here's my entry below.........

1.) Explain in your own words the concept of Double Top, Double Bottom and Wedges. How to interpret each one?

Double Top
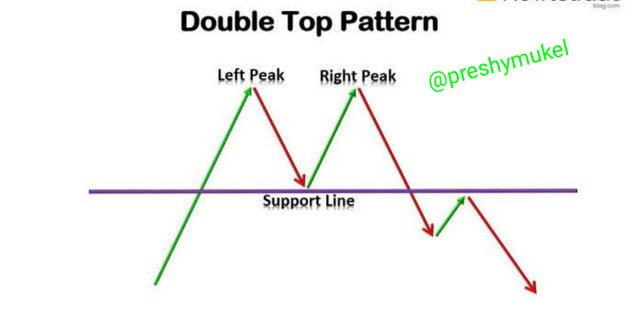
A double top is a pattern formed at the top of a bullish trend after which a bearish reversal will follow. It is identified as a two high peaks at the top of a bullish trend which is characterized as a “M” pattern. The formation of the “M” pattern is often an indication of a bearish trend. When a double top is formed, the second top peak formed is usually a bit below the first top peak showing a resistance level.
A double top appears when the buyers are exhausted and can not push the price of the market further, at the point the seller are taking over the market.
Source
The pattern above is a double top pattern. The simple interpretation of this pattern is; the price was on a bullish trend meaning the buyers were in charge of the market, then the first top peak appeared and there was a momentum downward, then the price hit a support level then went back to retrace the first top peak formed, the price then started dropping again but this time it broke the support level and continue with the downtrend, the sellers are in charge of the market at this point.
Double Bottom
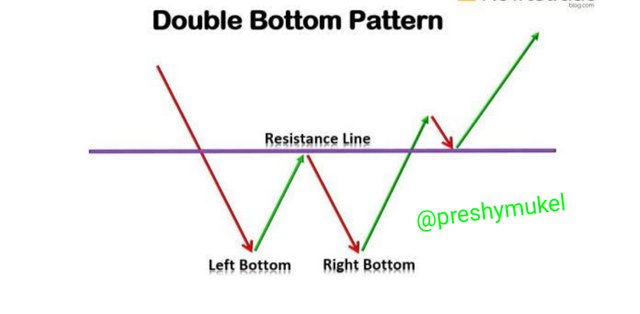
The double bottom is a pattern which consist of two lows formed at the bottom of a bearish trend, it is actually the reverse of double top. The appearance of a double bottom pattern indicates a bullish reversal an it is characterized with by the letter “M”.
The double bottom forms to create a support level where price can not continue moving downward after hitting a support and therefore it reverse to an upward trend where it will break a resistance level and continue with the trend.
The double bottom is where sellers losses their strength in the market and buyers takes over the control of the market.
Source
The above pattern is an example of a double bottom pattern. The explanation to that pattern is that; sellers were in charge of the market, then the first bottom low appeared and the price went up, hit a resistance level and then return back to retrace the first double bottom low formed and then the price goes up again and continued in the uptrend. Buyers took over the market from sellers at this point.
Wedges
Wedges is a reversal pattern that indicates bullish and bearish price reversals and it is marked by two converging trend lines on a chart, these lines are then drawn connecting the highs and lows respectively of a price series over a certain period. The trend lines gives a clear understanding of the trend of the highs and lows, if they're falling or rising.
Wedges are of two types; the** Rising wedge** and the ** Falling wedge**.
Rising wedge:
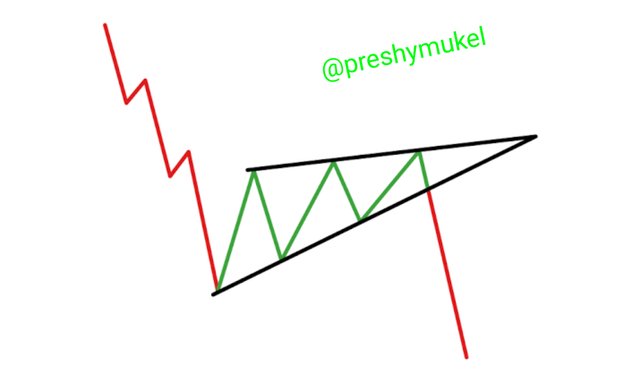
The rising wedge occurs when a price has been rising for a period of time, it can also occur during a downtrend. During a downward trend the rising wedge is characterized with two trend lines converging upward then a break occurs in price and the price continues in it's downtrend.
The formation of a rising wedge is characterized with a falling price potential after a breakout which occurs at the lower trend line. The appearance of a rising wedge alerts traders to make bearish trades. Below is an example.
Source
Falling wedge
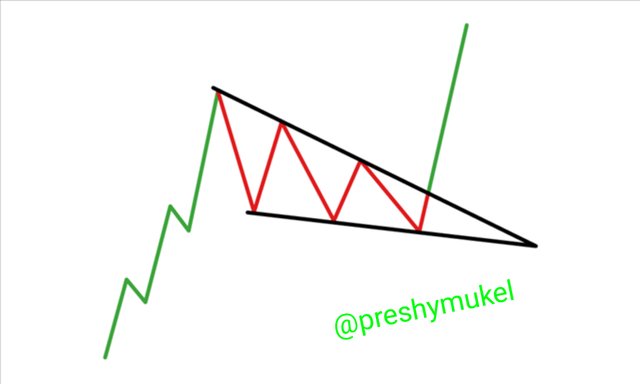
A falling wedge is the opposite of the rising wedge. It occurs in a bullish trend, where The price of an asset has been rising, the falling wedge then forms to show a descending trend lines converging downwards, afterwards a break occurs and the price continues in it's uptrend. Below is an example.
Source

2.) Main differences between the Double Top and the Double Bottom. Show screenshots.

| Double Top | Double Bottom |
|---|---|
| 1. Double top is a bearish reversal pattern. | 1. Double bottom is a bullish reversal pattern. |
| 2. It is formed at the top of a bullish trend. | 2. It is formed at the bottom of a bearish trend. |
| 3. The double top is described to have two high peaks formed at the top of a bullish trend, these two peaks forms creating a neckline below, the two high peaks at the top creates a resistance level while the neckline forms a support level. | 3. The double bottom forms two lows at the bottom of a bearish trend with a neckline above, the two lows formed below creates a support level while the neckline above creates a resistance level. |
| 4. It is usually identified with the letter “M”. | 4. It is usually identified with the letter “W”. |
| 5. The formation of a double top indicates bulls taking control of the market. | 5. Here bears are taking control of the market. |
| 6. The appearance of a double top on a chart signal traders to enter a short position. | 6. The appearance of a double bottom signals traders to enter a long position. |
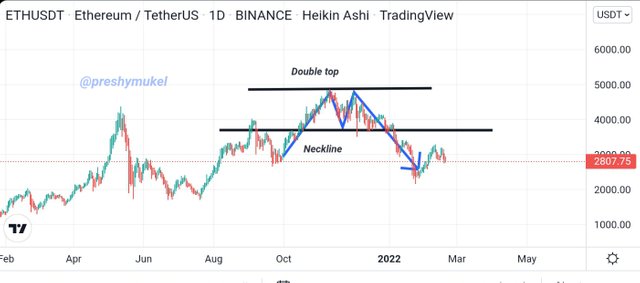
Example of a double top on a chart TradingView.com
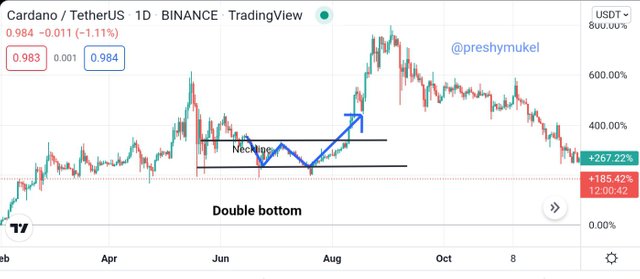
Example of a double bottom on a chart TradingView.com

3.) Explain and highlight the main differences between a bullish wedge and a bearish wedge. Show screenshots of each.

| Bullish Wedge | Bearish Wedge |
|---|---|
| 1. A bullish wedge is an ascending pattern that usually appears in a downtrend. | 1. A bearish wedge is a descending pattern that appears usually during an upward market trend. |
| 2. The bullish wedge is characterized with a price falling potential. | 2. The bearish wedge is characterized with a price rising potential. |
| 3. The bullish wedge consist of two trend lines converging upwards. | 3. The bearish wedge consist of two trend lines converging downwards. |
| 4. Bullish wedge is like a pause during a bearish trend after which a break occurs at the lower trend line and the bearish trend will continue. | The bearish wedge is like a pause during bullish market trend after which the upper trend line will break and the bullish trend will continue. |
| 5. After a bullish wedge comes a bearish trend signalling traders to enter a short position. | 5. After a bearish wedge comes a bullish trend signalling traders to enter a long position. |
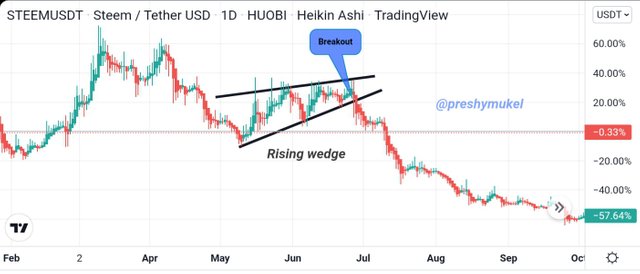
Example of a bullish wedge on a chart TradingView.com
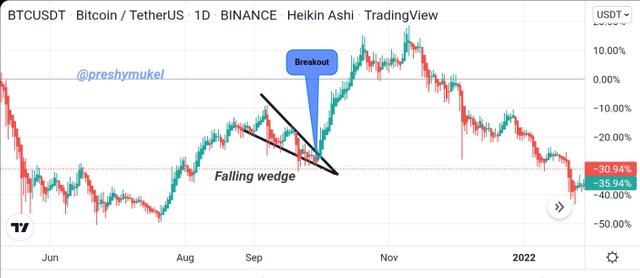
Example of a bearish wedge on a chart TradingView.com

4.) Explain the volatility that usually exists with respect to the volume in the wedges. When is there usually more volume? What happens if a pullback breaks the support of a wedge?

Wedges forms when the current market controllers are exhausted, a corresponding wedge will be formed, for example if the bulls are the one controlling the market and they get exhausted a bearish wedge will be formed which gives the bulls a break to probably go reenforce and return back to the market reassuming their position. When a bullishwedge is formed the price volumes drops leading to low volatility in the market. The reverse will be the case when a bearish wedge is formed, the market volume will be high.
Take the bullish wedge pattern on the chart below for example;
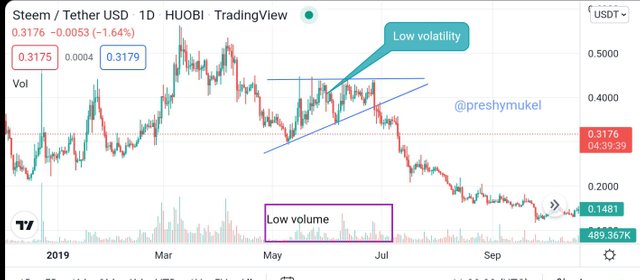 TradingView.com
From the chart above it can be noticed that when the bullish wedge was formed, the market volume and volatility was affected making it to be low. This means that during a bullish wedge formation, the market volume and volatility goes down.
If a pullback breaks the support of a wedge, there will be continuous bearish trend which could be a result of strong selling power i.e more open sell orders in the market or it could be as a result of market manipulations.

5.) Find and analyze the double top pattern on at least 2 charts. Show your own screenshots.


ETH/USDT Chart TradingView.com
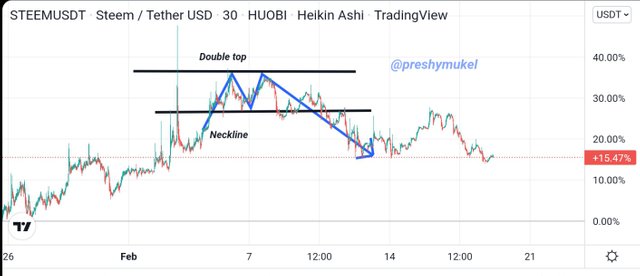
Steem/USDT chart TradingView.com
Here I'll be using the ETH/USDT and Steem/USDT pairs to analyze the double top pattern. As mentioned from the previous explanation, a double top is formed at the top of of an uptrend and from the chart above it can be observered that I was able to spot out my double top which consist of two peaks at the top of an uptrend, I was also able to identify the neckline as seen on the chart.
After the formation of the first top peak there was a momentum downwards making the price to hit a support level, on hitting the support level the price went back to retrace the first top peak which led to the formation of the second top peak. The price then start dropping again but this time the price on reaching the support level it broke it ( ETH/USDT broke the support level at $3800 while Steem/USDT broke the support level at 28) and the prices continued on a downtrend.
At this point a bearish reversal has taken place. From the chart a short position can be seen at the breakout point.

6.) Find and analyze at least 2 rising wedges and 2 falling wedges on at least 2 charts. Show your own screenshots.

Rising wedges
I'll be using the Steem/USDT and ADA/USDT in analyzing of the rising wedges.

Steem/USDT Chart TradingView.com
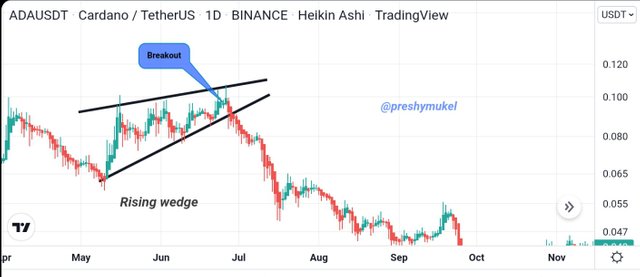
ADA/USDT chart TradingView.com
From the charts above, we can see the rising wedge on the two charts. As earlier explained, the previous market before the formation of a rising wedge is usually a bearish trend. The rising wedge is formed when a bullish reversal occur, and at the end of the rising wedge formation a breakout occurs at the lower trend line which cause the trend to go back to it's previous trend (bearish trend) before the formation of the rising wedge. At this point traders can enter a short position in the market.
Falling wedges
I'll be using the BTC/USDT and ETH/USDT in analyzing of the rising wedges.

BTC/USDT chart TradingView.com
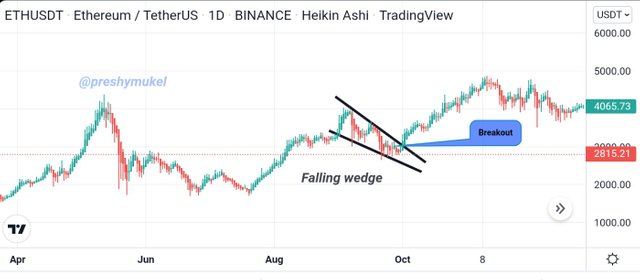
ETH/USDT chart TradingView.com
From the charts above, we can see the falling wedge on the two charts. As earlier explained, the previous market before the formation of a falling wedge is usually a bullish trend. The rising wedge is formed when a bearish reversal occur, and at the end of the falling wedge formation a breakout occurs at the upper trend line which cause the trend to go back to it's previous trend (bullish trend) before the formation of the falling wedge. At this point traders can enter a long position in the market.

7.) Importance of patterns in technical trading.

Patterns are formations that occurs on assets charts. There are different chart patterns used during technical analysis and these chart patterns plays a greats role in the identification of price trends during technical analysis. Chart patterns are really important especially for traders and investors who are really capitalizing on price trends of assets inorder to trade and make profit. Examples of chart patterns includes; double top, double bottom, wedges, head and shoulder pattern etc.
Recognizing patterns help traders gain advantage in the market as the use of patterns increases traders chances of profiting from the market.
Patterns can be used to determine the market volatility and volume.
Patterns are important for technical trading because patterns have predictive values, i.e they can be used to forecast the future price movement of an asset.
Pattern define trends on a chart and make them clear for technical traders inorder for them to be able to identify price movement characteristics which help them to take trading decisions.
Patterns shows accurate signals therefore with patterns traders can spot exits and entries positions.
Patterns help trader to spot points of resistance and support levels so as to be able to identify reversals points.
With the use of chart traders can easily know the emotional and psychological behavior of traders in the market.

8.) Do you find it effective to use these patterns in trading? Justify your answer.

Patterns are very important keys in technical analysis, some of these importance are stated above.
I know that these patterns are very effective tools for technical trading because over the years, I trade based on the signals I get from these patterns and I've been getting good returns and I recommend the use of patterns to every trader.
These patterns can only be ineffective when they're wrongly read and interpreted that is why it is advised for traders ty combine suitable indicators that works perfectly together during their technical analysis inorder to confirm their signals and make a good trading decision.
It is highly recommended that every traders learn and know how to read and interpret patterns correctly to avoid losses during trading as these patterns can help minimize losses.

Conclusion

Patterns are very essential tools in technical trading and therefore it is good for every traders to get acquainted with these patterns because the success rate of a traders lies in the ability of a trader to be able to read patterns, spot signals and be able to enter a trade using these spotted signals.
The chart patterns discussed in this post, the double top, double bottom and wedges are reliable patterns.
But for beginners it will be advised you practice using these patterns with a demo account to get perfect before going into real trades with these patterns to avoid losses.
Thanks @imagen for the wonderful lecture.
Downvoting a post can decrease pending rewards and make it less visible. Common reasons:
Submit
Hello @preshymukel, please change your tag to #imagen-s6week2 to prevent @imagen from skipping your post. The translator changes "imagen" to "image." Do take note next time.
Downvoting a post can decrease pending rewards and make it less visible. Common reasons:
Submit
Thanks dear. I really appreciate.
Downvoting a post can decrease pending rewards and make it less visible. Common reasons:
Submit
You're welcome.
Downvoting a post can decrease pending rewards and make it less visible. Common reasons:
Submit
Gracias por participar en la Sexta Temporada de la Steemit Crypto Academy.
Espero seguir corrigiendo tus futuras asignaciones, un saludo.
Downvoting a post can decrease pending rewards and make it less visible. Common reasons:
Submit
@tipu curate
Downvoting a post can decrease pending rewards and make it less visible. Common reasons:
Submit
Upvoted 👌 (Mana: 1/6) Get profit votes with @tipU :)
Downvoting a post can decrease pending rewards and make it less visible. Common reasons:
Submit