Understanding Leverage Trading
In the crypto domain, trading is one of the possible means whereby we don't take permission before embarking on it. That's it's permissionless as such everyone can participate in it anytime and anywhere. However, each individual has all it takes to open more than one trade regardless of their account size (portfolio). So, it means the account size might be small but the user can open an order depending on the desired leverage.
Generally, in the crypto sphere leverage trading is one of the greatly important tools traders and investors have in their crypto toolbox to increase returns. However, before I proceed further let me share a quote from an American business magnate, investor, and philanthropist known as Warren Buffett which said that
“When you combine ignorance and leverage, you get some pretty interesting results.”said by Warren Buffett
I know most people might be surprised by this quote, while the reason this quote reverberates is that in the right hands, leveraged trading can expand your returns dramatically but in the wrong hands, it can have a decreased effect on both your capital and psychology. It is a well-known validity in the domain of crypto trading that the higher the reward a user seek, the higher the risks associated with it. Perhaps, leveraged trading, which is used in the crypto market, as it is realized, is a very risky strategy to apply without the right understanding and experience required to deal with the highs and lows that are common with this form of trading.
Note that there's no limit to the number of trades you can obtain no course of your portfolio. I believe we have understood the synopsis of leveraged trading. Let's check out what it means for better understanding.
The word leveraged trading, most times can be referred to as margin trading, however, it authorizes a user to open a trading position either long or short with a broker or exchange platform using a small amount of capital(margin) to obtain a much bigger position in the market.
For example, suppose a trader has a $1,000, the trader can leverage their trading position up to 100x or more. So, if the leveraged is at 100 to 1, it means the trader is jeopardized to managing a position of $100,000 in the market.
Honestly, this serves as a huge benefit for the user to make more returns trading crypto assets with small capital when their forecast is right. However, it also has a disadvantage when the market goes against your forecast when using leveraged trading, as such can cause liquidation. This means when trading with leveraged trading, your account might be exposed to the risk of liquidation if you don't extra funds to replace your losses.
With this effect, it is not ideal for a novice when it comes to technical analysis to make use of leveraged trading. It is only meant for savvy traders and investors who knows technical analysis and can withstand the shock of the losses as well.
In the trading system with leveraged trading, to maximise your returns and minimise losses in the affairs of trading, it requires good risk management regardless of your status (savvy & amateur).
Benefits of Leveraged Trading
Understanding the benefit of leveraged trading is very important since it increases returns. For those that want to start trading with leverage, below are the benefits let's check it out.
- Trading with leveraged is another incredibly attractive option in the trading domain that authorised traders or investors to maximise potential profits very fast within a short timeframe. Some traders especially spot traders doesn't take advantage to obtain big returns as a result of low funds on their exchange platform. However, trading with leveraged has a great tendency to increase the returns of traders with small low funds. Savvy scalpers can make use of leverage trading systems to obtain huge profits within a short timeframe.
- Trading with leveraged enable traders to obtain more purchasing influence with small capital. It gives a trader the power to purchase assets 200× their trading capital. That's a trader with $20 capital on the exchange platform can open a trade position worth $2000.
- Trading with leverages also permits traders to open and manage many trade positions when it whipsaws in profit or a loss. The trader can close their position by breaking even ( close partially) either when in profit or loss without closing the position entirely. With this, it protects our account most especially when the market is against us as such help to protect against the risk of liquidation. This is the power of leverage believe me in the spot this can not happen.
Disadvantages of Leveraged Trading
We have discussed the benefits of trading with leverage, However, there are always two viewpoints to a story and you need to contemplate the risks behind leveraged trading because when it goes against our forecast it results in losses of funds. So, let's check it out.
- Leveraged trading is prone to risk in the affairs of trading. Just as it allows traders to fast track their potential profits within a short timeframe, it can also cause the trader to lose the entirety of their funds when the market goes against us. Most times when proper risk management is not obtained, it can result in the risk of liquidation. Remember, every position opened here, is already exposed to liquidation, so, the tendency of the risk here is very high which is one of the disadvantages of leveraged trading.
- Leveraged trading requires only savvy traders who interpret and understand technical analysis and risk management. So it means it's not for the novice and it doesn't consider how big and small your account size is you must have a good knowledge of analysing the Future price action of the market rightly. This shows that trading with leverage needs only savvy traders or investors.
What are the Basic Indicators that we can use for Leverage Trading? (Need brief details for any essential Indicators and their purposes)
Generally, cryptocurrency possesses a high tendency of volatility, as such made trading full of risk but the one of leverage is riskier. With this effect, it is ideal for the trader to be well savvy before making trade decisions to avoid losses. However, before a position is opened, the user has to make some technical analysis to determine the future price action. In most cases, it is ideal to picture out the trend of the market before making any trade decision.
When the trend is identified, there are lots of buy and sell signals and opportunities pictured out on the trend. To spot trends, we need some vital technical tools as well as the technical indicators such as SuperTrend, Exponential moving average (EMA), Parabolic SAR, Moving average convergence divergence(MACD), etc.
Exponential Moving Average (EMA)
IMAGE SHOWING THE NATURE OF EMA
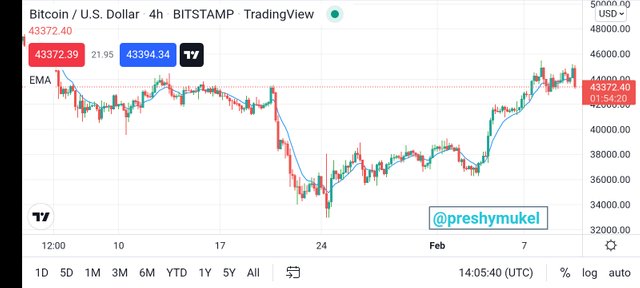
An exponential moving average (EMA) is one of the moving average(MA) technical indicator types of moving average (MA) that can be used in leverage trading to picture out trends in the market. However, the EMA was created to respond more significantly to the current changes over a certain period of the asset price than a simple moving average (SMA), as such it has served as a remedy to the gap in the simple moving average.
Generally, the EMA is reacted very fast to the recent price than the SMA as such can be used to picture out potential trends in the market. However, when the asset price is trading below the EMA, it presents a bearish trend as such it creates an opportunity for traders to identify a sell position. On the other hand, when the asset price is trading above the EMA, it provides signals of a bullish trend as such create an opportunity for traders to identify a buy position.
Moreover, this technical indicator can also create buy and sell signals based on crossovers and divergences. Perhaps if the crossing over of the EMA indicator line is above and below the asset price indicates a trend reversal in the market which can either be a bullish or bearish trend.
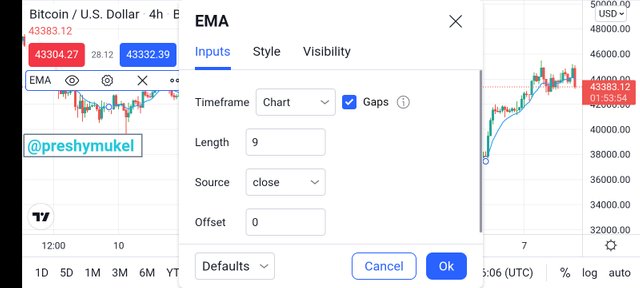
Using the EMA for leveraged trading strategy, I will be setting the EMA with 50 periods. This will be set in the price data points over the last 50 days. Remember, the entire configuration of the EMA can be adjusted depending on the choice of the trader. The image below shows the setting of the EMA in thetradingview.
IMAGE SHOWING THE SETTING OF EMA
Parabolic SAR
IMAGE SHOWING THE NATURE OF PARABOLIC SAR
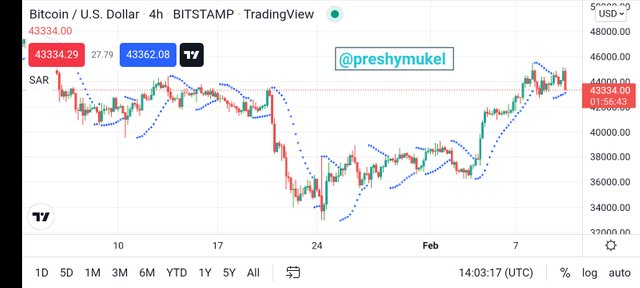
The Parabolic SAR is another technical indicator to spot the market direction as well as to detect possible reversal. However, this indicator was created by J. Welles Wilder, and it is used by the traders to picture out buy and sell signals in the market and to spot potential reversals in the price movement as well.
Generally, the Parabolic SAR is usually symbolized graphically in the chart of an asset as a dots which changes over a certain period with the asset price movement. However, when these dots are placed above the asset price, it signals a bearish trend and it is considered to be a sell signal. Conversely, when the dots whipsaw below the asset price, it indicates that the trend of the asset at that timeframe is observing a bullish trend and signals a buy to the traders.
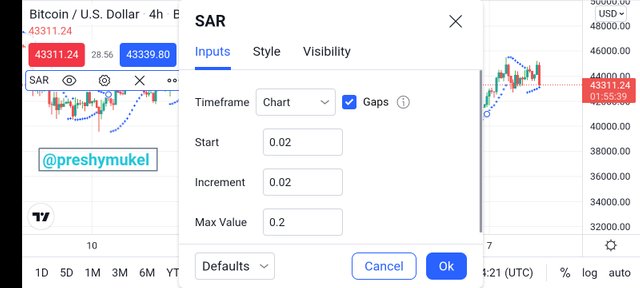
Note that when the dots switch either from bullish to bearish or bearish to bullish it indicates a potential trend reversal signal. The image below illustrates the setting of the Parabolic SAR using the tradingview.
IMAGE SHOWING THE SETTING OF PARABOLIC SAR
Relative Strength Index
IMAGE SHOWING THE NATURE OF RSI
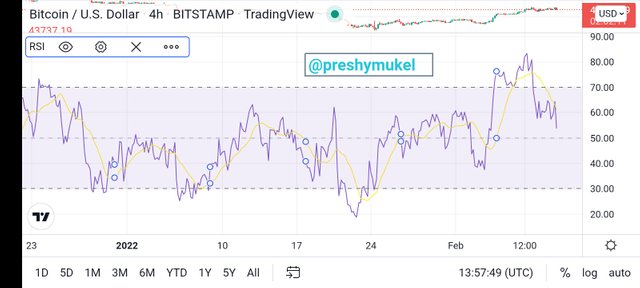
The RSI is oscillation-based technical indicator used to locate overbought and oversold areas, and helpful for sighting price reversals, as such, we can use it as a means of confirmation for both parabolic SAR and EMA. However, RSI locates overbought and oversold regions by moving up and down within a range of 0 to 100, with 0 defining the most oversold area whereas 100 defining the most overbought areas.
Moreover, when the RSI reaches an overbought condition which is above 70, it indicates drawback and exhaustion in the recent uptrend. This sometimes means the transition of Price reversal at that level. Conversely, when the RSI reaches the oversold condition which is below the 30 oscillating lines, it reveals drawbacks and exhaustion in the recent downtrend. This sometimes means the transition of Price reversal at that level.
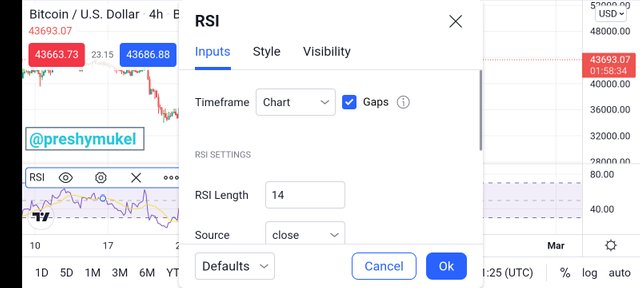
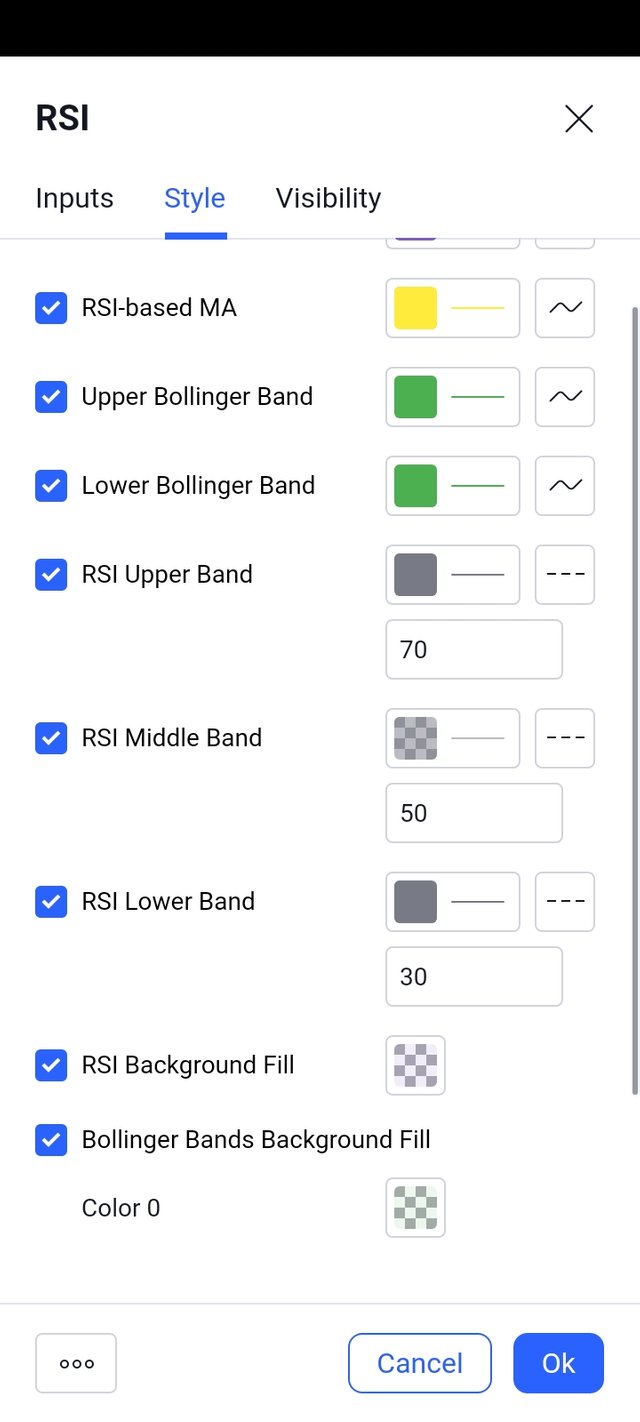
Since leveraged trading is full of risky, it's perfect to make use of the RSI information combined with the Parabolic Sar and the EMA to spot buy and sell trade positions. Below shows the RSI settings.
IMAGE SHOWING THE SETTING OF RSI
Buy Position Strategy
In this strategy, we will be using the 3 basic indicators which are EMA, RSI, and Parabolic SAR. However, to obtain this we have to follow the direction of the trend as such we have to focus on the EMA for trend direction. Here, the asset price is trading above the EMA, which implies a bullish trend and we can see potential buying opportunities. So, once we observe this, it means buying position should be assumed by the trader.
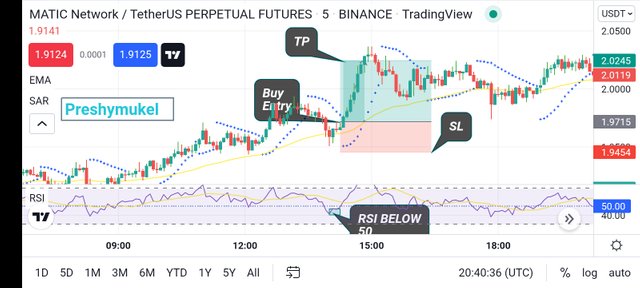
After which we will focus on the Parabolic SAR indicator, which entails that when the Dots are below the price level, it implies a bullish direction and here, we only focus on the Buy position. Thus, for confirmation, we will make use of the RSI indicator. Here, we can confirm the buy position only when the RSI is below the midpoint line Below 50. Let's check the crypto chart below for a better understanding. Remember, before making a buy decision, the 3 indicators must be in agreement.
From the crypto chart below, we have identified a potential buy trade strategy on DASH/USDT chart. Here, we can asset price is trading above the 50 EMA which indicates a bullish trend. And the Dots(Parabolic SAR) are trading below the asset price which is another possible buy trade signal. To confirm the buy trade strategy, we have to review the RSI and observed if it is below 50. Once, we observed it has passed the 50 oscillating lines, it shows a good confirmation for the Buy position.
Remember, the market can reverse against the buy trade, thus we have to place a stop loss. However, the stop loss has to be below 50. Also, the take profits which is another vital criteria for the buy position and can be placed above the Dots.
IMAGE SHOWING BUY POSITION STRATEGY
Sell Position Strategy
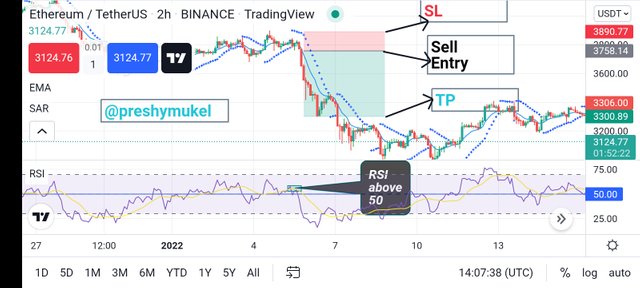
Here, the strategy is different from the buy trade strategy. In this strategy, we can take a sell position when the parabolic SAR (Dots) and 50 EMA is above the asset price. For confirmation, the RSI should agree with the SAR and EMA. And this can be seen when the RSI is above 50.
Let's check out the chart below, we can see the dots and EMA are seen trading above price. And, the RSI is above 50 of the oscillating line which confirms the sell position. As such, Stop-loss is placed below the 50 EMA whereas take profit is below the Dots.
IMAGE SHOWING SELL POSITION STRATEGY
Performing a Real Leveraged Trading
To perform real leveraged trading, first, we have to make a technical analysis on a crypto pair with the conjunction of the basic indicators explained in this post. However, this analysis will be carried out on Tradingview.com before placing it on Binance exchange perform.
SAND/USDT: 5 minutes Chart
IMAGE SHOWING THE SELL POSITION OF SAND/USDT
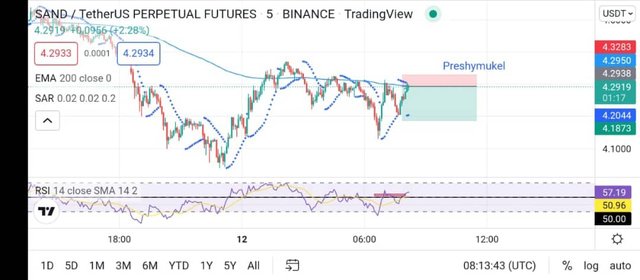
From the chart above, I observed that the 200 EMA is trading above the price movement which signals a bearish trend and sells opportunity was identified meaning I can place a short trade position. However, the parabolic SAR Dots was already below the price which also signals a short position. Though it is a risky one because the Dots at that moment is indicating that the market will move upward. To receive a confirmation, I used the RSI. The RSI was above the 50 levels, as such, I placed a short position on a leveraged account with a cross margin of 5× on the Binance exchange platform.
IMAGE SHOWING THE PROCESS OF THE TRANSACTION DETAILS OF SAND/USDT
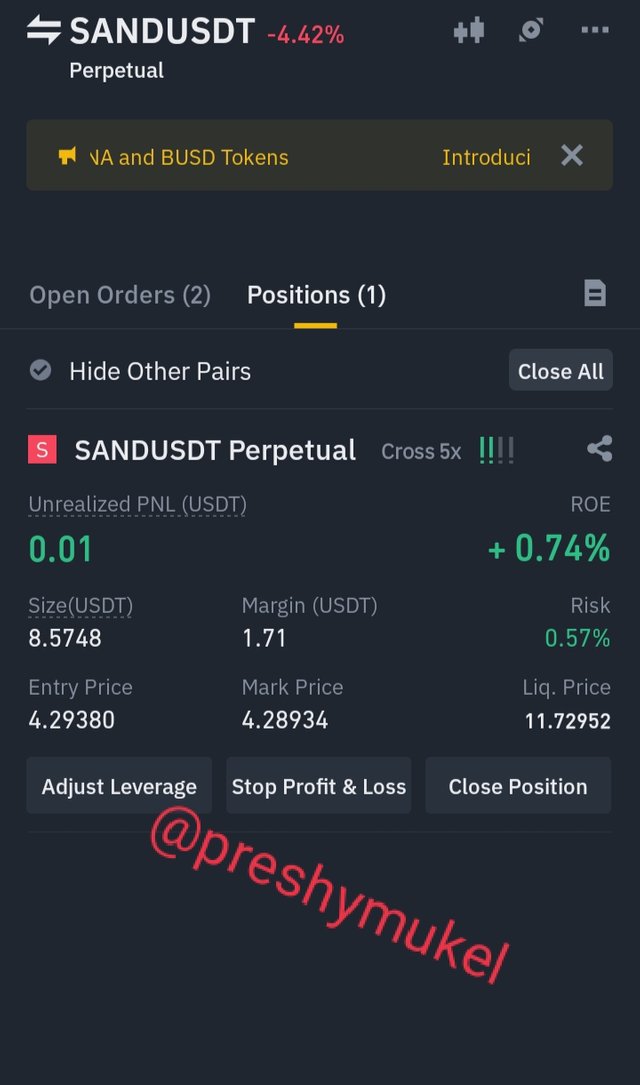
The image above is evidence of the transaction details on the Binance exchange of the SAND/USDT.
IMAGE SHOWING THE EXIT POINT OF THE SAND/USDT TRADE
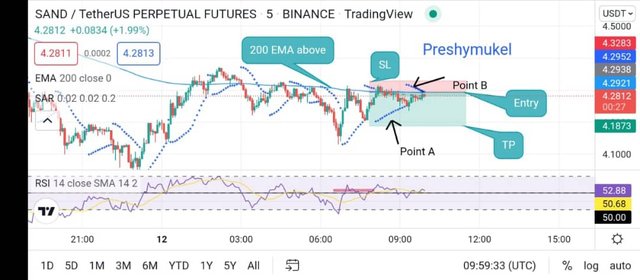
However, I made use of the exit method through the signal of the Parabolic SAR. Looking at the image below, point A; the Dots was below the price movement and that was the point at which I take profit (TP) target because I know the market might reverse upward which will hit my stop-loss (SL). Point B shows the Dots later went above showing the market might go upward but better signals for a short position. This signalled a bearish trend which would have favoured my trade but I took profits and close my position with little profit when I observed the dots was below the price.
IMAGE SHOWING THE FULL TRANSACTION DETAILS OF SAND/USDT
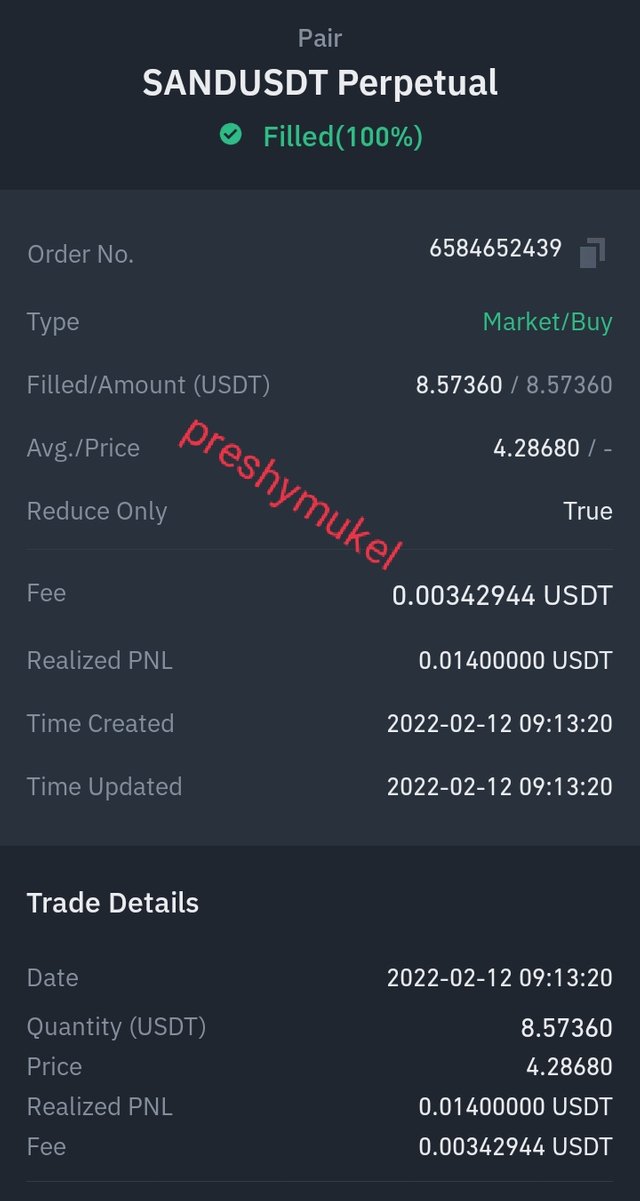
CONCLUSION
From what we have understood from this lesson, trading Cryptocurrency most especially using leveraged is very risky, and not ideal for novices who do not have any knowledge about technical analysis. However, the special trading strategy illustrated in this lesson is very important, as such, traders can make use of different indicators together such as Parabolic SAR, RSI, and EMA to obtain a successful trade.
Well, it is better to have a good trading strategy that will produce good trade results. And always understand that in the affairs of trading, no strategy is the best and all strategy is prone to failure, as such risk management should adhere.
Leveraged trading multiple profits when it comes to trading, but always have that mindset to lose funds because it's something one must encounter. How to make a better technical analysis of the cryptocurrency with proper risk management to avoid losing much of your funds.
SPECIAL REGARDS FOR READING THROUGH
Note: The screenshots where all taken from tradingview.
CC- @reddileep