
Hello my fellow Steemians, I welcome you all again to my homework post for the season 6 week 1 of the Steemit Crypto Academy. The assignment is that of @pelon53 on “Starting Crypto Trading”.
Below is my homework entry.......

1.- In your own words, what is fundamental analysis? Do you think it is important for a trader? Justify the answer.

The finance market is very volatile and as such the prices of assets changes from time to time causing the price movement of assets to constantly change from one trend to the other (bullish and bearish trends).
Inorder to trade without getting negatively affected by these trends reversals, the market analysis came into play. The two analysis used in the finance market by traders are technical and fundamental analysis. It is of a great importance to carry out a market analysis before entering any market in the crypto space, this will help trader hit the aim goal of trading which is profit making. Market analysis help traders determine the market trend of an asset and help them get a good signal of an entry and exit positions.
I'll be concentrating on the fundamental analysis in the cause of answering this question.
Fundamental analysis is a method of market analysis that is used to estimate the intrinsic value of an asset by carefully observing the economic and financial factors of the asset.
The factors that fundamental analysis focuses includes; the capability and integrity of the developer, the state of the company, the management of the company, the effectiveness of the company, future growth stated objectives, project's blockchain network, the whitepaper, the market capitalization of the asset, money flow rate, earnings etc.
With fundamental analysis the actual (intrinsic) value of an asset in the market can be determined to ascertain whether the asset is adding value higher than the intrinsic value or if the current value is lower than the intrinsic value.
Fundamental analysis plays an important part in determining the future price movement of an asset thereby giving traders an insight of when to purchase or sell an asset. In trading with Fundamental analysis, traders are recommended to sell an asset if the intrinsic value of an asset is analyzed to be lower than the current price of an asset, and to buy if the intrinsic value of the asset is analyzed to be higher than the current value of the asset.
Fundamental analysis determines the intrinsic value of an asset which cannot change overnight and this help traders to predict long-term trends, it also help traders choose a strong company to invest with. Fundamental analysis is therefore used by long-term traders and investors.

2.- Explain what you understand by technical analysis and show the differences with fundamental analysis.

Technical analysis
Technical analysis is the other type of market analysis mentioned earlier, it is a method used to evaluate and determine the future price trend of an asset based on historical price data. It focuses on an asset price and volume.
Technical analysis make use of charts and other technical tools and indicators to identify trading opportunities in the market. Traders uses technical analysis to get buy and sell signals. During technical analysis different technical tools and indicators are combined inorder to get a strong signal but in the combination of technical tools and indicators, traders should be very sure of the suitability of technical indicators and tools before combining them.
Technical analysis also help traders identify resistance and support levels which help in directing traders on when to enter a trade or exit the trade, it also help show price volatility.
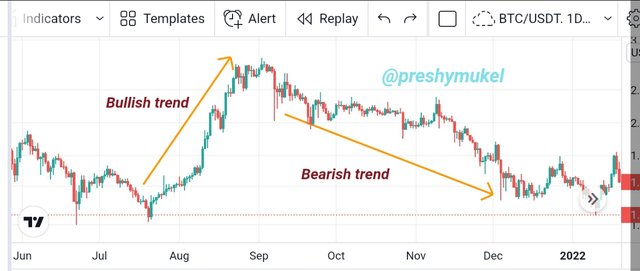
Example of a chart showing a bullish and bearish trend
From the chart above we can notice previous price movement of ADA/USDT pair at a particular period of time, the price at that time was having an upward trend (bullish trend) and then there was a reversal and the price starting experiencing a downward trend (bearish trend). From this previous price trend data, traders can analyse the market and spot an entry or exist position.
Technical analysis is used by short-term trader to help spot an entry and exit signal, it also help them manage risk by placing stop lose and take profit.
Differences between Fundamental analysis and Technical analysis
| Fundamental Analysis | Technical Analysis |
|---|---|
| 1. Fundamental analysis is a method of analyzing an asset by evaluating it's intrinsic value. | Technical analysis is a method of analyzing the future price trend of an asset using charts and technical tools and indicators. |
| 2. Fundamental analysis is used by long-term traders and investors to make investment decisions. | 2. Technical analysis is used by short term traders to spot quick trade signals. |
| 3. Fundamental analysis uses financial and economic events and factors to be able to determine an asset state. | 3. Technical analysis uses previous price data to determine the future trend of an asset. |
| 4. The past and present performance of the asset company is used to determine the future of the asset. | 4. The future price trend is determined by charts and indicators using only previous data. |
| 5. Data used during fundamental analysis includes; news event, economic reports etc. | Data used for technical analysis is charts analysis. |

3.- In a demo account, execute a sell order in the cryptocurrency market, placing the support and resistance lines in time frames of 1 hour and 30 minutes. Screenshots are required.

In answering this question I visited my TradingView app, using the BTC/USD pair on a time frame of 1hour, I carried out my technical analysis by identifying the support and resistance level and drawing the support and resistance levels lines which helped me get a sell signal. Afterwards I set my take profit after the first support level, I also set my stop loss a bit closer to the nearest resistance level and I also set a sell limit.
From the chart above it can be observed that the price moved upwards and my sell order got filled.
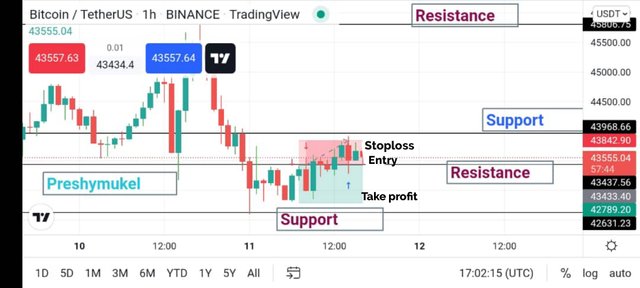
BTC/USD Sell order
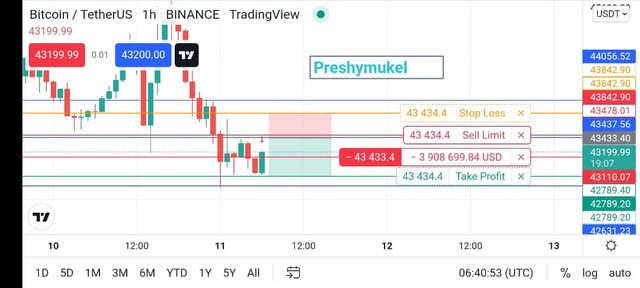
BTC/USD Sell order

Sell order transaction detail

4.- In a demo account, execute a buy order in the cryptocurrency market, placing the support and resistance lines in time frames of 1 day and 4 hours.

For this question I'll be executing a buy order of the Dash/USD pair using a 1hour time frame.
First I visited TradingView to carry out technical analysis of the Dash/USD pair inorder to be able to spot my buy position signal.
In the chart I identified my support and resistance and then went ahead to draw my support and resistance levels. I placed my buy order using the support and resistance levels I established. I set my stop loss beneath the resistance, and I also set my take profit to be closest support level.
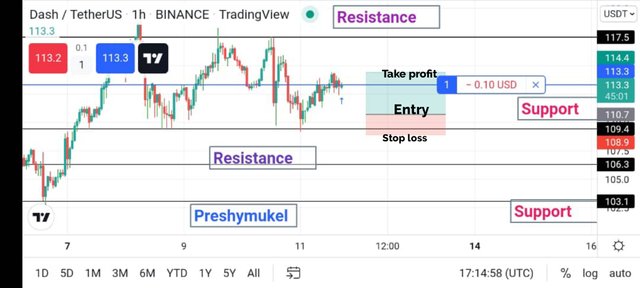
Dash/USD Buy order
From the chart above it can be seen that when the price hits the resistance level instead of a reversal, it broke the resistance level at $113.3.
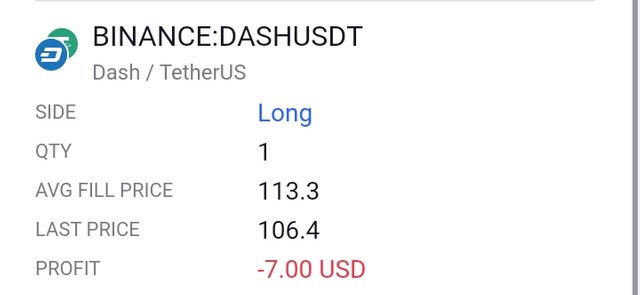
Buy order transaction detail

5.- Explain the “Hanging Man” and “Shooting Star” candlestick patterns. Show both candlestick patterns on a cryptocurrency market chart. Screenshot is required.

Candlesticks are important technical tools used to determine the price trend of an asset, it consist of a low, high, open and close prices of an asset for a specific time in the market. Candlestick is of two main types; the bullish candlestick and the bearish candlestick. The bullish candlestick is represented with a green color and it is always observed when the trend is moving upward and the bearish candlestick is represented with a red color which is observed when the price is moving downward. With candlesticks one can easily know the price trend of a market and also spot an exit or entry position. Other types of candlestick includes, the hanging man and shooting star which are explained below.
Hanging Man
The hanging man is a type of Japanese candlestick pattern that usually appears at the end of an uptrend representing a potential reversal from bullish to bearish trend.
It is a single candle with a very small body and a long lower shadow which must be twice or more greater than the body size for it to be an actual hanging man candle.
The color of the hanging man candlestick doesn't really matter what that matters is that the body should be small and the lower shadow longer than the body.
The formation of a hanging man in an bullish trend shows that bulls have lost control over the market and the bears are about to take over the market.
When traders spot the hanging man candlestick on a chart they tend to end an existing long position but it is appropriate to wait for the next candle to form inorder to confirm the signals.
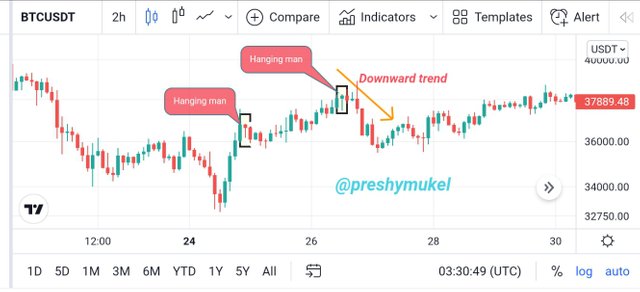
An example of a hanging man candlestick
Shooting Star
A shooting star candlestick is a bearish candle with a small body and a relatively long upper shadow with just small or no lower shadow at all. The shooting star candlestick is observed after an uptrend representing a bearish trend reversal. The color is not considered as it can be red or green.
A candlestick can only be considered a shooting star candle when it is formed during an upward trend and the distance between the opening price of the day and highest price must be twice as big as the shooting star body.
The shooting star formation indicates selling pressure in the market which pushes the price down thereby making the bears to take charge of the market.
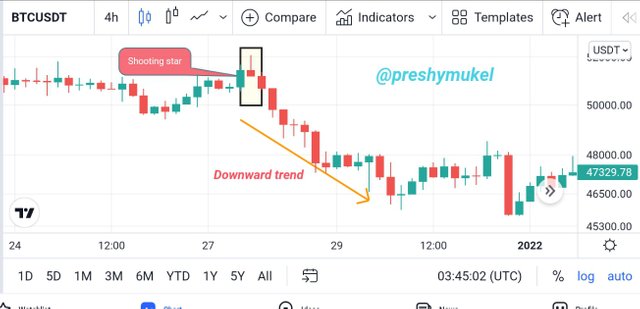
An example of a shooting star candlestick

6.- Conclusion.

Finance market is very volatile and therefore needs some level of knowledge and carefulness as any form of mistaken signal can lead to losses.
The market analysis makes it possible for trends to be confirmed and positions (buy and sell) identified before entering or exiting the market.
Technical analysis is meant basically for short-term trading, it focuses on using charts and other technical tools and indicators to forecast the Price movement of an asset using previous price data. Reading of candlestick is very vital in technical analysis as it helps in the indication of trends and trend reversals.
Fundamental uses economic and financial events to predict the future of an asset using past and present data.
Note: All charts screenshots in this work are my personal charts gotten from TradingView account
Thanks professor @pelon53 for the wonderful lecture, it was indeed impactful.
Downvoting a post can decrease pending rewards and make it less visible. Common reasons:
Submit