
Hello great minds, it's always good to be here. It's the Week 2 of the Season 6 edition of the Steemit Crypto Academy. Today I'll be making a post of the homework post given by @abdu.navi03 on “Trading strategy with RSI and ICHIMOKU”.

1-Put your understanding into words about the RSI+ichimoku strategy

In the finance market traders most times are faced with difficulties trying to identify trends and to forecast future price trends. Technical analysis made trends identification easier for traders, here traders can use technical tools and indicators which gives traders a guide on trends identification. During technical analysis it is wise to combine indicators as no technical indicator or tool is 100% accurate on it's own, the essence of combining indicators and tools is to confirm signals and get an accurate price trends, entry and exit positions.
In combining of technical indicators and tools it is important to note that not all indicators or tools works perfectly together, therefore it is of important to combine tools and indicators that are suitable together so as to get an accurate signals.
Here I'll be discussing the combination of the RSI and Ichimoku indicators.
The Relative Strength Index (RSI) is a momentum indicator that is; it measures and examine the current price fluctuations of an asset inorder to determine if the assets is overbought or oversold.
The RSI line ranges from 0-100 and the price state of an asset in the market is determined by the RSI line. An asset is said to be oversold when the RSI line gets to the range of 30 or less. An overbought is identified when the RSI line gets to the range of 70 and above.
While the Ichimoku indicator acts as a lead indicator that gives future support and resistance levels, market trend direction.
The Ichimoku Cloud indicator consist of 5 lines, they are; Tenkan Sen ( usually red in color), Kijun Sen ( usually white color) , Senkou Span A ( usually yellow in color) , Senkou Span B ( usually blue in color) , and Chikou Span ( usually green in color).
The Ichimoku cloud indicator have it's own faulty part which is the provision of late signals, reason why it should be combined with another suitable indicator.
The RSI and Ichimoku clouds indicators works perfectly when combined together and provides accurate signals than when used separately, when used separately they tend to render false signals. These two indicators when combined are used during technical analysis to identify price trends, forecast future trends and to identify resistance and support levels.
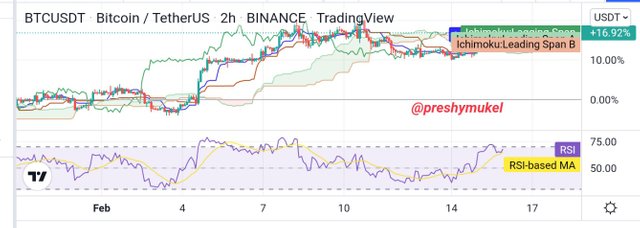
RSI and ichimoku cloud indicators on a chart

2-Explain the flaws of RSI and Ichimoku cloud when worked individually

From the above explanation I mentioned that it is risky to use a single indicator during technical analysis as it might render a false signal. It is always advisable to combine indicators inorder to confirm signals before taking a trade decision.
Flaws of Relative Strength Index (RSI) when used individually
RSI may render misleading signals when used alone, because it can move for a long time without clearly showing trends.
When using RSI alone price reversals can be unpredictable, and in cases where RSI predicts price reversals accurately, RSI can maintain an oversold or overbought level for a long period of time thereby losing it's usefulness when the market shows a strong trend.
RSI is a momentum indicator which focuses on identifying oversold and overbought conditions in a market, but doesn't provide the data needed to determine why or if these conditions signals a good trading opportunity.
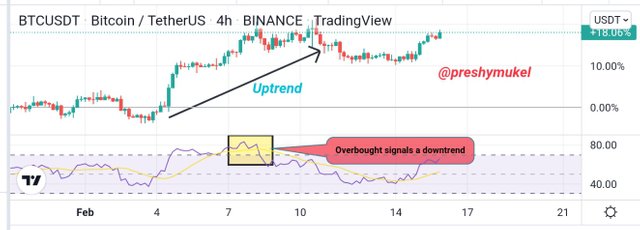
A false RSI signal
From the above chart we can see how RSI indicator that's used individually on a chart gave a wrong trend signal.
An overbought region of RSI indicates a downtrend, it can be seen from the above that when the RSI was indicating a downtrend the price movement of the asset was experiencing an uptrend. This is a clear proof that the RSI indicator can give fake signals when used alone thereby causing losses to traders.
Flaws of Ichimoku cloud when used individually
Ichimoku Cloud operates based on historical data which therefore means that traders look out for these historical data patterns to predict a market, the downside of the Ichimoku Cloud here is that these historical data might not reoccur again cutting off the expectations of traders.
Just like every other indicator, the Ichimoku Cloud can also produce misleading signals when used alone.
Another flaw of the Ichimoku cloud indicator is that the indicator lags. When used alone, the indicator shows it's own signal when the trend in the market has already gone thereby making traders to miss out on a very good entry and exit positions.

3-Explain trend identification by using this strategy (screenshots are required)

It is important that traders identify trends before making any trade decision as this will help the trader know the current trend of the market so as to know if he's to enter a long or short position.
RSI and Ichimoku clouds when combined together are also used to identify price trends in the market.
Bullish trend
A bullish trend is when the price of an asset in the market is continuously moving upward in a specific period of time.
During a bullish trend, the Relative Strength Index line will form a double top above 70 which is the overbought region, this double top at the overbought signal a bullish trend. Confirming the RSI signal we'll then take a look at the second indicator on the chart which is the Ichimoku cloud indicator, the Ichimoku cloud signal a bullish trend when the Ichimoku cloud line moves below the price movement of the asset.
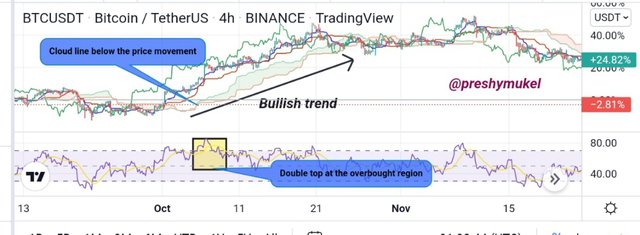
Bullish trend identification using RSI and Ichimoku indicators
From the above chat we can see how the RSI and Ichimoku indicators helped in the identification of a bullish trend.
Bearish trend
For bearish trend, the RSI will make a double top below 30 which is at the oversold signalling a bearish trend.
Using the Ichimoku clouds to confirm the signal, the Ichimoku clouds moves above the price trend in a bearish trend
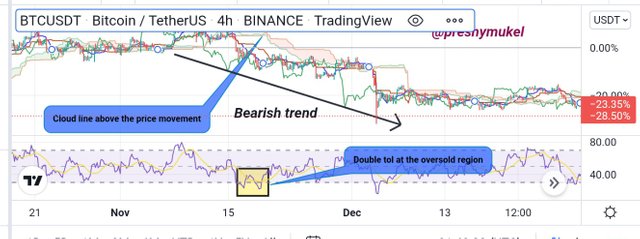
Bearish trend identification using RSI and Ichimoku indicators
From the above chat we can see how the RSI and Ichimoku indicators helped in the identification of a bearish trend.

4-Explain the usage of MA with this strategy and what lengths can be good regarding this strategy (screenshots required)

I'll be adding the moving average (MA) indicator to the RSI+Ichimoku cloud indicators.
The MA is a very popular indicator commonly used by most traders, it is used to forecast price movement.
After adding a moving average to a chart alongside with the RSI and Ichimoku cloud indicators, it is advised that we set a the length of the MA.
In this case I used a 70-days moving average length as seen from the chart below.
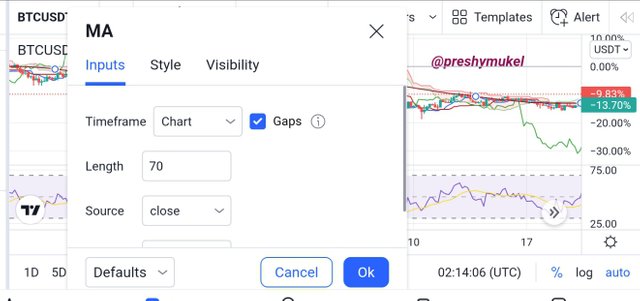
Setting of MA on a chart that consist of RRSI+Ichimoku indicators
From the chart below we can observe that the price is on a bullish trend which was comfirmed by the RSI+Ichimoku cloud indicators alongside with the moving average (MA) indicator.
The RSI shows a double top at the overbought region indicating a bullish trend, the Ichimoku cloud line is below the price also indicating a bullish trend and the the Moving Average is observed to be moving below the price which also indicates a bullish trend.
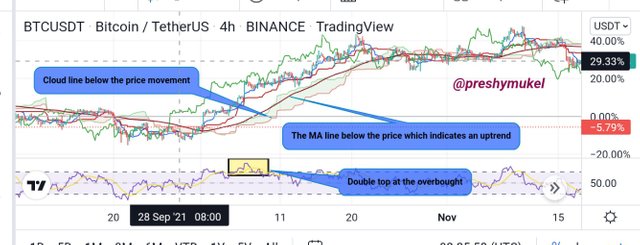
MA+RRSI+Ichimoku indicators on a chart

5-Explain support and resistancet with this strategy (screenshots required)

Support and resistance are two important things to note during technical analysis, support and resistance are price barriers or reversal points and traders uses the support and resistance to identify possible price reversal points in a market, and from these reversal points they place their sell a buy orders respectively.
Resistance level is a level during an uptrend where the price get rejected and at this point the uptrend will reverse causing the prices to be trending downward.
Support level is a point in a downtrend where the price pause and reverse to make an upward movement due to high demand of an asset.
Support and Resistance with this in Trends
The Ichimoku cloud line plays a vital role in the identification of support and resistance levels during a market trend using the strategy. A price is identified as a support level when the color of the Ichimoku cloud line is green and as a resistance level when the color of the Ichimoku cloud line is red.
The gap between the Ichimoku cloud line and the price is another thing considered when identifying support and resistance in trends, the closer the gap, the weaker the trend and vise versa.
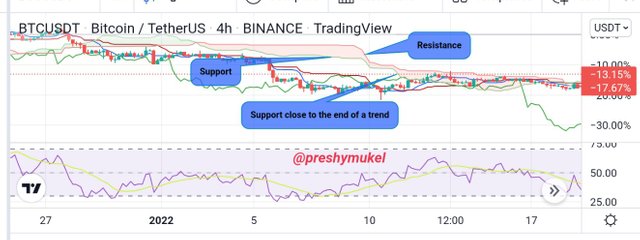
Support and Resistance identification using the Ichimoku cloud
Support and Resistance Levels in a Sideways Market using the strategy
Support and Resistance Levels in a sideways is determined by the RSI, here the RSI is used to identify the state of the market, i.e if the asset is overbought or oversold.
A resistance level is identified when the RSI is at the overbought region above 70 and a support level is identified when the RSI is at the oversold region below 30.
Example is shown on the chart below.
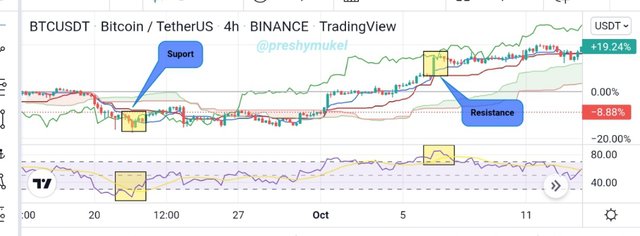
Support and resistance identification using RSI

6-In your opinion, can this strategy be a good strategy for intraday traders?

In technical analysis traders are advised to combine suitable indicators together inorder to get an accurate and reliable signals. Combining of indicators help in the confirmation of signals as some indicators when used alone give false and misleading signals.
The RSI and Ichimoku cloud indicators are two indicators that works perfectly together by covering each other’s limitations and as such making trades favourable for traders.
Therefore in my opinion, I'll say the RSI and Ichimoku strategy is a good strategy for intraday traders because with the strategy intraday traders can identify price trends and also support and resistance levels can be identified using the both indicators as confirmations, the RSI also help traders in making trading decisions as it provide data of the overbought and oversold region of an asset and in a market.
The identification of support and resistance makes it easy for traders to spot an entry positions and exit positions in a market.

7-Open two demo trades, one of buying and another one of selling, by using this strategy

Buy Order
Using the RSI and Ichimoku cloud strategy on a Steem/USDT pair with a 45min time frame, I was able to spot an entry position.
Looking at the chart it can be noticed that the RSI line formed a double top above 70 which is the overbought region which signal a bullish trend and an entry position. I went further to confirm the signal by identifying the Ichimoku cloud trend, which was below the price also signalling an entry position.
After identification of my entry point, I went ahead to set my stop loss and take profit in order to manage risk and then I placed my buy order.
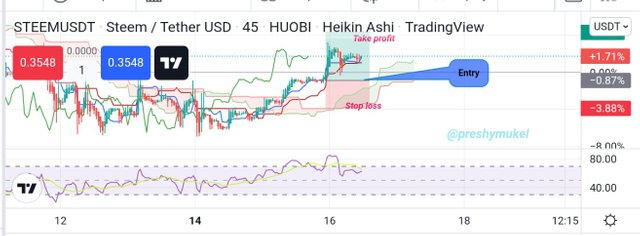
Steem/USDT buy order
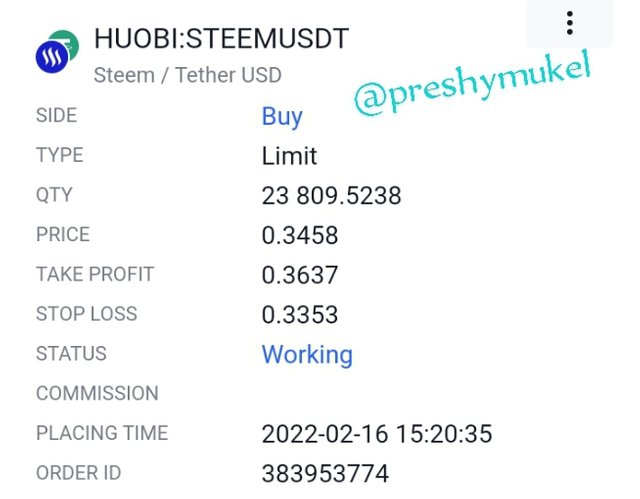
Buy order history
Sell Order
Using the RSI and Ichimoku cloud strategy on a PSG/USDT with a 30 min time frame, I was able to spot a sell position.
Looking at the chart it can be noticed that the RSI line formed a double top at the oversold region i.e below 30 and this signals a bearish trend and an exist position. I went further to confirm the signal by identifying the Ichimoku cloud trend, which was above the price also signalling an exit position.
After identification of my selling point, I went ahead to set my stop loss and take profit in order to manage risk and then I placed my sell order.
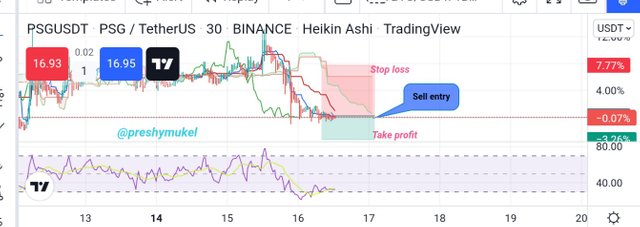
PSG/USDT Sell order
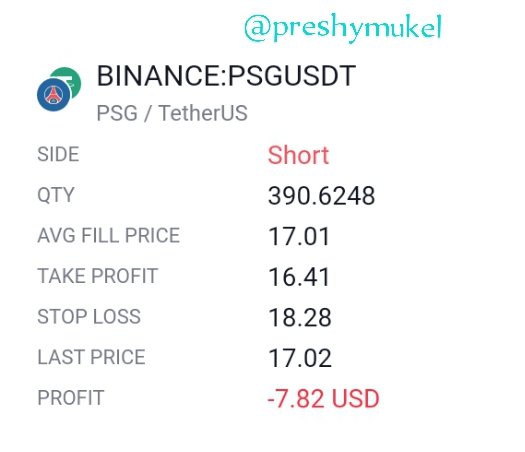
PSG/USDT sell order history

Conclusion

For accurate and reliable signals, it is best for indicators to be combined, as these indicators help compliment each other. But when combining indicators it is important to note that not all indicators are suitable, therefore it is important to combine indicators that are suitable inorder to get right signals. The RSI and Ichimoku cloud indicators are suitable for each other as it provide accurate signals used by traders to make good trade decisions.
Thanks Prof. @abdu.navi03 for the great lecture, my first time of hearing about the RSI and Ichimoku strategy and applying it, and I think it's a great one.
I'm glad I participated in this lecture because I've really learnt a lot from this lecture.
NOTE: All the charts I used in this post are my personal chart from TradingView app.