This lecture is basically on the importance, function and reliability of the Median Indicator. We will be seeing how this indicator works. So without wasting any time, I will be showing my understanding on the lecture by answering the questions that follows:

Explain your understanding with the median indicator
Before I proceed with the explanation of the Median-Indicator, I would like to individually explain the words for more understanding.
Median can simply be referred to as the Central or Middle of a given area or value. And in some cases, the average of two or more numbers is regarded as a median. While An Indicator in respect to cryptocurrencies, simply refers to instruments or tools that can be used to predict and measure the movement of market trends.
So, Median Indicator as I have been rightly taught by our professor this week, is a technical indicator that has been designed to move with the current trend/volume of the market. This indicator is designed to calculate the Central value between a higher and lower moving average. The vertical space range between this two moving average is where the mid point is located, and the median indicator makes use of the Average True Range (ATR) to calculate how volatile the market is.
The Median Indicator is made up of 3 swinging lines, and they includes the upper band (usually green in colour), the lower band(usually purple in colour) and a middle line (colour changes as trend changes) which indicates the current volatility state of the market. This indicator works with the EMA of that same period as the middle line, which would then tell us the current direction of the market (whether bullish or bearish).

Parameters and Calculations of Median indicator (Screenshot required)
Below are the Parameters and Calculations of the Median Indicator:
The Parameters of the Median Indicator
First things first, I would first need to insert the Median Indicator to my chart. So for the sake of this lesson, I would be using the Tradingview Website for this operation.
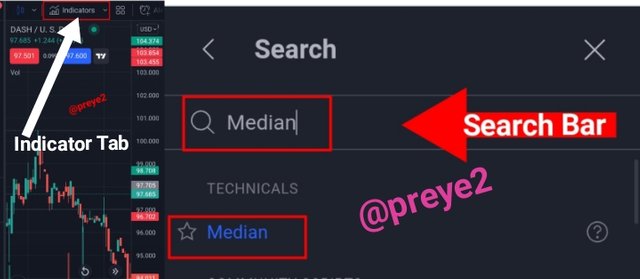
I located and clicked on the Indicator tab at the top of my chart. I then typed and searched for the Median Indicator.
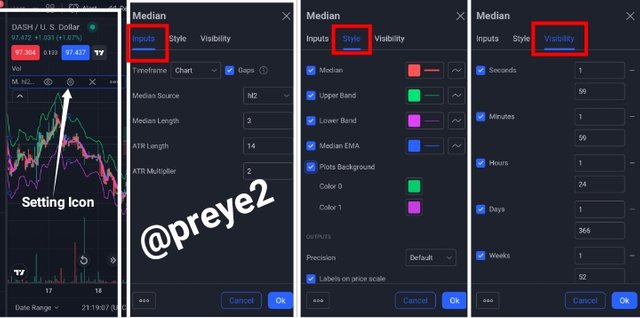
To Configure this indicator parameters, I clicked on the Setting Icon, where the default settings for Median Source, Median Length, ATR Length, and ATR Multiplier is HL2, 3, 14, and 2 respectively. Under Style, I can change the colour of the various lines to my desired color, as well as the visibility.
The Calculation of the Median Indicator
The median indicator has a way it has been designed to operate, and when we look at the Inputs in the default setting, we would see how it was calculated.
The first is the Median Source which is HL2, meaning The highest + Lowest Price ÷ 2.
We have the Median Length which includes the calculation of the 3 line bands upper, lower and middle bands.
For the Upper Line Band = Median + 2ATR
While the Lower Line Band = Median - 2ATR
- To calculate the The Exponential Moving Average's(EMA)'s Value = {(Closing Price × Multiplier) + EMA of the Previous day × (1 - Multiplier)}.
So therefore, the Median Indicator is gotten from the % Change in ATR on the EMA or Median Value.

Uptrend from Median indicator (screenshot required)
One of the major uses of the Median indicator in regards to trading is that it shows traders the volatility and current trend of the market. The market usually trends up or down, and here's how to identify an uptrend movement.
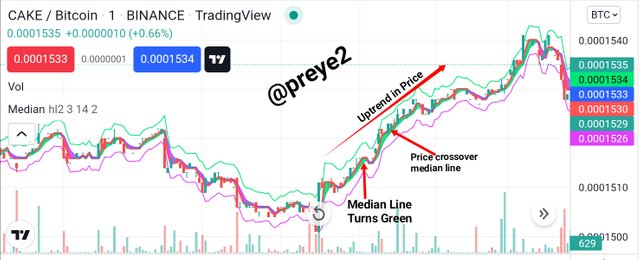
An uptrend is said to have occurred when the market begins to experience a series of higher highs in the candlestick charts. So using the median indicator, an uptrend is said to have occurred when the market trend as well as the median indicator line is seen going to the upward direction.
This indicates that the numbers of buyers rushing into the market are greater than those going out of the market, wherefore increasing the buying pressure.
As the median indicator line goes up, it turns green in color which means buyers could start placing their buy orders. A long bullish run is expected to occur when the market price crosses above the green median indicator line. Below is a CAKE/BTC chart for more clearification.

Downtrend from Median Indicator (screenshot required)
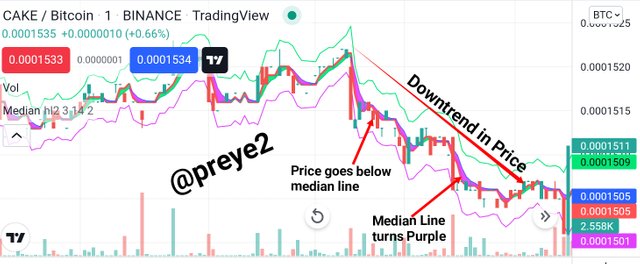
For downtrend, the market begins to experience a series of lower lows in the candlestick charts. So using the median indicator, a downtrend is said to have occurred when the market trend as well as the median indicator line is seen going to the downward direction. This indicates that the numbers of sellers rushing out of the market are greater than those coming into market, wherefore increasing the selling pressure.
As the median indicator line falls down, it turns purple in color which means sellers could start placing their sell orders. A long bearish run is expected to occur when the market price crosses below the purple median indicator line. Below is a CAKE//BTC chart for more clearification.

Identifying fake Signals with Median indicator(screenshot required)
In some cases, we see that the crypto market gets very unpredictable, which means it's always advisable to combine atleast two different indicators for confirmations of trading signals.
We can identify fake signals here, when the median indicator is combine with a good trend measurement indicator (preferably RSI). When the RSI indicator shows a buy/sell signal, but the median indicator doesn't equally show the same signal, then it's a false signal, which traders ought to avoid.
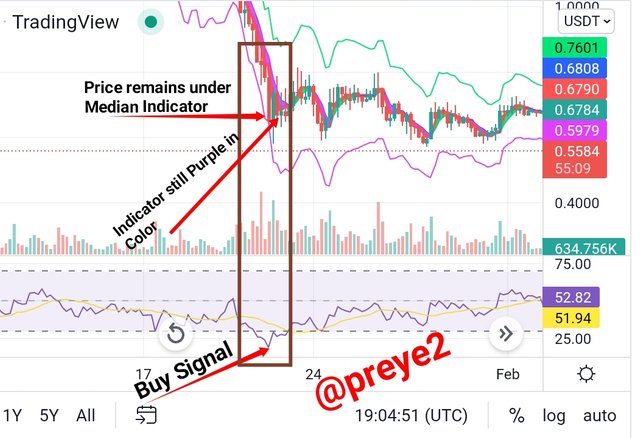
As you can see on the screenshot above, the RSI indicator has shown that the market is in a bullish reversal state, but the price indicator has not reversed, and the median indicator is still purple in color. Traders should avoid to trade in such situations, as it could lead to losses.

Open two demo trades, long and short, with the help of a median indicator or combination that includes a median indicator (screenshot required)
With all the necessary criterias put in place, I will be placing a buy and a sell order using the median indicator. I would equally be combining it with the RSI indicator for confirmation purposes. So I would be starting with the Long order (Buy).
Long Order For SOL/USDT Pair Chart
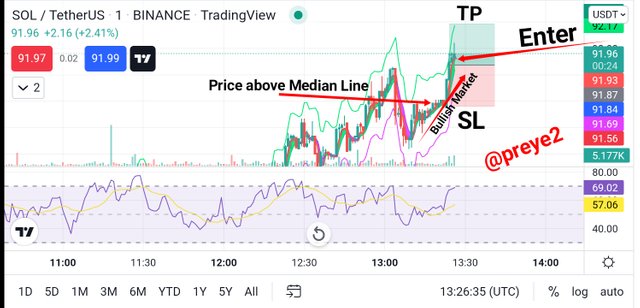
As you can see on the 1 minute chart above, the market started making a series of higher highs and the median indicator turns green as it goes up too. I observed that the price indicator has crossed above the median line which means I can now place my buy orders.
I then confirmed the upward trend movement using the RSI indicator, as it was trending up at (69.02) above it's mid-line.
I went ahead to place my buy order at $91.96. Using a risk-reward ratio of 1:1, I set my stop-loss and take-profit at 91.85 and 92.17 respectively.
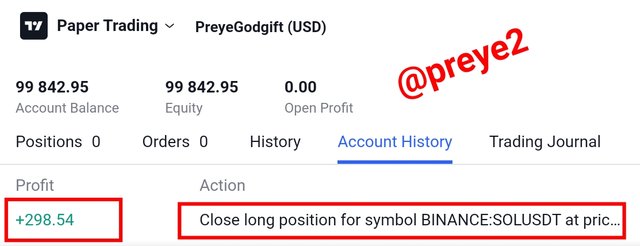
I left my trade to close on its own, and after some time the trade was successfully executed with a profit of +298.54.
Short Order For DASH/USDT Pair Chart
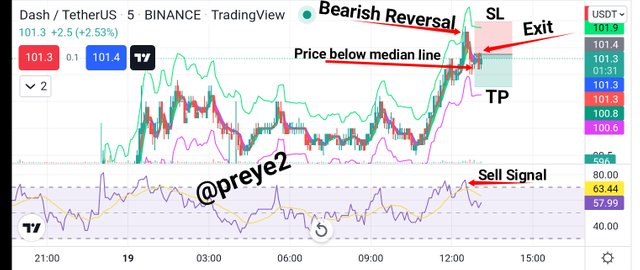
As you can see on the 5 minute chart above, a bullish run seems to be over and a downtrend is expected to occur next. The median indicator turns red as a bearish reversal takes place.
I observed that the price indicator has crossed below the median line which means I can now place my sell orders. I then confirmed the downward trend movement using the RSI indicator, as it reverses to the down side.
I went ahead to place my sell order at $101.3. Using a risk-reward ratio of 1:1, I set my stop-loss and take-profit at 101.9 and 100.8 respectively.

I left my trade to close on its own, and after some time the trade was successfully executed with a profit of +250.12.


This is actually my first class with you sir, and I am really impressd with the way you break down your points for our understanding. I now understand that the median indicator is used to detect the movement of trends and volatility in the market. I got to understand that this indicator can equally be used to observe buy and sell signals. It's equally advisable to combine this indicator with other indicators for confirmation purposes.
I really learnt alot from this lecture and I thank professor @abdu.navi03 for bringing this topic to us this week.
Thank you for your time.
Note: All screenshots were taken from my Tradingview Demo Account and designed using iMarkup.
