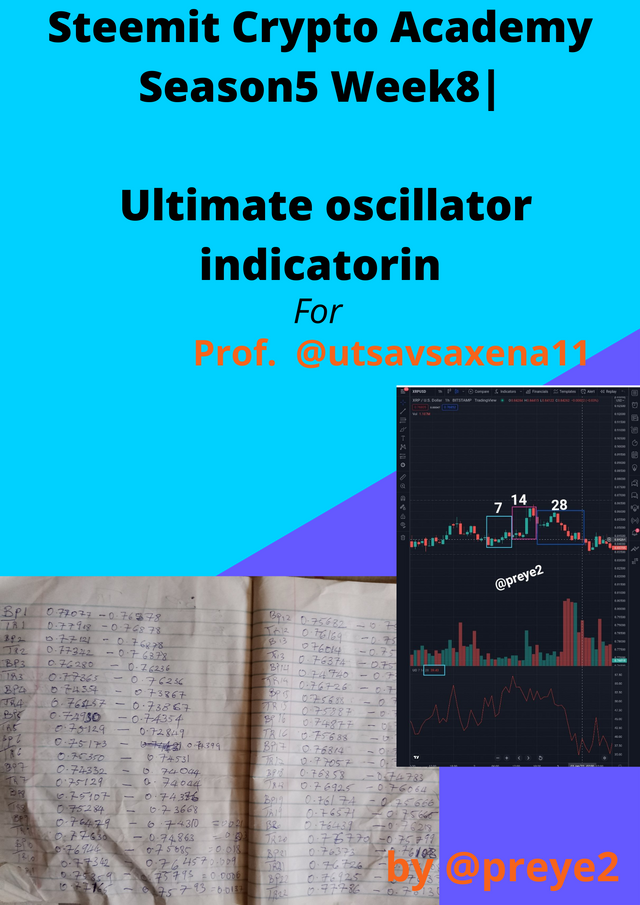

What do you understand by ultimate oscillator indicator. How to calculate ultimate oscillator value for a particular candle or time frame. Give real example using chart pattern, show complete calculation with accurate result.
The Ultimate Oscillator Indicator: Is actually a technical indicator that was created by an American stock trader who goes by the name Larry Williams in the year 1976. This indicator was created to help traders take control of the momentum within 3 different timeframes (7th, 14th and 28th period timeframe). The 7 minutes timeframe basically represents a short market period, the 14 minutes timeframe basically represents an intermediary market period, while the 28 minutes timeframe serves as a long market period. So this Indicator basically uses these different timeframes to calculate and produce profitable results for traders.
This Indicator was designed to operate with 3 horizontal lines, where the upper (70) and lower (30) lines simultaneously represents overbought and oversold, while the middle line is regarded as the **Indicator line.
This Indicator is uniquely built, unlike other momentum indicators that produces false divergence signals. So with the use of the 3 different timeframes, this Indicator tends to avoid false divergence signals, and produce a more result.
How is the Ultimate Oscillator Value Calculated for a particular timeframe or Candle?
I will try to show how the Ultimate Oscillator value is calculated as simple as I can, but before I continue, it is important to note that the UO value would be gotten from both the buying pressure (BP) and True Range (TR) figures. And here is the general formula for the it's calculation:
The Value of the Ultimate Indicator (UO) = (4 × A7 + 2 × A14 + A28) ÷ 7 × 100.
- So I would first calculate the buying pressure (BP) and true range (TR), where:
BP = Current Close Price - (the lowest value between Current Low and Previous Close)
TR = (The highest value between the Current High and Previous Low) - (The lowest value between the Current Low and Previous Close)
Secondly, I would look for the average of 3 different periods, and according to this creator of this Indicator it's advisable to simultaneously use the 7th, 14th, and 28th period timeframes.
So to calculate for each period would be given as:Average of the 7th Period (A7) = Summation of the BP values for the past 7 period timeframe ÷ Summation of the TR values for the past 7 period timeframe.
Average of the 14th Period (A14) = Summation of the BP values for the past 14 period timeframe ÷ Summation of the TR values for the past 14 period timeframe.
Average of the 28th Period (A28) = Summation of the BP values for the past 28 period timeframe ÷ Summation of the TR values for the past 28 period timeframe.
And lastly after getting all the figures needed, I would substitute them into the UO formula and get my UO value.
As directed by the professor, I would be showing a real example on an XRP/USD pair on Tradingview
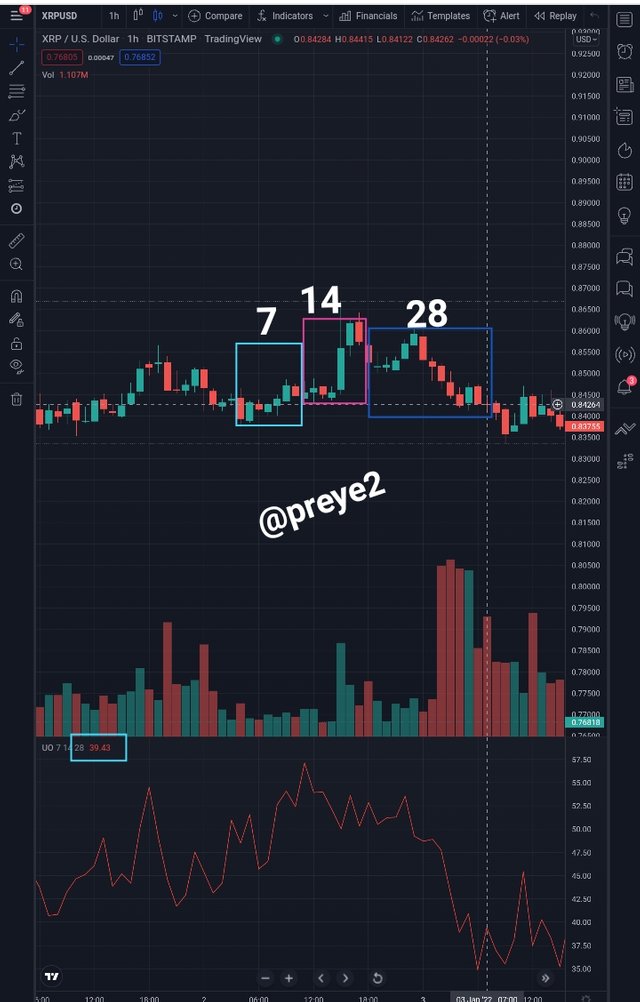
As you can see on the chart I counted 28 candlesticks, and the UO of the 28th candle at 39.43. So I started my calculations from the left to the right hand side.
| The periods | Buying Pressures (BP) | True Range (TR) |
|---|---|---|
| 1 | 0.002 | 0.010 |
| 2 | 0.002 | 0.004 |
| 3 | 0.0004 | 0011 |
| 4 | 0.005 | 0.025 |
| 5 | 0.0057 | 0.022 |
| 6 | 0.007 | 0.0081 |
| 7 | 0.003 | 0.0081 |
| 8 | 0.008 | 0.016 |
| 9 | 0.021 | 0.03 |
| 10 | 0.018 | 0.009 |
| 11 | 0.0006 | 0.0137 |
| 12 | 0.002 | 0.007 |
| 13 | 0.003 | 006 |
| 14 | 0.01 | 0.03 |
| 15 | 0.01 | 0.013 |
| 16 | 0.014 | 0.022 |
| 17 | 0.019 | 0.027 |
| 18 | 0.020 | 0.008 |
| 19 | 0.005 | 0.009 |
| 20 | 0.00221 | 0.0097 |
| 21 | 0.0026 | 0.00618 |
| 22 | 0.0055 | 0.016 |
| 23 | 0.0042 | 0.010 |
| 24 | 0.0066 | 0.006 |
| 25 | 0010 | 0.0125 |
| 26 | 0.001 | 0.004 |
| 27 | 0.003 | 0.006 |
| 28 | 0.001 | 0.007 |
- A7 = 0.0251 ÷ 0.0901 = 0.278
- A14 = 0.0877 ÷ 0.2018 = 0.434
- A28 = 0.28131 ÷ 0.035458 = 0.793
Putting the values in the equation would be given as:
(UO) = (4 × A7 + 2 × A14 + A28) ÷ 7 × 100.
UO = (4 × 0.278 + 2 × 0.434 + 0.793) ÷ 7 × 100.
UO = (1.112 + 0.868 + 0.793 = 2.77) ÷ 7 × 100
UO = 2.77 ÷ 7 = 0.3957
UO = 0.3957 × 100
UO = 39.57
As you can see on the screenshot the UO value is 39.43, and I got 39.57 which must have been from manual error. But when technically calculated as programmed the Indicator produces accurate results.

How to identify trends in the market using ultimate oscillator. What is the difference between ultimate oscillator and slow stochastic oscillator.
We can use this Indicator to identify both uptrends, and downtrends in the market by using it's band reading which ranges from 0-100. Like I said earlier this Indicator was designed to operate with 3 horizontal lines, where the upper (70) and lower (30) lines simultaneously represents overbought and oversold, while the middle line is regarded as the Indicator line.
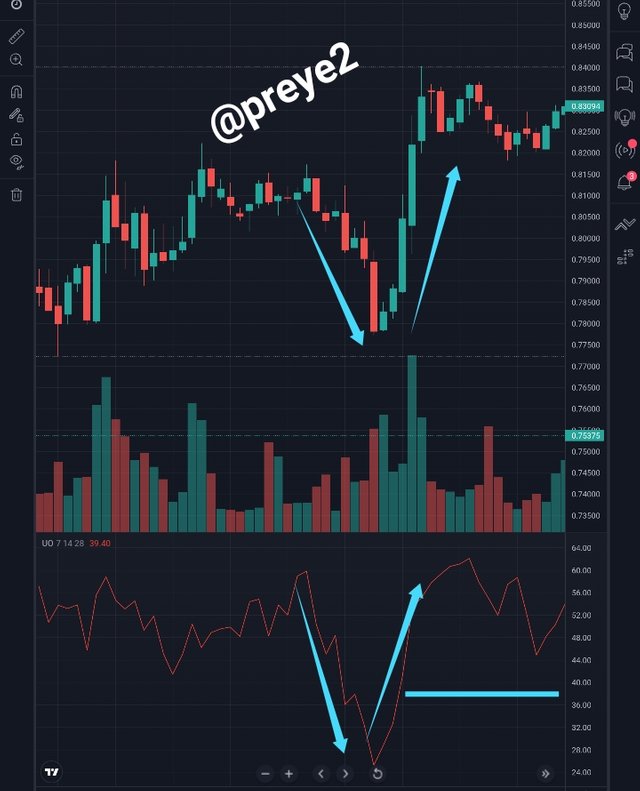
An uptrend is said to be on its way when the UO line crosses below the 30 line band, and is in an oversold state, which means that the sellers are rushing into the market and an uptrend will tend to follow. So traders should expect a bullish reversal whenever the market is oversold. Below is an example of an uptrend using the UO Indicator.
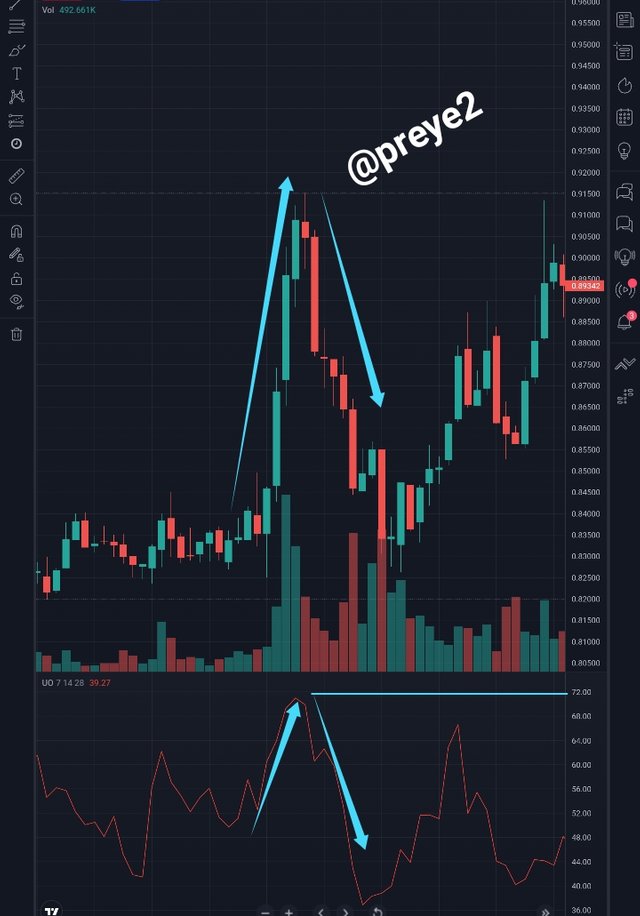
While A downtrend is said to be on its way when the UO line crosses above the 70 line band, and is in an overbought state, which means that the buyers are rushing into the market and a downtrend will tend to follow. So traders should expect a bearish reversal whenever the market is overbought. Below is an example of a downtrend using the UO Indicator.
Differences Between Ultimate Oscillator (UO) and Slow Stochastic Oscillator
| Ultimate Oscillator | Slow Stochastic Oscillator |
|---|---|
| The first unique feature of the UO is the use of its 3 different timeframes (7th, 14th and 28th period timeframe) for checking market momentum | But the slow stochastic Oscillator can makes use of only 2 different timeframes (3rd and 14th period timeframe). |
| The divergence signals gotten from the UO will produce a different result from the slow stochastic Oscillator because of the calculation of 3 different timeframes | This Indicator will equally produce a different divergence signal from the UO because of it calculation method with 2 timeframes |
| This indicator tends to produce a more lesser and reliable signals that the SSO | This Indicator tends to produce a more larger and less reliable signal than the UO |
| Using the UO indicator, the market is said to be in an overbought and oversold stage when price respectively crosses above and below the 70 and 30 line band | While in the SSO indicator, the market is said to be in an overbought and oversold stage when price respectively crosses above and below the 80 and 20 line band |

How to identify divergence in the market using ultimate oscillator, if we are unable to identify divergence easily then which indicator will help us to identify divergence in the market
Unlike other Indicators, the Ultimate Oscillator was designed to accurately detect divergence in the market by using 3 different timeframes (7th, 14th and 28th) to get avoid false divergence signals. Divergence in the market simply refers to a situation whereby the market price and the Indicator line are both going towards opposite directions, and in most cases a trend reversal may tend to follow. So here's how to identify a bearish and bullish reversal in the market using the UO Indicator.
Identification of a Bullish Divergence
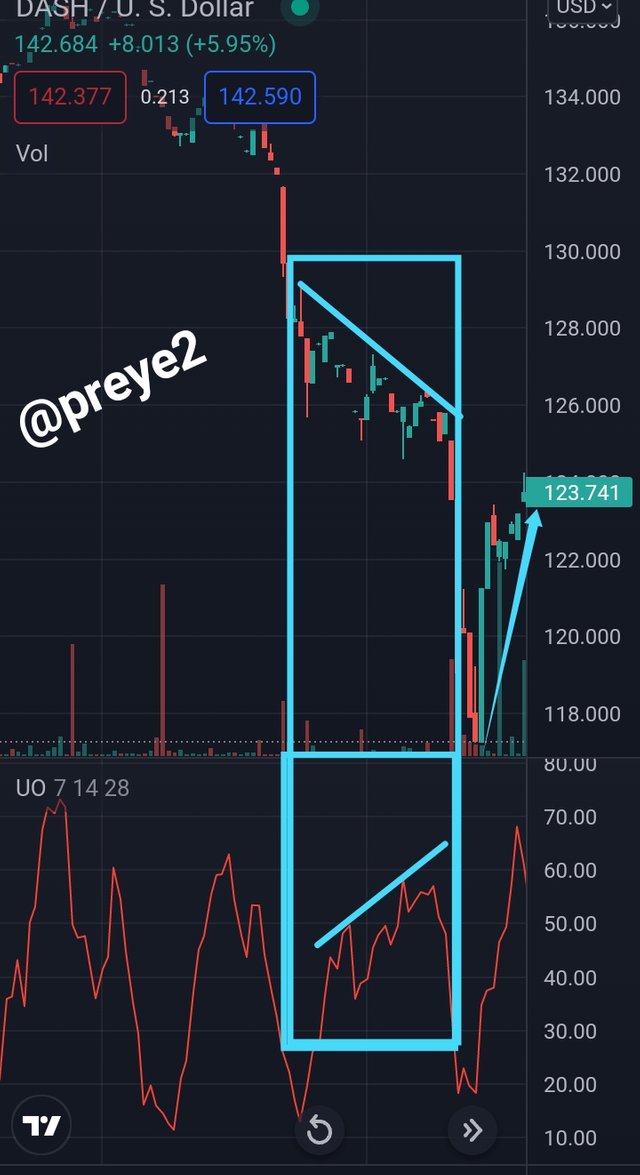
Using the UO Indicator, a Bullish Divergence is said to be formed whenever the market price begins to gradually go downwards but the UO Indicator begins to gradually rise to the upside at the same time. What this implies in the market is that the selling pressure is gradually getting lesser and that traders should expect an uptrend to follow anytime soon. Below is a screenshot for more clearification.
Identification of a Bearish Divergence
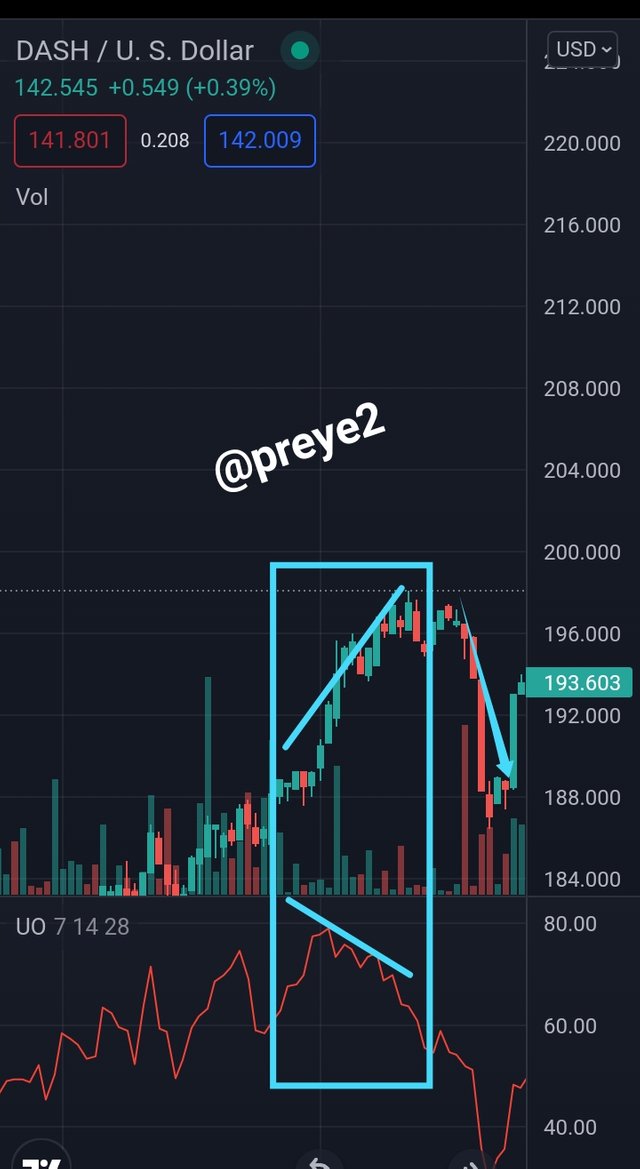
Using the UO Indicator, a Bearish Divergence is said to be formed whenever the market price begins to gradually go upwards, but the UO Indicator begins to gradually fall to the downside at the same time. What this implies in the market is that the buying pressure is gradually getting lesser and that traders should expect a downtrend to follow anytime soon. Below is a screenshot for more clearification.
Indicator that can help us to easily identify divergence in the market
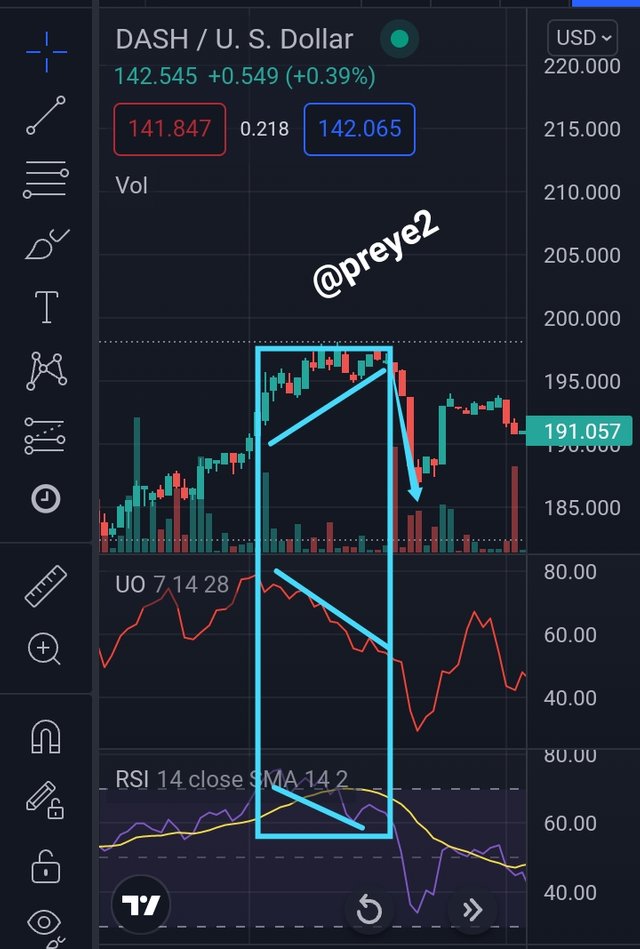
Another indicator that can easily help us to identify divergence in the market is called the Relative Strength Index (RSI) Indicator, basically because it equally uses it's line band to know when the market is in an overbought or oversold stage. It can be used with the UO Indicator to confirm if the divergence formed is really accurate or not. Below is a screenshot that shows the combination of a the RSI and the UO Indicator.

what is the 3 step- approach method through which one can take entry and exit from the market. Show real example of entry and exit from the market.
Before a trader places his buy or sell orders in the market, here are the 3 step approachs he or she must follow:
The 3 step approach for Buy
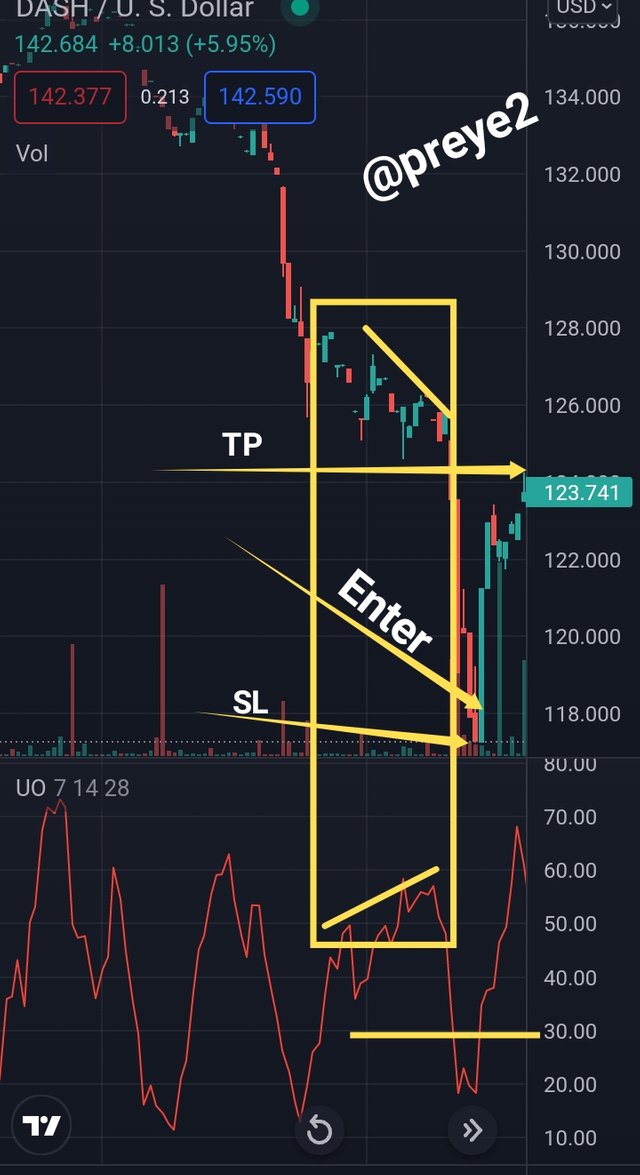
- The trader must first observe if market is currently in a bullish divergence stage, which implies that the market price would begin to gradually go down, while the UO Indicator begins to gradually rise up at the time.
And then the trader should equally observe if the UO Indicator has crossed below the 30 band line, which implies an oversold, meaning selling pressure is getting lesser and that an uptrend is expected anytime soon
And thirdly before entering, the trader should observe that the UO has gone up above the high of the divergence formed.
The 3 step approach for Sell
- The trader must first observe if market is currently in a bearish divergence stage, which implies that the market price would begin to gradually go up, while the UO Indicator begins to gradually fall down at the time.
And then the trader should equally observe if the UO Indicator has crossed above the 70 band line, which implies an overbought, meaning buying pressure is getting lesser and that a downtrend is expected anytime soon
And thirdly before entering, the trader should observe that the UO has gone down below the lows of the divergence formed.
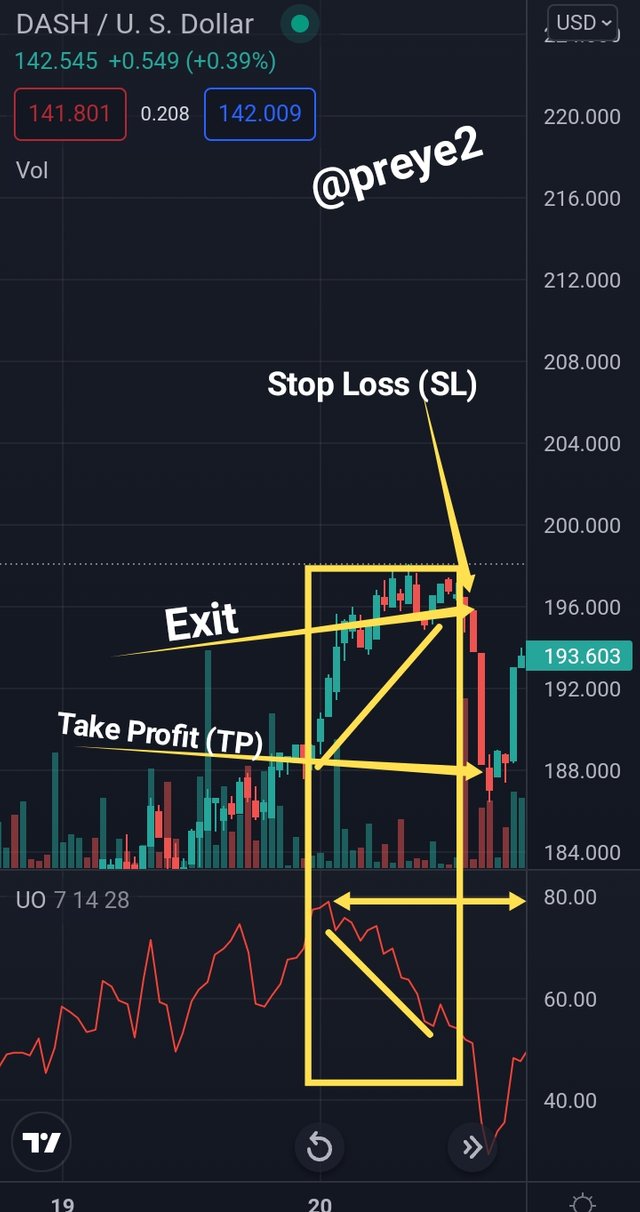

What is your opinion about ultimate oscillator indicator. Which time frame will you prefer how to use ultimate oscillator and why?
Personally I would say this Indicator is the best momentum Indicator out there, because it tends to produce lesser amounts of signals, but the signals it produces will go a long way in helping traders to comfortably trade, because it's more accurate than many other momentum Indicators. The reason why I think this Indicator is very reliable is because of the amount of period lengths it uses, which is 3 (7, 14 and 28). I would start making use of this Indicator because I find it more reliable and better than the Slow Stochastic Oscillator.
This indicator would go a long way in helping traders who finds it difficult to detect or identify false signals due to the fact that some Indicators produces false signals.
My most Preferred timeframe when using the Ultimate Oscillator
Normally the UO Indicator has been designed work in every timeframe but I believe shorter timeframes could produce more accurate signals than the longer timeframes.
For me I prefer using shorter timeframes like the 15 or 30 minutes timeframe, and in most cases the 1 hour timeframe. When using the UO Indicator I would use the 1 hour timeframe because I usually love trading within the day and the 1 hour is usually what I use for my profits.


The UO Indicator basically solves the problem of false divergence signals produced by other momentum Indicators, and this will go a long way in helping traders to know when to enter and exit the market. The 3 different timeframes used in its calculation would help it accurately produce better results. This Indicator tends to produce more accurate results than the Slow Stochastic Oscillator and it is more reliable than most momentum Indicators out there.
I thank professor @utsavsaxena11 for bringing such an educative lecture to us this week.
Note: All screenshot were taken from my Tradingview account