
Define in your own words what Harmonic Trading is?

Harmonic Trading is a trading technique that involves the movement of a market's price that forms a pattern in a geometric manner to the next level. The formation of the pattern is achieved using points A, B, C, and D where A is the starting point and D is the ending point of the pattern formation. The reason why these patterns are anticipated is that the market usually repeats itself.
This repetition phenomenon can be seen in the movements of prices, the trends that prices follow, and the cycles which the markets always experience. For instance, at the start of a downtrend, the first bearish impulse in the trend is followed by another bearish impulse of the trend that is almost the same size as the first bearish impulse. In between the two bearish impulses is a setback or price retracement that is formed, the setback also forms after the second bearish impulse and the first and second setbacks are usually similar in size.
The use of harmonic trading is usually accompanied by the use of Fibonacci Retracements numbers. By utilizing Fibonacci retracements numbers, it allows traders to define precise turning points which gives a clear entry and exit point. It relies heavily on Fibonacci numbers because it is a technical indicator that gives certainty to the patterns initially formed.
Harmonic Trading combines patterns and math to form a trading method that gives a better perspective on the market and is based on the premise that a pattern follows a cycle. If patterns of varying lengths and magnitudes are found, a trader can then apply Fibonacci ratios to the pattern to enable them to predict future movements. There are a lot of harmonic patterns, however, there are four that are very popular. They are The Garley, Butterfly, Bat, and Crab patterns.

Define and Explain what the pattern AB = CD is and how can we identify it?

The Harmonic pattern AB = CD is a pattern formation that originates from any 4 movements that are known as "A, B, C, and D," that moves in the form of a wave where a trader can make a long entry (buy position) when the price has come down with the prospects of making a profit when the market goes up. Likewise, a trader can make a short entry (sell position) when the price is high and there is a prospect of making a profit when the price comes down.
What makes this AB = CD peculiar is that for an operation in the financial markets (cryptocurrency, stocks, bonds, forex), no matter what asset a trader operates on or the timeframe that is being analyzed, the four movements A, B, C, and D can always be found and be easily identified. This is because the price of an asset would always repeat these movements, and they tend to happen over and over again.
As traders, we need to practice this pattern and then refine our views in conjunction with the displacement of price and then get prepared in order to meet all conditions to enter the market. However, this pattern cannot be used alone as it is not enough to be used for trading purposes, but it is important that traders learn how to recognize the AB = CD movements.
How to Identify AB = CD Patterns
For AB = CD Bearish
To get a signal for an upcoming bearish setback, the price of the asset must be in an upward movement, and the 4 points to be located must be when the current momentum of the market is bullish.
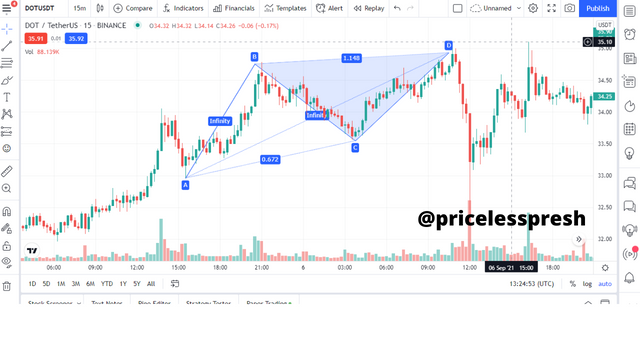
Next, the 4 points identified that are going up in price have to be verified, because this is one of the criteria for the successful execution of the strategy. To make this happen Fibonacci Retracements would be used. Movement A and B should have no secondary movements that go beyond it.
- Where C is located must always be higher than where A is located and on the Fibonacci retracement indicator, C must be between 61.8% and 78.6% of the movement AB.
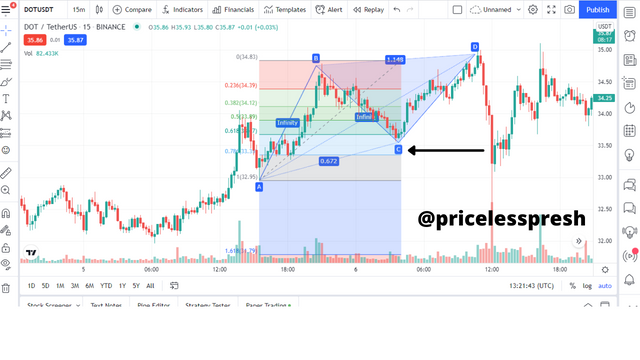
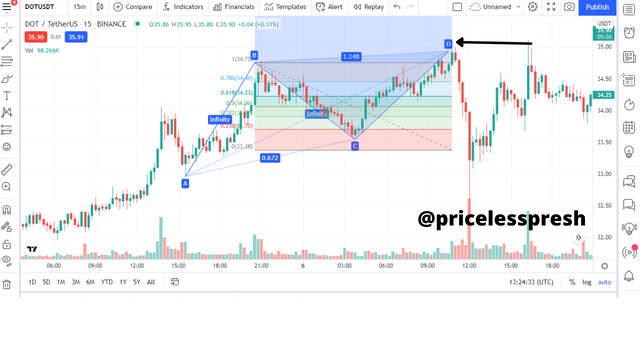
- On the Fibonacci retracement indicator, D must be between 127.2% and 161.8% of the movement BC.
For AB = CD Bullish
To get a signal for an upcoming bullish movement, the price of the asset must be at a downward movement, and the 4 points to be located must be when the current momentum of the market is bearish.
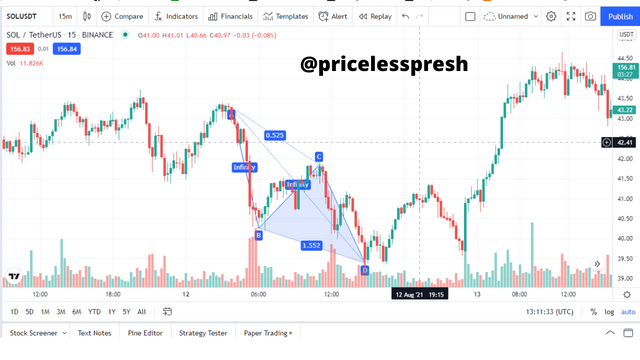
Next, the 4 points identified that are going down in price have to be verified, because this is one of the criteria for the successful execution of the strategy. To make this happen Fibonacci Retracements would be used. Movement A and B should have no secondary movements that go beyond it.
- Where C is located must always be lower than where A is located and on the Fibonacci retracement indicator, C must be between 61.8% and 78.6% of the movement AB.
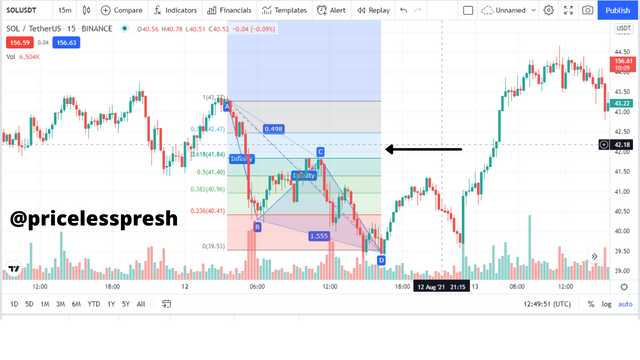
- On the Fibonacci retracement indicator, D must be between 127.2% and 161.8% of the movement BC.
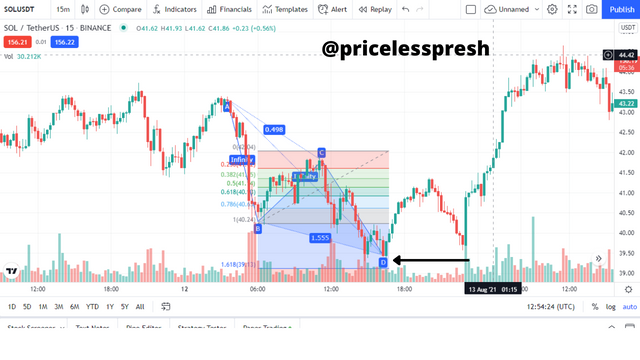

Clearly describe the entry and exit criteria for both buying and selling using the AB = CD pattern?

Entry and Exit Criteria for Harmonic Trading
To begin we identify the 4 points A, B, C, and D to start the process.
Then we confirm that C is between 61.8% and 78.6% of Fibonacci Retracements and D is between 127.2% and 161.8% to verify the 4 points. If C and D are not between the Fibonacci retracement levels, then the 4 points must be discarded.
When we have confirmed that point D is between the Fibonacci retracement levels:
For AB = CD Bearish
We enter the market when the price begins to form a bearish candle. Then we place our Stop Loss with 2-3% above point D and our take profit at 2-6% below point D. Our risk to reward ratio should be between 1:1 or 1:2. The black arrow represents the entry point, the red arrow represents the point where the profit is triggered and the green arrow is the point where the losses incurred are stopped. This is due to the position being entered, a sell position.
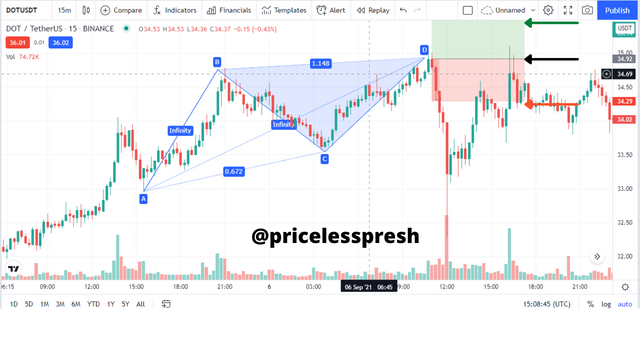
For AB = CD Bullish
We enter the market when the price begins to form a bullish candle. Then we place our Stop Loss with 2-3% below point D and our take profit at 2-6% above point D. Our risk to reward ratio should be between 1:1 or 1:2. The black arrow represents the entry point, the red arrow represents the point where the stop loss is triggered and the green arrow is the point where the take profit is triggered.
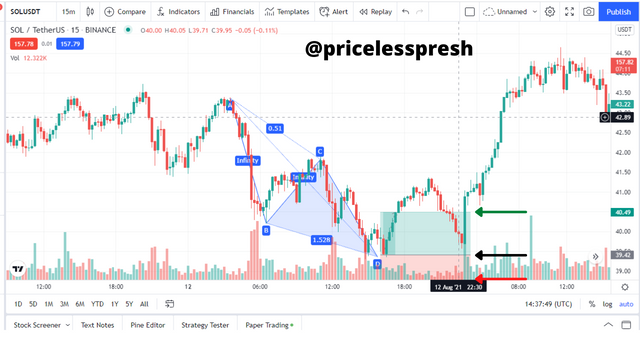

Make 2 entries (Up and Down) on any cryptocurrency pair using the AB = CD pattern confirming it with Fibonacci.

In making an entry into the market, it is important to follow the procedures that are necessary to execute the harmonic trading technique.
AB = CD Bullish Entry
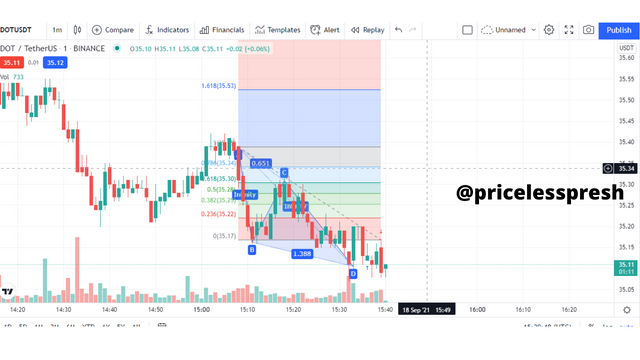
I identified the four points A, B, C, and D, then I confirmed if point C is between 61.8% and 78.6% of the AB movement. Point C was found in between 61.8% and 78.6% of the AB movement. I used the Fibonacci retracement indicator to achieve this.
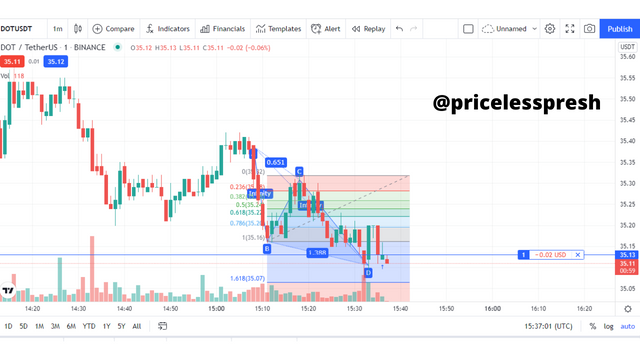
I then checked to confirm if point D is between 127.2% and 161.8% of the BC movement. Point D was found in between 127.2% and 161.8% of the BC movement. After the confirmation, I made a buy entry. The entry point was a little bit late as the market moved while checking for confirmations.
.png)
The position lasted for seconds, during that time I was able to make some profits. Though the profit I made was insignificant.

Conclusion

Employing the Harmonic trading pattern gives a precise way to trade because of its mathematical influence, but traders who intend to use this method are required to be patient, then also practice and study a lot to master the patterns. The basic measurements are just a start. And movements that do not follow the pattern measurements properly make the A, B, C, and D patterns invalid. Traders should be careful at this point when making decisions so as not to be led astray.
Note: All images used for illustration of harmonic trading are from trading view.
Special mention:
@lenonmc21
@awesononso
@reminiscence01
@reddileep
@pelon53
@fredquantum
