
1- Define in your own words what a contractile diagonal is and why it is important to study it. Explain what happens in the market for this chart pattern to occur. (screenshot required / Bitcoin not allowed)

A Contractile Diagonal is a trading technique that involves the formation of a wave pattern and recognition of the wave pattern on the trading chart. As the name implies, the wave pattern forms in a manner that the price through the candlesticks begins to contract as the price continues to move following a 1, 2, 3, 4, 5 wave pattern. The movement can either be a bullish one or a bearish one. It then reaches a point after contraction that the price reverses in its movement. When the waves have reached point 5, diagonal lines are drawn at the different points to verify the legitimacy of the pattern and also to give an indication of where the price is going to break to change its direction. They also act as a kind of support and resistance line.
In the pattern, waves 1, 3, and 5 show the enthusiasm of the market as they are the market's movement impulse in the direction where the market is going, while waves 2 and 4 show the price retracements. Once these patterns are found out, it gives a signal that the market is about to change direction. This new direction is confirmed when the price breaks away from the diagonal lines formed. It is very necessary for traders to study contractile diagonals because it is a very solid trading technique to use as part of their trading strategy. When studying the technique, they should follow strictly the criteria needed in contractile diagonals.
When the contraction period comes to an end, the price is expected to break away from the structure and move in the opposite direction. For instance, if the contraction is a bullish one, it would break the structure downwards and the market position to take is a short position. Conversely, if the contraction is a bearish one, it would break the structure upwards and the market position to take is a long position.
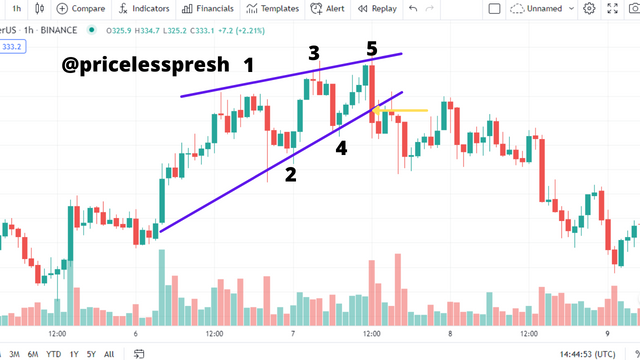
From the image above it can be seen that the waves pattern showed up. This is a bullish contraction that occurred. Wave 1, 3, 5 showed the market's impulse, while 2 and 4 showed price retracements.
The two purple lines are the diagonal line drawn to connect the impulse waves (1, 3, 5) and the retracement waves (2 and 4) points. After the formation of the contraction pattern, the price reversed in its movement. This is indicated by the yellow arrow which shows when the price broke away from the diagonal line and moved in a downward movement.
2- Give an example of a Contractile Diagonal that meets the criteria of operability and an example of a Contractile Diagonal that does NOT meet the criteria. (screenshot required / Bitcoin not allowed)

In order to have a legitimate Contractile Diagonal, certain criteria requirements in the length of the waves must be met.
The criteria requirements are:
- The wave formed at point 1 must be larger than the wave formed at point 3.
- The wave formed at point 3 must be larger than the wave formed at point 5.
- The wave formed at point 2 must be larger than the wave formed at point 4.
- The first diagonal line trace must touch points 1 - 5.
- The second diagonal line trace must touch points 2 - 4.
- The two diagonal lines should converge or be seen to intersect each other at some point.
We would be using these criteria to see the contractile diagonals that meet it and the contractile diagonals that do not.
Contractile Diagonals That Do Not Meet The Criteria
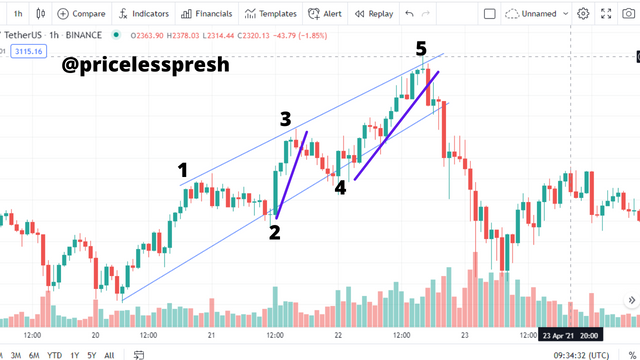
The image above gives an illustration of a contractile diagonal pattern that does not meet the criteria. It fulfills criteria 1, 3, 4, and 5, but criteria 2 and 6 it doesn't fulfill. Wave 1 is larger than wave 3, but wave 3 is smaller than wave 5. Also when the diagonal lines were drawn, they didn't converge. The purple lines show the length of waves 3 and 5. The blue thin lines show the diagonal lines drawn.
Contractile Diagonals That Meets The Criteria
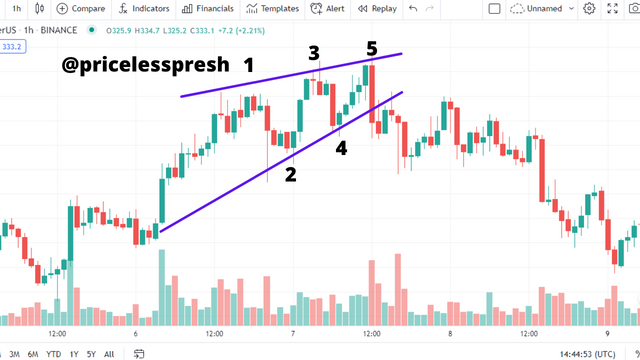
The image above gives an illustration of the contractile diagonal that fulfill the requirements. The criteria requirements for the waves have been met. Wave 1 is larger than wave 3, and wave 3 is larger than wave 5. Wave 2 is also larger than wave 4. The first diagonal line which is represented by the purple line above touched the waves points 1, 3, and 5. The second diagonal line which is represented by the purple line below touched wave points 2 and 4. Finally, the two diagonal lines converged and seem like they would intersect at some point.
3- Through your Verified exchange account, perform one REAL buy operation (15 USD minimum), through the Contractile Diagonal method. Explain the process and demonstrate the results and graphical analysis through screenshots. Your purchase data must match your analysis data: such as cryptocurrency and entry price.

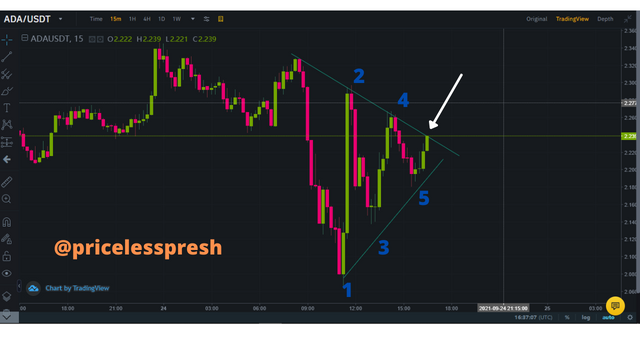
I was able to spot an ongoing formation of the Contractile Diagonals formation. The cryptocurrency pair is ADAUSDT and the timeframe is 15 minutes The waves 1, 2, 3, 4, and 5 were fully represented. Then I checked if the waves criteria were met, I saw to it that they were met. So I decided that my entry point is going to be during the break out from the diagonal line above. The white arrow indicates my entry point.
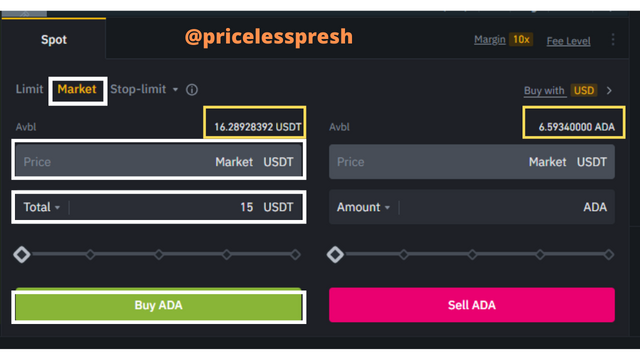
On the transaction interface, I moved from Limit to Market because I wanted to place a Market Buy Order. The price was at Market, meaning the price at which the market maker offers. Then I input the amount of USDT I wanted to buy. I put a total of 15 USDT. Then I clicked on Buy ADA.

This is the details of the account history. The price at which I bought ADA was at 2.243. The amount of ADA I got for buy with 15 USDT is 6.6. Finally, the order was Filled because it was a market order. I had a total of 31.28928392 USDT and when I placed the buy market order it changed to 16.28928392 USDT. The amount of ADA available is 6.69340000 ADA.
.png)
The result of the signal proved to be a successful one. The market continued to move in a bullish direction. The Stop Loss was placed at the point where wave 5 is located and the Take Profit is placed at the point where wave 2 is located. The light green line indicates the take profit point and the purple line indicates the stop loss point.
4- Through a DEMO account, perform one sell operation, through the Contractile Diagonal method. Explain the process and demonstrate the results and graphical analysis through screenshots. Bitcoin is not allowed.

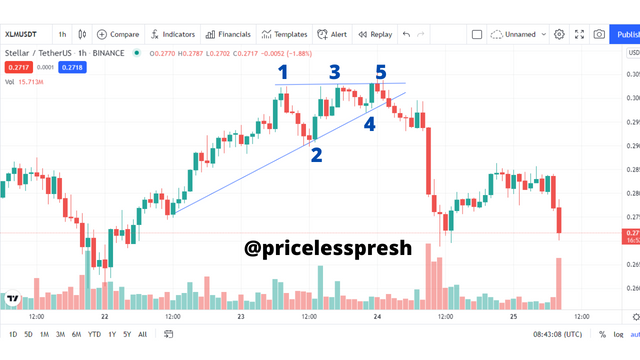
I spotted a formation with the contractile diagonals pattern. The chart above represents XLMUSDT for 1 hour. After spotting the formation I checked to confirm the Waves Criteria. After checking and confirming the waves criteria, I decided to open a Sell Position.
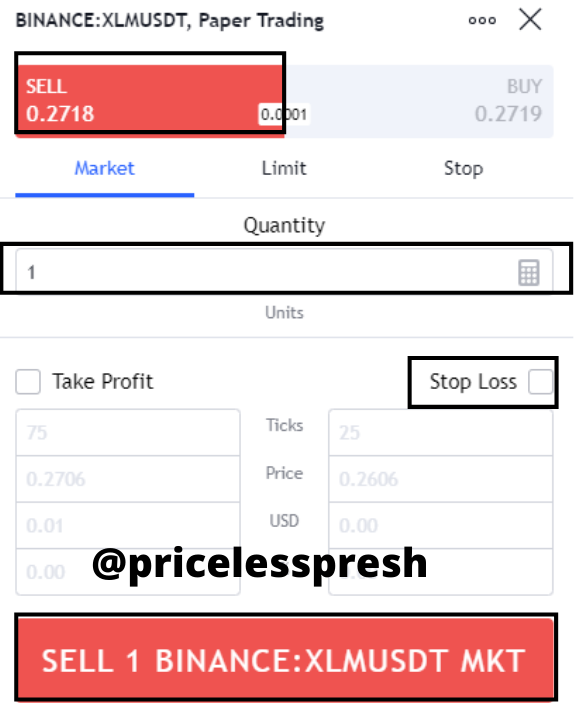
I placed a SELL Market Order for the transaction. At the order interface, I moved from Limit to Market. Then I put the order on SELL. I left the Quantity at 1 for this demo exercise. I placed the Stop-Loss, by clicking on the tick icon beside Stop Loss. Finally, I clicked on SELL 1 BINANCE: XLMUSDT MKT.
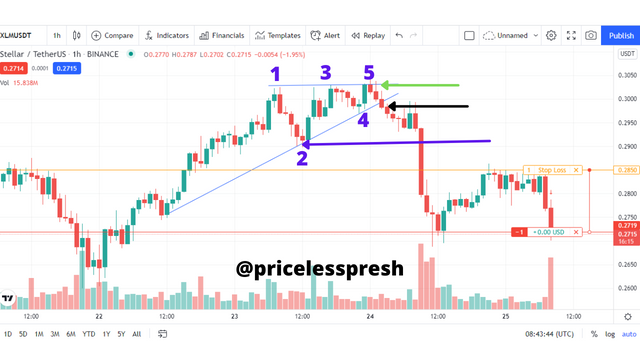
For this illustration, the market entry was very late, and the stop loss and take profit region was not correct. I placed the market order at 0.2718 USDT, while the stop loss was placed at 0.2850 USDT. At the time of doing this exercise, most of the patterns I found out were either at this level, meaning the market had moved or they did not follow the waves criteria fully.
However, for the sake of this exercise. The ideal market entry (sell) should be at the point where the price breaks from the diagonal line below. That is the line drawn to connect waves points 2 & 4. Then the stop-loss should be located at wave point 5 and the take profit should be located at wave point 2. On the chart, the market entry is represented by the black arrow, the stop-loss level is represented with a light green arrow, and the take profit is represented with the purple arrow.

This is the details of the open position. It shows the side the position was opened, the entry price, stop loss, profits made, the number of positions opened, the number of orders given, and the quantity of the asset bought or sold.
5- Explain and develop why not all contractile diagonals are operative from a practical point of view. (screenshot required / Bitcoin not allowed)

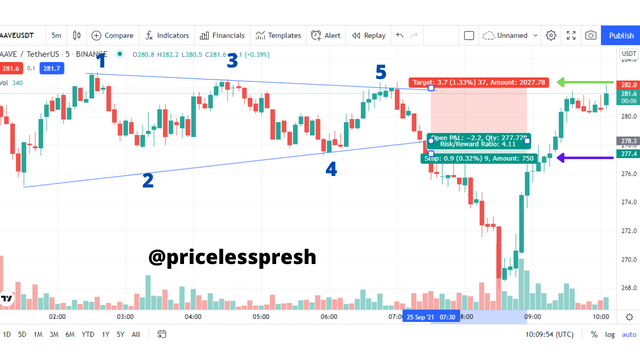
There are some contractile diagonals that have followed the criteria for the 1, 2, 3, 4, and 5 wave patterns to form. But if you look deep into the details of the trade, it is noticed that the stop-loss margin is greater than the take profit margin. This makes the Risk to Reward ratio (R: R) to be more, therefore making the trade to be very risky.
From the chart above, it is seen that the risk margin is greater than the take profit margin. The risk point is represented by the light green arrow and the take profit point is represented by the purple arrow. Therefore it is advisable that this contractile diagonal should be discarded after doing the risk to reward check.
CC:
@allbert