Greetings to all
How's everything going on. I hope you're all doing very well. Today I'm writing homework task for professor @nane15 which is about
Basics to trade cryptocurrencies correctly
Let's Start.

.png)
Explain your understanding of charts, candlesticks, and time frames.
.png)
There are many tools in the financial market that allow traders to make trading decisions in the market. Basic analysis has some limitations as it does not reflect supply and demand in the market. And there is no way to analyze past prices to predict future prices. For your part, technical analysis is a very important analysis tool, especially for retailers, to help you predict future prices. Some of the technical analysis tools available in the market are described below.
Chart
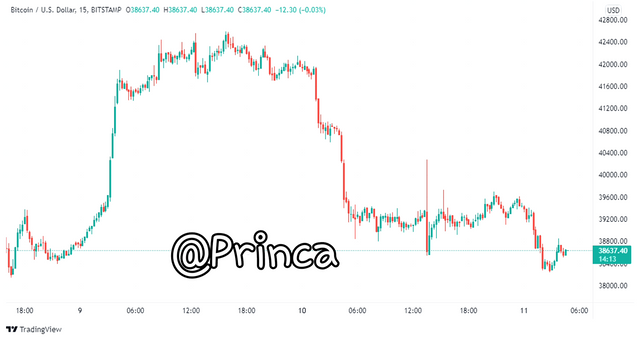
It is a pictorial representation of the activities and events taking place in a crypto asset, including the demand and supply of assets driven by the psychology of traders. It helps traders to identify key levels and understand current market trends.
The chart is the basis of technical analysis for analyzing and predicting future prices. Traders look for different price information such as chart patterns, levels of support and resistance, price reversals, etc. for trading purposes. There are many types of charts in the financial market including line charts, candle stick charts, bar charts, hackneyed ashes, holo candles and more.
Source Tradingview
Candlestick
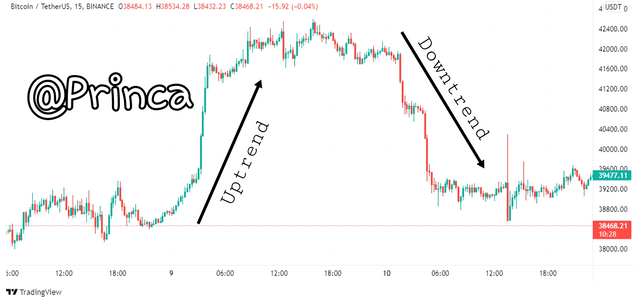
Analyzing the anatomy of the candle, a bearish (red) candle can be identified which indicates that the sellers dominated the price during this period. In addition, there is a bullish candle (green) indicating that buyers dominated the price during this period.
It is important to note that the Bullish candle indicates that the price has closed above the initial price within the period that indicates an interest in buying the asset. The bearish candlestick, meanwhile, means that the price has closed below the starting price, which means that sellers dominate the market.
Source Tradingview
Time frame
The time variable is important for analyzing the market, and so we can adjust it to find out how an asset has behaved, for example, a month, a week, an hour or 15 minutes. This time frame allows the trader to have a broader view of what is happening, identifying a trend or points of support or resistance.
Understanding the time frame is key in a crypto market and it depends on the trader's strategy. The timeframe represents a specific time during which the market traded. Which can be monthly, weekly, daily, from 1 hour to 1 minute. For example, using a candle stick chart, the formation of a candle stick represents the trading activity over time. Let's take a look at the next day's time frame.
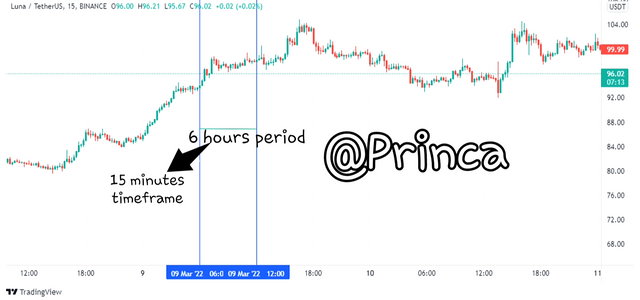
Source Tradingview
.png)
Explains how to identify support and resistance levels.
.png)
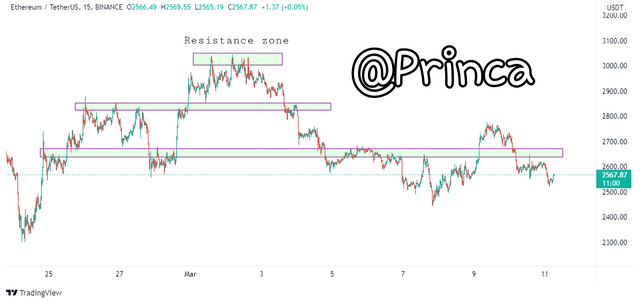
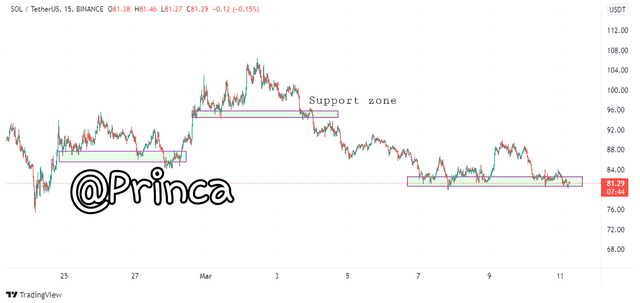
We can find the levels of resistance and support, the levels where the price refuses to rise and the levels where the price stops falling.
We can see the areas where the price is reluctant to rise, the price returns when it reaches that area. The more times the value touches this zone, the more relevant the zone becomes.
Similarly, support levels will observe that the price, when it touches this zone, does not decrease much and moves in the opposite direction. The more times the price reaches and returns to this area, the more relevant it is.
.png)
Identifies and flags Fibonacci retracements, round numbers, high volume, and accumulation and distribution zones.
.png)
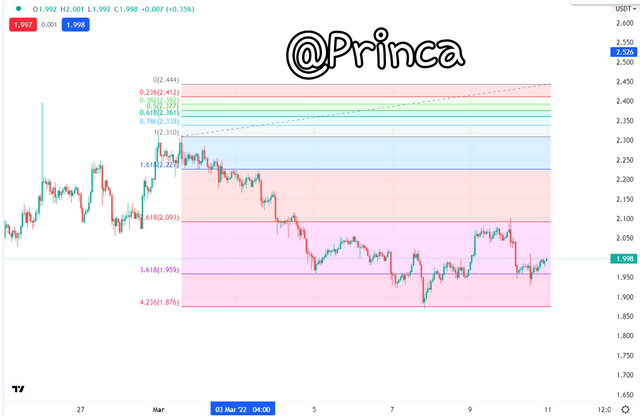
Fibonacci retracement
In a trending market, the price moves in a zigzag pattern that fluctuates as it moves up or down. There are large momentum movements and pullback movements that are in the opposite direction of the original trend. Retaliation is the result of an opportunity for traders to make a profit and enter the market at a lower price.
The Fibonacci Retracement Tool is a technical analysis tool that helps identify reversal points in the market. There are several levels in this tool where the price is likely to return after the pullback. For an uptrend, the Fibonacci tool pulls from the previous low to the current high
To pull back we are going to identify the first trending wave and increase the momentum from the beginning to the end. We can help you with the Fibonacci Retracement extension to keep your stop loss and take profit.
We must remember that these levels represent market sentiment, and these behaviors are repeated over time. The most important levels are 38.2%, 50% and 68.1%. Each represents the first 1/3, ½ and 2/3 of the market.
Round numbers
There are areas where you can wait for orders to be executed, they are mostly round number orders, ie nature and human instinct always lead us to round numbers, so get out in such areas and make a profit. Most traders think of an easy way to identify key levels on a chart, especially when taking stop loss and profit positions. Tech profit and stop loss positions are known as exit points in the market which trigger price fluctuations in the market. Most traders prefer to choose a stop loss or a profit of 420 over 421.68. Due to the sentiments and psychology of traders adopting similar round numbers, we see price reaction at these levels as tech profit positions are triggered.
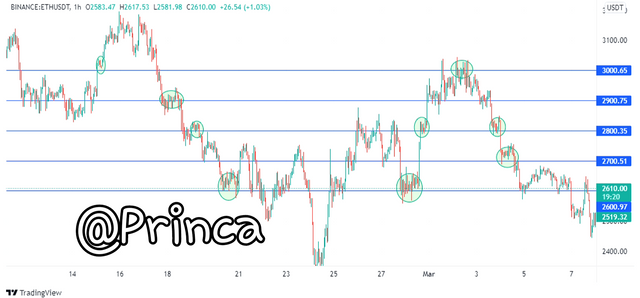
Source Tradingview
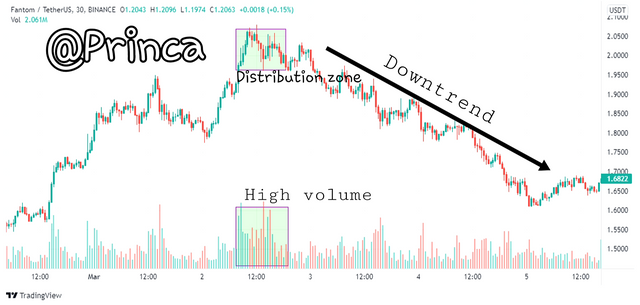
High volume, Accumulation and Distribution
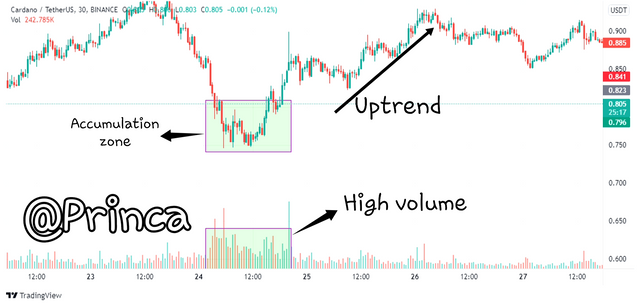
Volume is a chart indicator that shows the level of cash flow in the market and the cash outflow from the market. There are points in the deposit and distribution market where cash inflows increase and cash outflows increase. The high volume associated with the accumulation and distribution zone helps merchants identify cash flow in and out of an asset.
Deposit zones refer to low points in the market where cash flows as the market wheel increases, and investors have kept enough money to increase asset demand and thus, create an upward trend.
Distribution zones refer to high market areas where cash outflows increase as the market wheel and investors have withdrawn large sums of money to advance the supply of assets and thus, create a downward trend.
.png)
Explain how to correctly identify a bounce and a breakout.
.png)
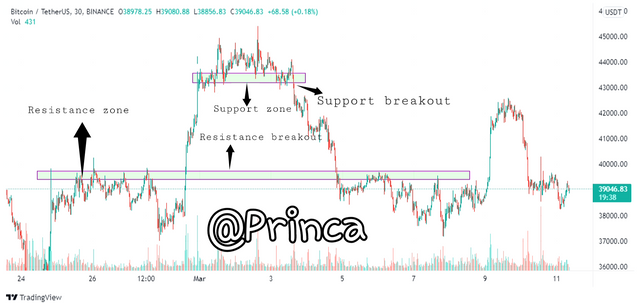
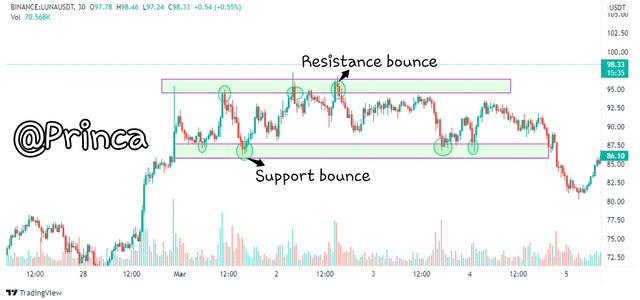
Once we have identified our support and resistance zones, we will be able to observe price increases or breakouts in these zones.
Rebound refers to the price that goes back to those levels and stops moving below that area.
A breakout can be identified as a movement that breaks an area and closes above it. If not, it is not considered a break.
You will see how the price touches the levels and goes back when it closes below. We can say the area remained strong and it rejected the movement, forcing it to retreat. And breakout when the price breaks this zone and closes above it. There may be breakout zones that change the trend or keep the trend going.
.png)
Explain that it is a false breakout.
.png)
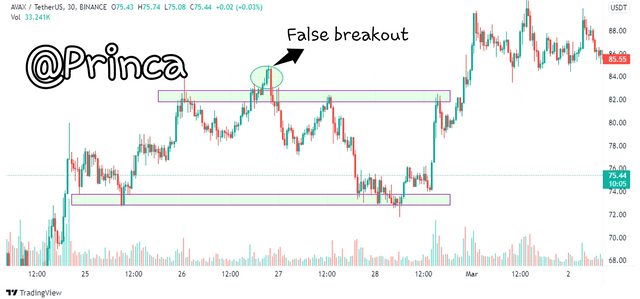
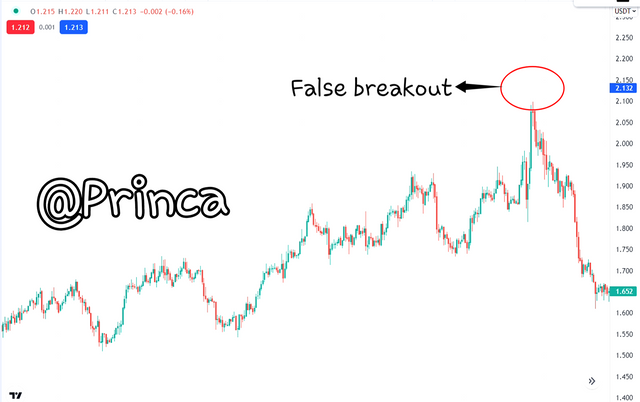
Trading at support and resistance levels is difficult and risky, as big players manipulate prices at these levels primarily to create liquidity. In general, the price is expected to return to key levels. A large number of retail traders place sell orders on resistance and buy orders at support levels. Damage prevention for these orders is placed above and below the levels. The price is then seen rising above a level to reach the staples placed above and below these levels.
This breakout will force retailers to move out of their positions to open a buyout trade in the direction of the breakout. After that, the price appears to return to the broken level, forcing them out of the market again. The chart above shows an example of an incorrect breakout, which traders can avoid by waiting for a bounce before acting on a position.
.png)
Explain your understanding of trend trading following the laws of supply and demand. Also explain how to place entry and exit orders following the laws of supply and demand.
.png)
Market sentiments are presented to us visually, we can analyze these sentiments on our chart and trade in favor of the trend. This supply-demand relationship determines the value of an asset.
The downtrend will be a disappointing market, with sellers controlling it, so supply outweighs demand and prices fall as a result. An upward trend is characteristic of an optimistic market, controlled by buyers, so demand exceeds supply, which in turn increases asset prices. With the trend, it is always recommended to trade professionally.
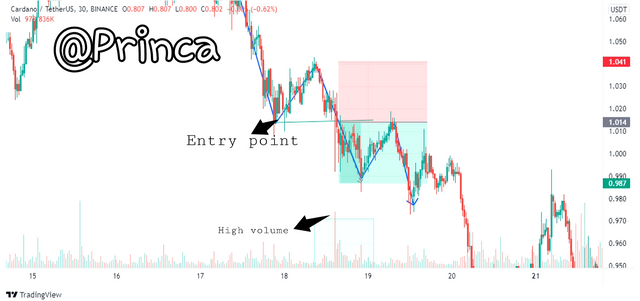
One way to register is that when we see the wrong breakout, remember that it is a trap for big investors, and there is usually a completely opposite movement after a false breakout.
After confirming an incorrect breakout, entry is established by placing stop loss levels above the last candle stick and keeping the take profit level below the previous support level.
.png)
Open a real trade where you use at least one of the methods explained in the class.
.png)

I'm using MT5 trading platform for my analysis.
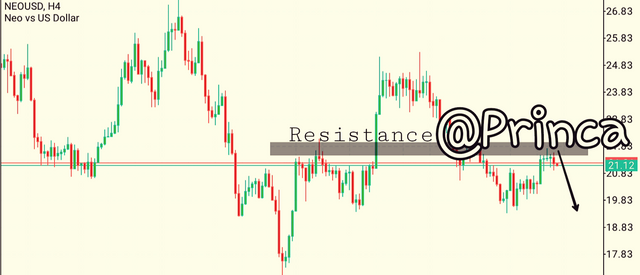
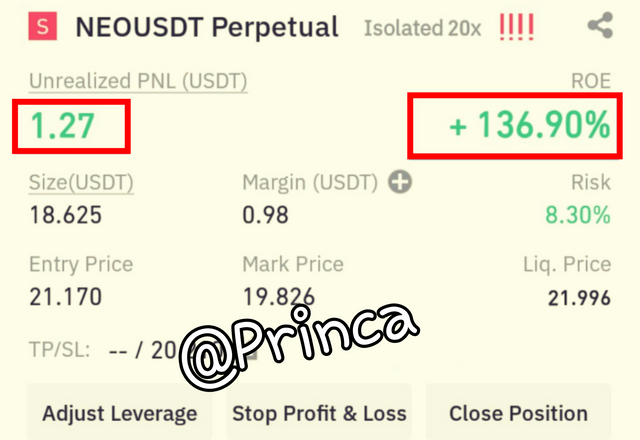
Looking at the above NEO / USD chart on a 4 hour time frame. I checked the progress of my trade and found that the price had increased significantly in the direction of my entry, confirming the accuracy of my analysis.
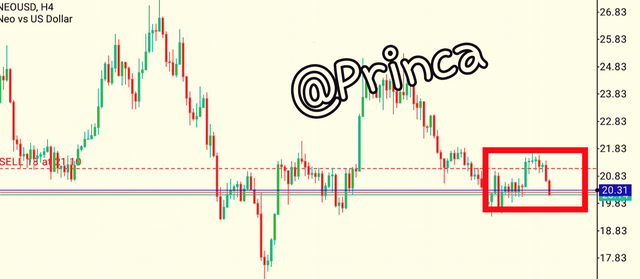
Well as you can see I made profit here.
Conclusion
The chart is a pictorial representation of the price data in the crypto market. Charts are tools that allow us to perform technical analysis of supply and demand dynamics. Charts are a very useful technical tool for currency analysis. Identifying support and resistance helps a lot, as it gives traders an idea of what to expect next, and at the same time allows them to catch the trend quickly, especially where the market is breaks down. Fibonacci retracement is used to understand retracement in the market, in crypto trading, replay is found mostly because price always bounces between support and resistance level, with the help of tools we can understand when the market bounces or retreats. Lastly I would like to thank Professor @nane15 for this stupendous lecture as it was very insightful.
