Greetings to all.
How's everything going on. Hope you're all doing well. Today I'm writing homework task for professor @abdu.navi03 which is about
CRYPTO TRADING STRATEGY WITH MEDIAN INDICATOR
Let's start

.png)
Explain your understanding with the median indicator.
.png)
The median indicator is a technical indicator that can be used to measure market direction and fluctuations. The median indicator shows the average value between high and low for a given period. This median is compared to its EMA for the same range length, the space between the median and its EMA is presented as a color cloud above and below the value, this is the moving average crossover. It works like this, when the middle color turns green it indicates upward movement and when it turns purple it indicates downward movement.
Technical indicators are tools that help us formulate trading strategies, and thus take advantage of the market, these markets are always moving in trends, there are downward trends, upward trends and background trends within the market. Some indicators help us to quickly guess where the market is. The median indicator can be used to create a trading trend with a strong trend and can be used with different time frames and different settings.
.png)
Parameters and Calculations of Median indicator.
.png)
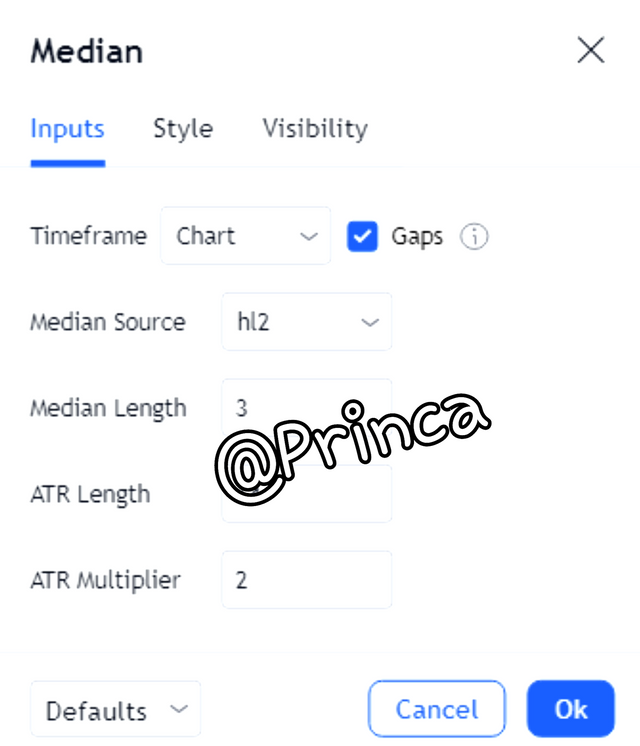
The median indicator works by calculating the difference between the median line and EMA over the same period as well as the percentage change in ATR. The following are the parameters to calculate for this indicator in TradingView:
Median Source: Here you configure the data source with which the average is calculated.
Median Length: The number of data points from the source used to calculate the median.
ATR Length: The mean time period of the average real range.
ATR Multiplication: The number of times ATR is multiplied before the band is formed.
These parameters can be seen in the Input section in the Indicator configuration panel. From there they can be adjusted to suit your preferences.
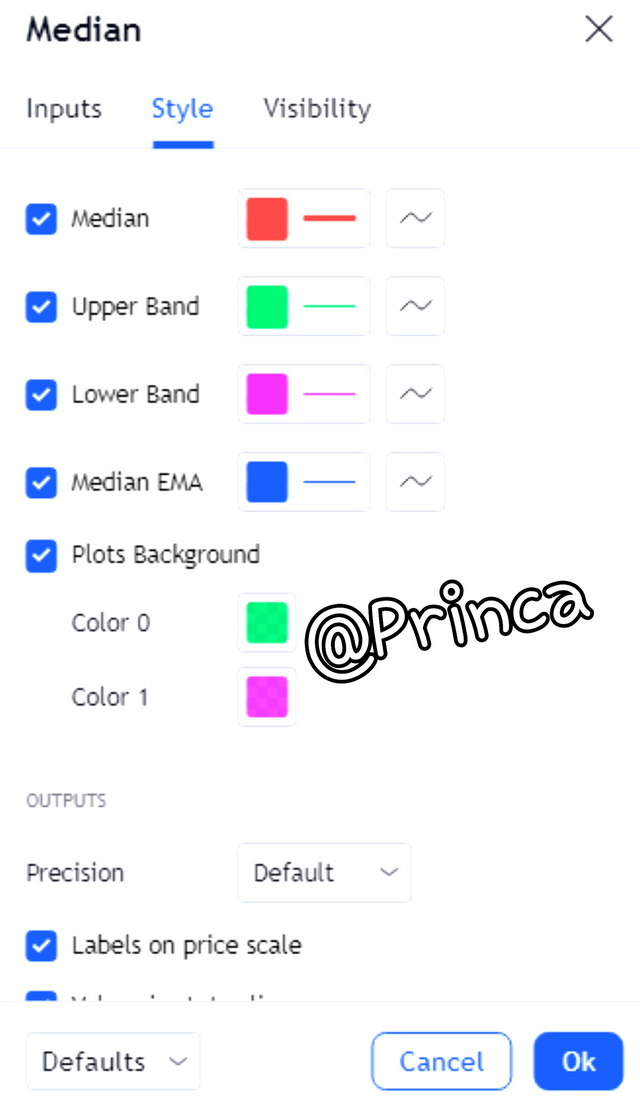
In the style settings you can change the color of the bands, the color of the median line, the color of the EMA line and the color of the clouds.
The formula for calculating EMA is as follows:
EMA = Closing Price x Multiply + Previous EMA x (1 - Multiply)
And finally, the way the indicator band calculates is as follows:
Upper band = Median length + (2 ATR)
Lower band = Median length - (2 ATR)
.png)
Uptrend from Median indicator.
.png)
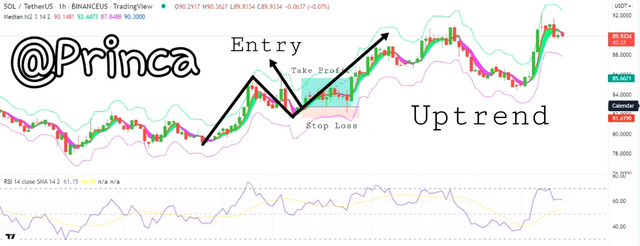
The Median Indicator, being a trend oriented indicator, is a very useful tool for the trader, as it allows a very easy way to indicate the direction of the price, it is necessary to meet it to identify the upward trend. If the median value is higher than the EMA value, this leads to the formation of a green band indicating that the trend is bullish and is perceived as a buy order signal.
As can be seen in the graph according to the pair, at the end of the downward momentum, the price turned and started moving upwards, this is due to the fact that buyers pushed the price higher, at that moment When we see the formation of a green band indicating that the price has started to move upwards, it is a sign of entry into the purchase order.
We can observe that when the bullish trend changes from bearish, the band turns purple to green, then we can wait for 1 or 2 candles to be formed to confirm the bullish speed and then may enter into purchase. Order to set the benefit ratio to risk 1: 1 or 1: 2.
.png)
Downtrend from Median Indicator.
.png)
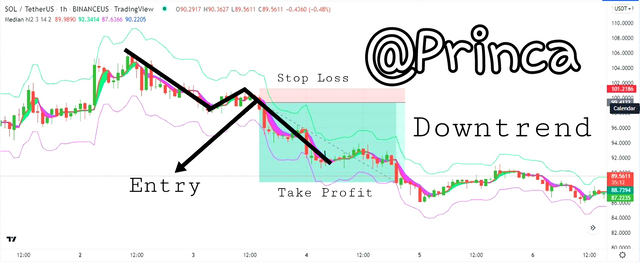
To indicate the downward trend we apply the same criteria mentioned above in reverse, in which case it should be noted that the value of median is less than the value of EMA, this causes formation of a purple band. Which indicates that the trend is down and is considered as a sell order signal.
As can be seen in the graph corresponding to the pair, the price, at the end of the upward trend, turned and began to move downwards, due to the fact that sellers pushed the price down. Pushed, at the moment we see the formation of a purple band which indicates that the price is moving downwards, this is a sign of entering the sell order.
We can observe that when the bearish trend reverses rapidly, the band changes from green to purple, then we can wait for 1 or 2 candles to form to confirm the bearish momentum and you can then place a sale order establish a 1: 1 or 1: 2 risk-to-benefit ratio.
.png)
Identifying fake Signals with Median indicator
.png)
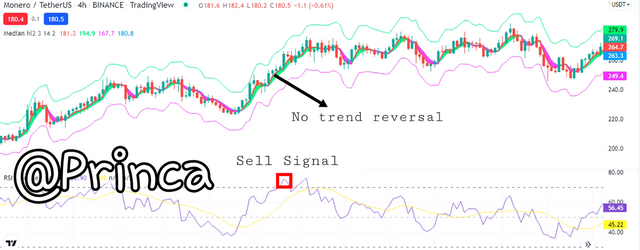
Median indicator signals are highly reliable, however, like all technical indicators, they are not 100% accurate, meaning they may show some incorrect signals, so it is always advisable to pair them with another. Technical indicators aimed at filtering out such signals that could jeopardize our investment.
None of the indicators give us a complete percentage of success. That is why the most recommended always use 2 different indicators which work with the fluctuations and speed of market movements.
I will use RSI indicator with median indicator to show them, you can see what I mean in the picture below.
As you can see in the picture above, 2 different situations are shown, which are considered as wrong signals, because if we use the same signal we will be affected by this single information, when we use 2 signals working together, we cannot decide if this is the right time to enter the market if 2 indicators do not show the same result for the trade.
.png)
Open two demo trades, long and short, with the help of a median indicator or combination that includes a median indicator.
.png)
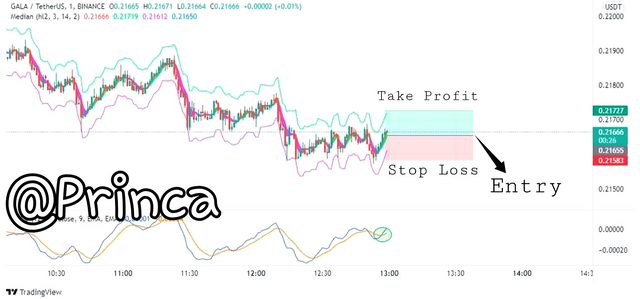
Buy operation
The graph shows us that we had to wait for the price to move above the midline to confirm the upward movement of the price in which I proceeded to make my entry where my risk management was thus placed. My stop loss this is lower than the rear candle and is equal to one distance from my tech proof stop loss which has a risk reward of 1: 1.
Source TradingView
Here I show you the history of my operation.

Source TradingView
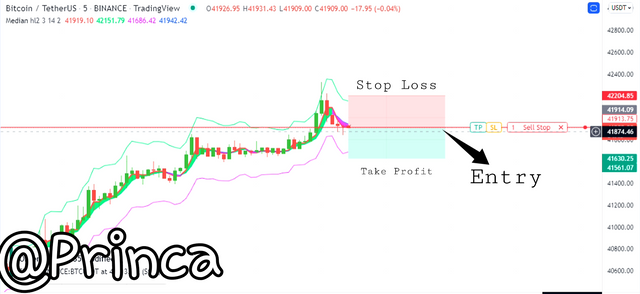
Sell operation
To carry out my sell operation, I waited below the midline of the price indicator to realize that the price movement would slow down. I decided to perform my operation when the indicator turned purple. I started to change, I had risk management. 1: 1 where I place my stop loss at the last maximum height level and take a profile at a distance equal to the stop loss.
Source TradingView
Here I show you the history of my operation.

Source TradingView
Conclusion
Median Indicator is a good tool for developing a trading strategy based on trends. It allows you to know the market fluctuations and its direction. It is useful to know the market trend and open trade in favor of this trend. It is worth mentioning that we should use it with any other indicator that helps us to filter the signals, in addition to any trading. The strategy that we want to implement in our operations, we must test it many times before risking our money. Lastly I would like to thank Professor @abdu.navi03 for this stupendous lecture as it was very insightful.

