Greetings to all.
How's everything going on. Hope you're all doing well. Today I'm writing homework task for professor @pelon53 which is about
Fibonacci Tools
Let's start.

.png)
Explain in your own words what you mean by Fibonacci retracement.
.png)
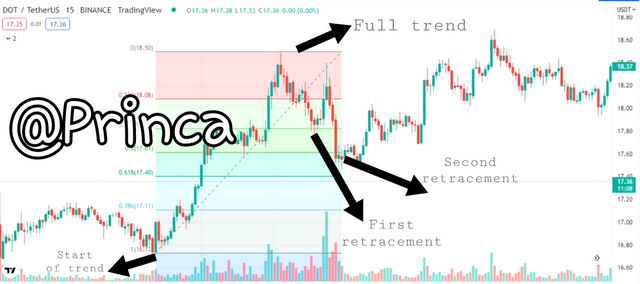
Fibonacci retracement is a very useful tool that allows us to estimate with a high percentage of success how far retracements can go in a trend movement. To use Fibonacci retracement, there must be a well-marked trend, whether bullish or bearish. There is no benefit to Fibonacci retracement in the sideway market.
It is designed as horizontal lines on the tool chart that act as support and resistance. Supports and resistances are calculated are based on the Fibonacci numbers, which are a numerical sequence proposed by Fibonacci, he proposes that a number is the sum of its previous 2 so that the Fibonacci sequence starts like this 1,1,2,3,5 ,8,13,21,34,55,89…….
By drawing we can identify the key levels of support and resistance when the price returns. This tool is based on the mathematical principles of the golden ratio or Fibonacci series.
When drawing Fibonacci retracement we take into account the minimum and maximum which are 0% and 100%, we also take into account the key levels of support and resistance where the price is likely to bounce on the retreat. These levels are based on a study of the Fibonacci series where we take significant percentages such as 23.6%, 38.2%, 61.8%, and 78.6%, and some that add up to 50%. It is a tool that plays an important role due to the wide range of information generated by this indicator.
.png)
Explain in your own words what you mean by the Fibonacci extension.
.png)
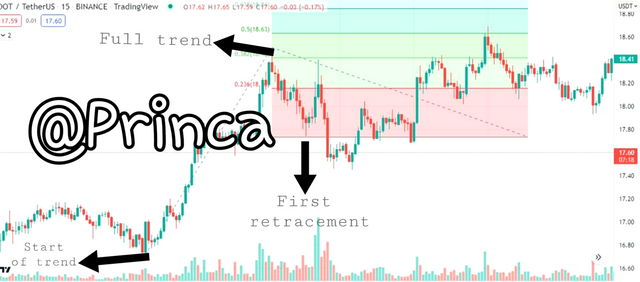
The Fibonacci extension is a technical analysis tool based on the sequence of numbers suggested by Fibonacci, as well as it throws out a chain of support and resistance that we can use and all is well, so the percentage will be 23.6. %; 38.2% 61.8% 50% and 78.6%. These help the trader to make a profit margin when the price is able to pull back.
This trend is seen when it is on the chart which shows the horizontal lines drawn on the price chart. This allows the trader to find the right way to enter the trade, which is very helpful in technical analysis as it is an excellent working tool.
.png)
Perform the calculation of the Fibonacci retracement, for the levels of: 0.618 and 0.236. Pick a crypto pair of your choice.
.png)
The calculation of Fibonacci Retracement levels follows the following calculations.
R1 = X + [(1 -% Retrace1 / 100) * (Y - X)]
X = initial value of the value from which the Fibonacci Retracement begins.
Y = maximum value of value where Fibonacci Retracement ends.
%Retrace 1 = 23.6%
%Retrace 2 = 38.2%
%Retrace 3 = 50%
%Retrace 4 = 61.8%
%Retrace 5 = 78.6%
R1 = X + [(1 - 0.236) * (Y - X)]
X = 19.55 USDT.
Y = 15.23 USDT.
Let us continue with the calculation
R1 = 19.55 + [(1 - 0.236) * (15.23 - 19.55)
R1 = 19.55 + (0.764 * 4.32)
R1 = 19.55 + 3.30
R1 = 22.85
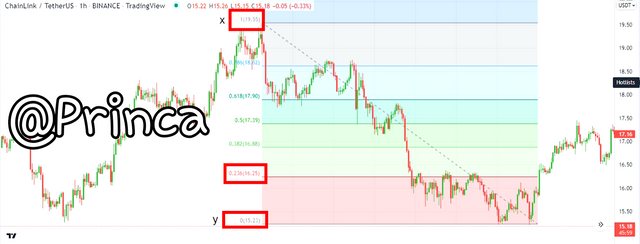
Source TradingView
Calculated with the level of 0.618
R = X + [(1 - 0.618) * (Y - X)]
Next data
X = 19.55
Y = 15.23
Calculate:
R4 = 19.55 + [(1 - 0.618) * (19.55 - 15.23)
R4 = 19.55 + (0.382 * 4.32)
R4 = 19.55 + 1.65
R4 = 21.2
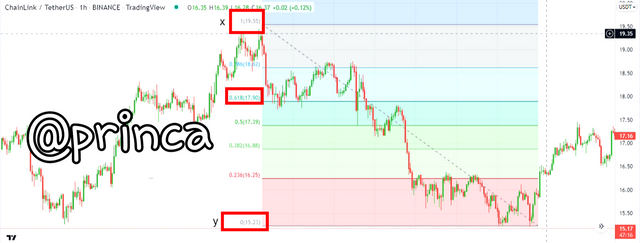
Source TradingView
.png)
On a Live account, trade using the Fibonacci retracement.
.png)

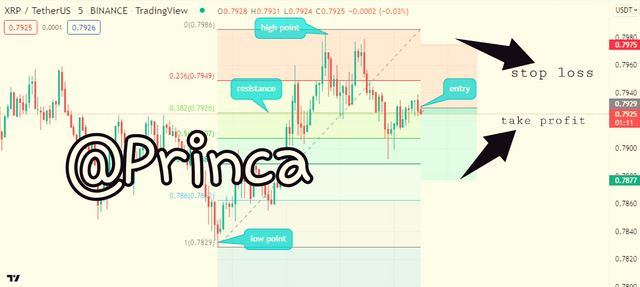
While looking at the clear low and high points on the chart, I decided to introduce the Fibonacci retracement tool which indicates the different levels of the Fibs chart indicating the possible support and resistance levels from each Fibs level. To concretize this, it can be seen that the 0.236 Fib level acts as a resistance if the chart is minimized to other short time frames and so on.
I then waited for the price to rise to this level before placing my sale order as I had anticipated a momentary decline thereafter.
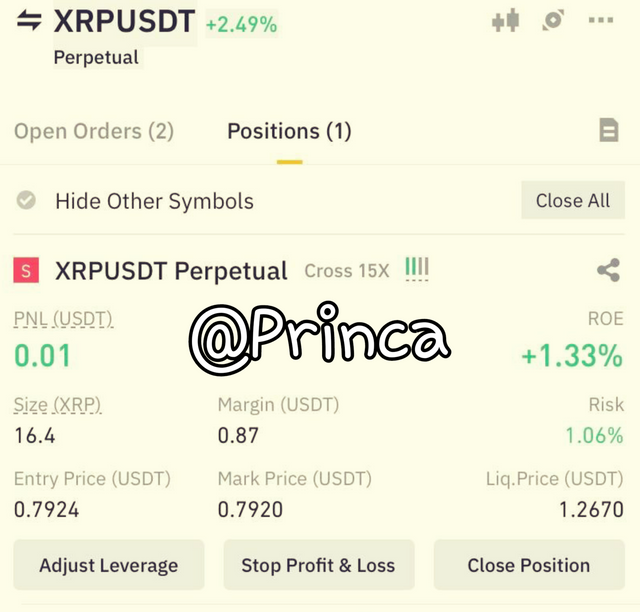
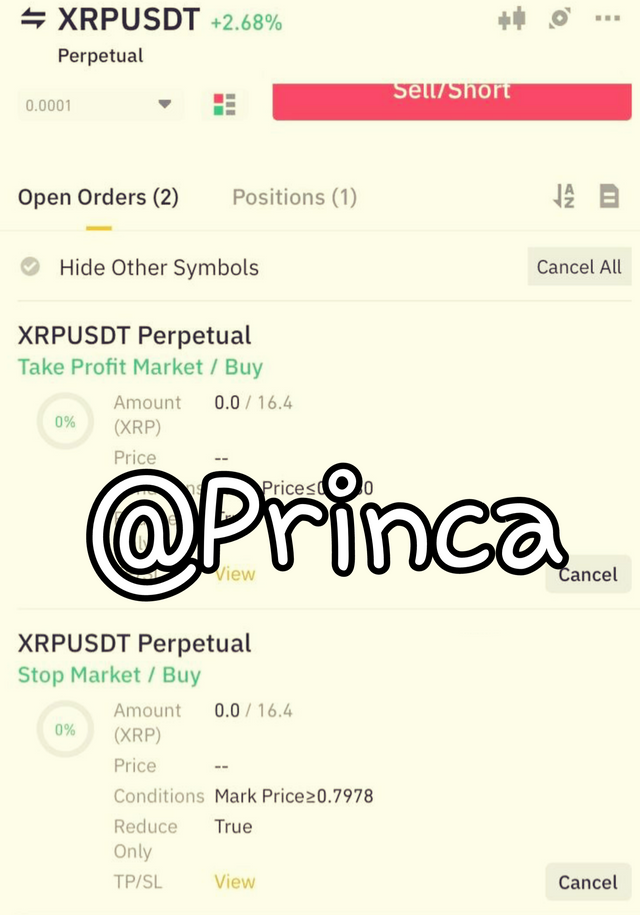
I used the concept of stop loss and tech profits that set them at $ 0.7975 and $ 0.7877, respectively, with a standard risk of at least a 1: 1 reward ratio of 15x leverage.
.png)
On a Demo account, trade using the Fibonacci spread.
.png)
Buy Order
Source TradingView
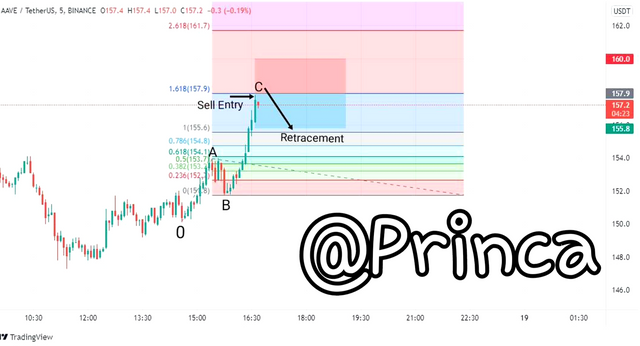
On the chart above, the price was trending upwards that recorded highs and lows and reached a new high (A marked) at the previous low mark 0 value. The price went up again and a new high was recorded. Fibonacci showed that the price estimate will end at the level of 1.618, acts as resistance. The level of 1.618 was chosen because, at this level, the price formed a bearish candle to indicate a reversal of the trend.
The stop loss was placed above the resistance level, and the risk of a 1: 1 reward ratio was used.

Source TradingView
Conclusion
Fibonacci tool is a fundamental and very important part for a trader where many aspects can be considered which help the trader to make the right decision while investing assets. Fibonacci tools show us significant levels of support and resistance where there could be a significant price movement and the opportunity to trade. Extension and Fibonacci retestation are both very useful technical analysis tools. Lastly I would like to thank Professor @Pelon53 for this stupendous lecture as it was very insightful.

