Hello Lovely People
I hope you're all doing very well. Today I'm writing homework task for professor @lenonmc21 which is about "Trading Strategy With VWAP Indicator".
Let's begin.


Explain and define in your own words what the “VWAP” indicator is and how it is calculated?

Volume Weighted Average is regarded as a continuous indicator, widely used and valued for its unique characteristics that distinguish it from other indicators. In addition to the recurring statistics, the offer, the analysis of the amount of money being discussed in the trading operations, is a basic contribution, which can be carried forward to anyone who knows how to handle it. , With the amount of data that can be conveyed. Analyze and identify the following trend movements more easily, then, the indications given by this indicator can be completely effective in any strategy.
It falls short of other indicators due to its success in following the trend, highlighting its correct average which gives value, similarly, it solves problems arising in others, always the same value. Remains at the level of as it is set, therefore, even if the period of time in which it is changed, it will remain at the same level of value, it should be remembered that it updates its data daily. Dates, a feature that is unusual for gestures. All of the above provide different trading options, keeping the trader in an equal position for his entire strategy.
It has the feature of having a formula to be able to count, it is made up of three essential values, which will be, the price, the amount of money discussed and the number of daily candles.
So How to calculate VWAP.
The formula is very simple, when we calculate it we should first have the value (P), the volume (V) and the number of candles (N) per day.
Then the formula will be
VWAP = (P + V) / N
So if we describe this formula orally; The price tag is added to the daily candlestick portion of the amount traded. In this way, the VWAP value is obtained. This formula is recalculated for each day.

Explain in your own words how the “Strategy with the VWAP indicator should be applied correctly?

If you know how to use indicators in your technical analysis, it will be very easy to include VWAP indicators in your chart. Because adding this indicator is like adding other indicators to the chart. Let's take a closer look at how we can add VWAP signals to the chart below.
Here we have to visit the Tradingview application as a technical analysis tool. For this reason, the VWAP indicator was included in the chart using Trading View in this query.
First, we go to Trading View and open any chart from there. I prefer the STEEMUSDT chart for this transaction.
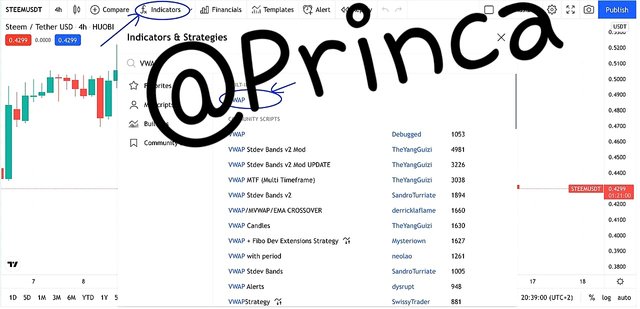
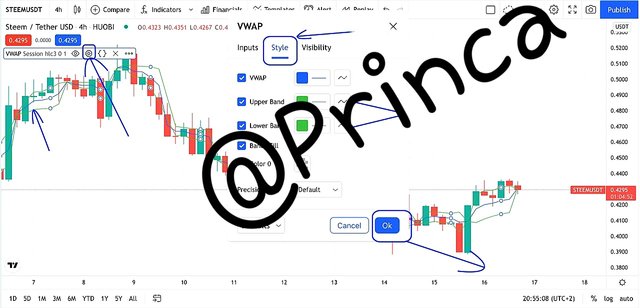
After opening the corresponding graphic, we click on the fx indicators on the top panel of page. Here we type VWAP in the search box. We click on the option VWAP. Thus, the indicator is included in our graph. In the next step, gesture settings will be made.In this section, we will make general indicator settings. First, we click on the indicator in Chart. Then we click on the settings icon at the top left of the graph. Here we select the Style tab. We deselect the upper band and lower band boxes that appear on the screen. Finally, we complete the process by pressing the Ok button.
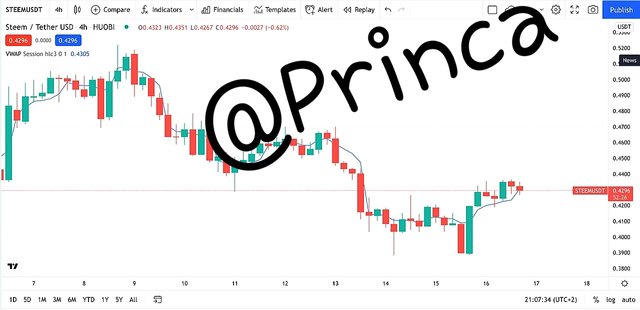
Source
The graph looks like this after the settings are completed. We can now start trading using the VWAP indicator.
Breakdown of Structure from Bearish to Bullish
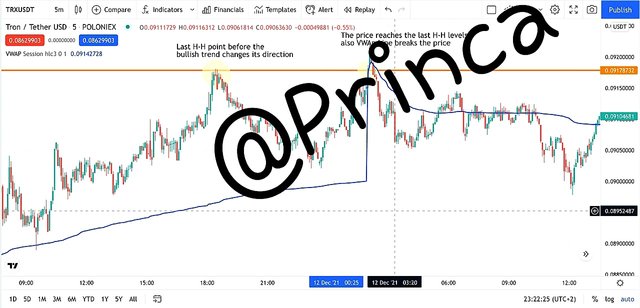
Here, first of all, we need to determine where the latest trends in our buying and selling situation are broken. If we are planning to buy we need to look for bearish trends, if we are planning to sell we need to look for bullish trends.
If there is a downtrend, we need to find the last low break point. In contrast, in the bullish trend, we need to find the point where the last highs are broken.
If the price reaches this point again and the VWAP line breaks the price, the direction of the current trend is expected to change.
Source
Retracement to the VWAP (Use of the Fibonacci)
In the next step, we will wait for the price to return. In our example, the price starts to rise after looking at the bottom. After breaking this low point, a Fibonacci Retracement will be prepared after the bullish trend. After pulling this Fibonacci Retracement, the levels of 50% and 61% are important and we should pay attention to these points. If the price is within this range and the VWAP line is broken, this is our entry zone.
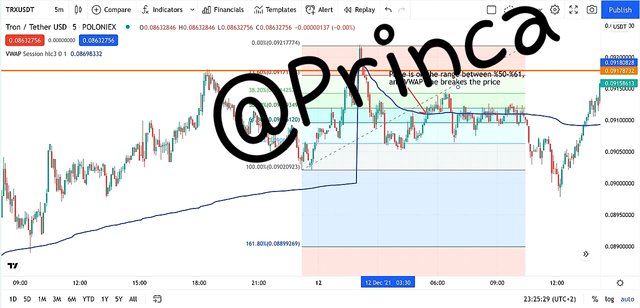
Source
Correct Management
Finally, stop loss and demand profit zones should be determined. While the stop loss is less than 61.8%, it is recommended that the stop loss for Tech Profit be about 1.5 times.
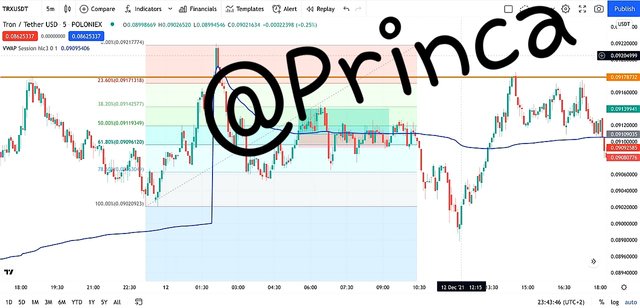
Source

Explain in detail the trade entry and exit criteria to take into account to correctly apply the strategy with the VWAP indicator?

There can be many factors to determine a strategy, however, strict adherence to its criteria will be the only one that will guarantee that it works, because of this, Should be met with maximum possible security, so it is recommended. These parameters as a guarantee for the operator; Below I will comment on the standards by which they should be governed.
The first parameter will consist of the breaking of the last maximum or minimum, using a safe method to warn of this, as seen in the previous chart that a line was drawn as a resistance, later Indicating its break, emphasizing that it can be seen. The minimum or maximum was exceeded, if not, it is advisable to wait another moment, where a better opportunity presents itself.
It will be necessary to use Fibonacci retracement to complete the operation, as well as to understand its levels, especially 50% and 61%, which will be the signal to start your operation in case of correction. And it comes into it. One is already named, on the other hand, starting from the last top, it will be important to implement it correctly on the chart, so that the correction made by the trend can be caught quickly. Like the other standard, if it does not meet, it is better to wait for a better opportunity.
In terms of management, this will be based on how we position "Stop Loss" and "Tech Profit", placing the first name below the indicator zone (50% and 61.8%) to reduce the price. Provide adequate security in case. ; Based on that, the second name will be placed on the "stop loss" of 1.5 more.

Practice
Make 2 entries (One bullish and one bearish), using the strategy with the “VWAP” indicator. These entries must be made in a demo account, keep in mind that it is not enough to just place the images of the entry, you must place additional images to observe their development in order to be correctly evaluated.

Firstly I will go for the Buy order
I used the BEAMUSDT pair's chartfor this.
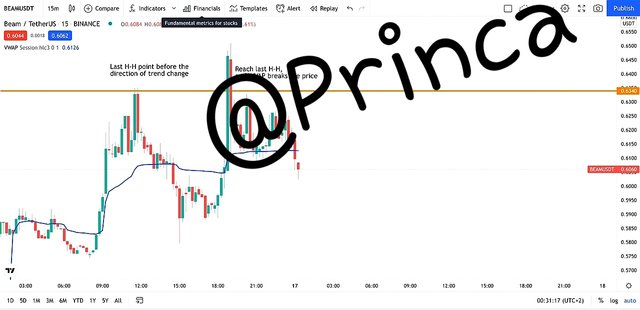
Source
In the next step, I determined the key points by drawing Fibonacci Retracement. As you may recall, while the 50% -61% band is important to us, we also see that the VWAP indicator has broken the price. So we got confirmation from the signal too.
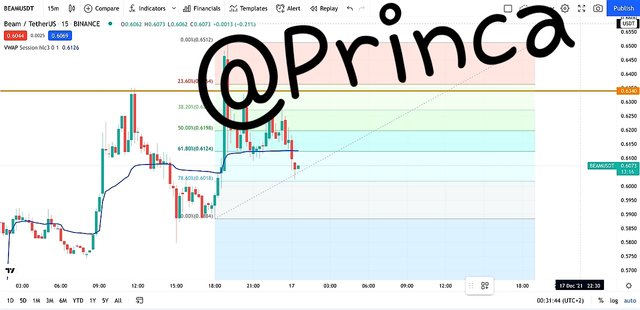
Source
Finally, profit and loss prevention zones were determined. Here, just below the 61% region, the stop loss (0.6063) will be set. Tech profit is calculated as 1.5 times the stop loss. The goal here was to get a 1: 1.5 ratio. At that time it was set at 0.6163.
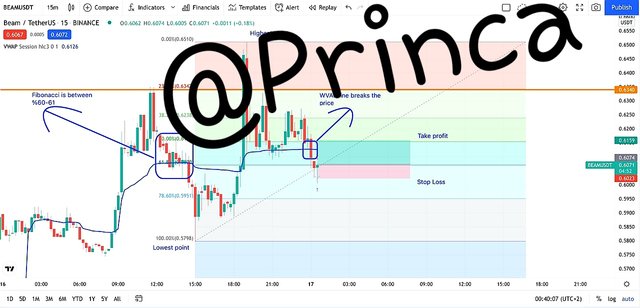
Source
A buy order was opened using Trading View's Paper Trading tool. Here, while the price was 0.6083, a buy order was placed at 0.6088. Naturally, the order happened immediately. The stop is listed as 0.6063 and the tech profit is listed as 0.6163.
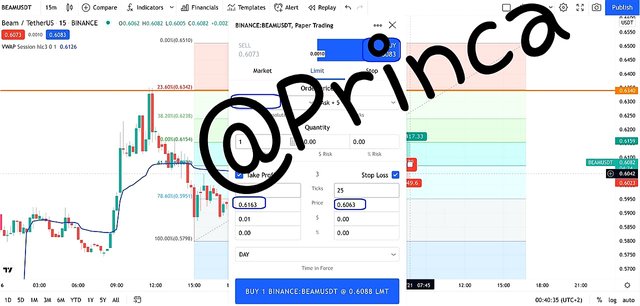
Source
Secondly I'll go for Sell order.
To register the sale, I choose the STEEMUSDT pair.
First, the breakdown structure was discovered. It is detected as follows.
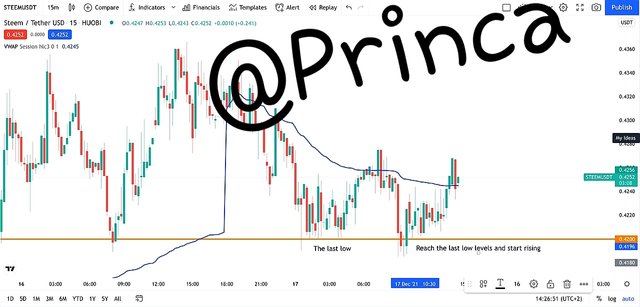
Source
In the next step, Fibonacci is developed. It has been observed that our price is in a critical region.
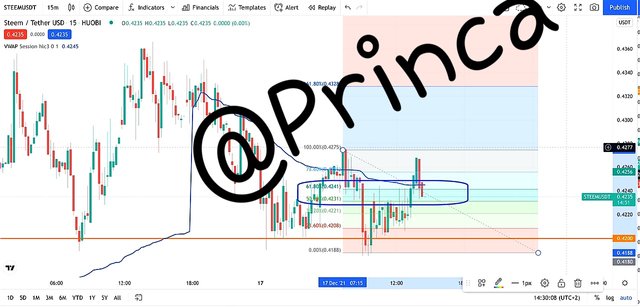
Source
The next step is to determine the stop loss and make a profit. The stop loss is slightly lower at 61.8%, and the tech profit is about 1.5 times the stop loss.
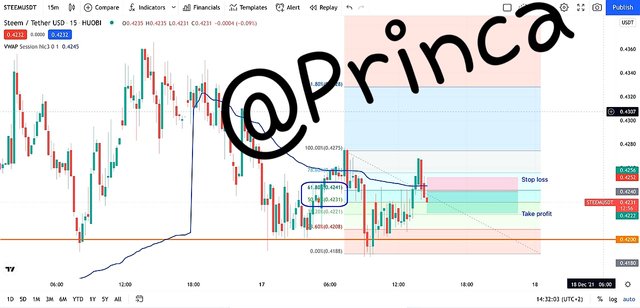
Source
After identifying these letters, a SELL order was created using Tradingview Paper Trading. While the price was 0.4228, the sell order was made at 0.4230. Tech Profit is set at 0.4155 and Stop Loss is set at 0.4255.
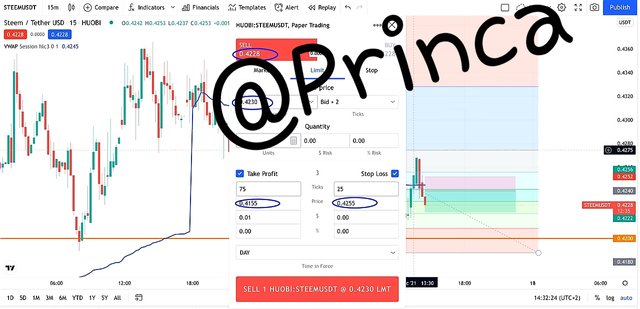
Source
Conclusion
We reviewed the VWAP indicator, which, like many other items, is used in crypto analytics. This is a special and unique indicator that has a great potential to remain the same regardless of the time frame changing from one form to another. It is an indicator where the average value is calculated based on the volume. This is an indicator that investors have a lot of confidence in because it is calculated using both volume and price.
I would like to thank Professor @lenonmc21 for this wonderful lecture.
.gif)
