Hello Steemians,
 Designed by me on Canva

So I will be using my MetaTrader 5 Demo account to identify the following candlestick patterns
- Bullish Engulfing Candlestick Pattern: This type of candlestick pattern is said to occur when a bullish candle (green) completely covers the previous bearish candle (red), usually indicating a bullish reversal, and that the market will be experiencing an uptrend in price movement. What this usually means is that buyers are currently taking over the market.
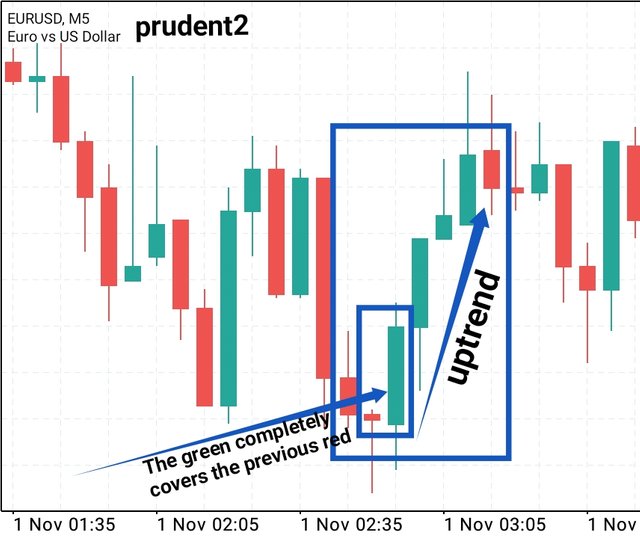
As you can see on the screenshot above, this is an EUR/USD pair chart, using a 5 minutes timeframe. And a bullish engulfing candlestick pattern occurred where the green candle completely covered the previous red candle. And after this formation, there was a bullish reversal, and an upward movement in price.
- Doji Candlestick Pattern: This type of candlestick pattern is said to occur when the market buyers as well as sellers are both pushing the market equally. So many traders regard this as a neutral phase in the market, because no one can decide the direction of the market at this stage.
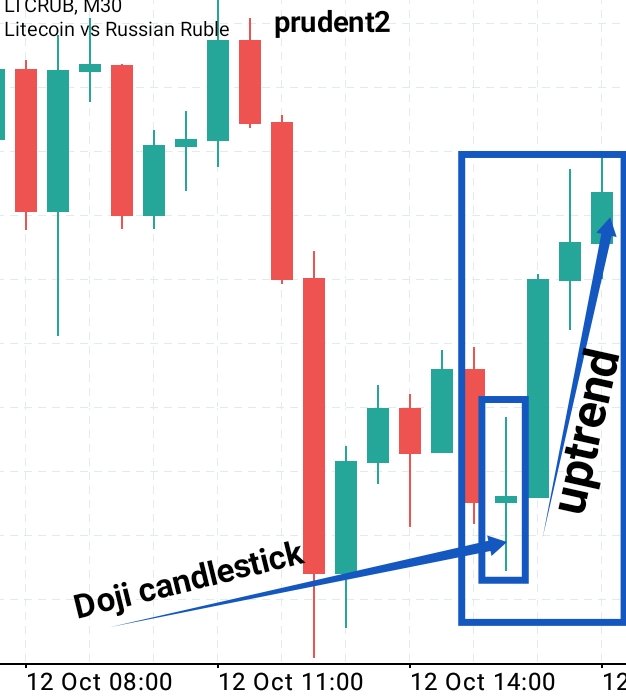
As you can see on the screenshot above, this is a LTC/RUB pair chart, using a 30 minutes timeframe. And a doji candlestick pattern occurred where the body of the green candle was very small. And after the formation of the doji, a large green-bodied candle followed, meaning the buyers has successfully taken over the market.
- The Hammer Candlestick Pattern: This type of candlestick pattern is said to occur when a candlestick has a long wick/tail, and usually a small body at the top. It's shape is justⁿ like an hammer🔨, and in most cases it t signifies reversal.
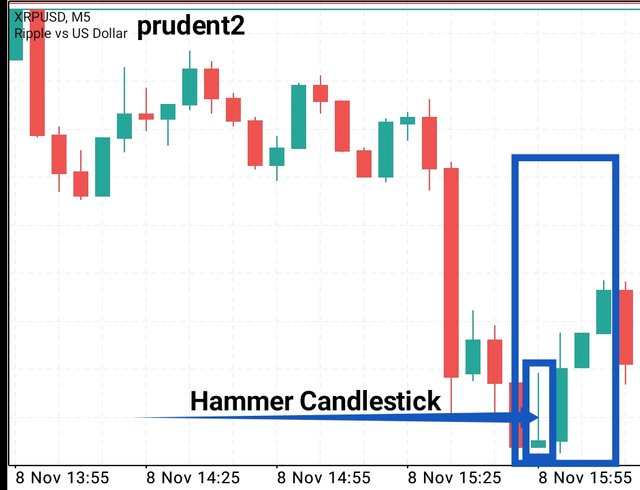
As you can see on the screenshot above, this is an XRP/USD pair chart, using a 5 minutes timeframe. And a Hammer Candlestick Pattern occurred at the end of a bearish trend. And after the formation of Hammer Candlestick Pattern, there was a bullish reversal and the price began to go up.
- The Morning and Evening Star Candlestick Pattern: The Morning and Evening star candlestick pattern refers to two different types of patterns.
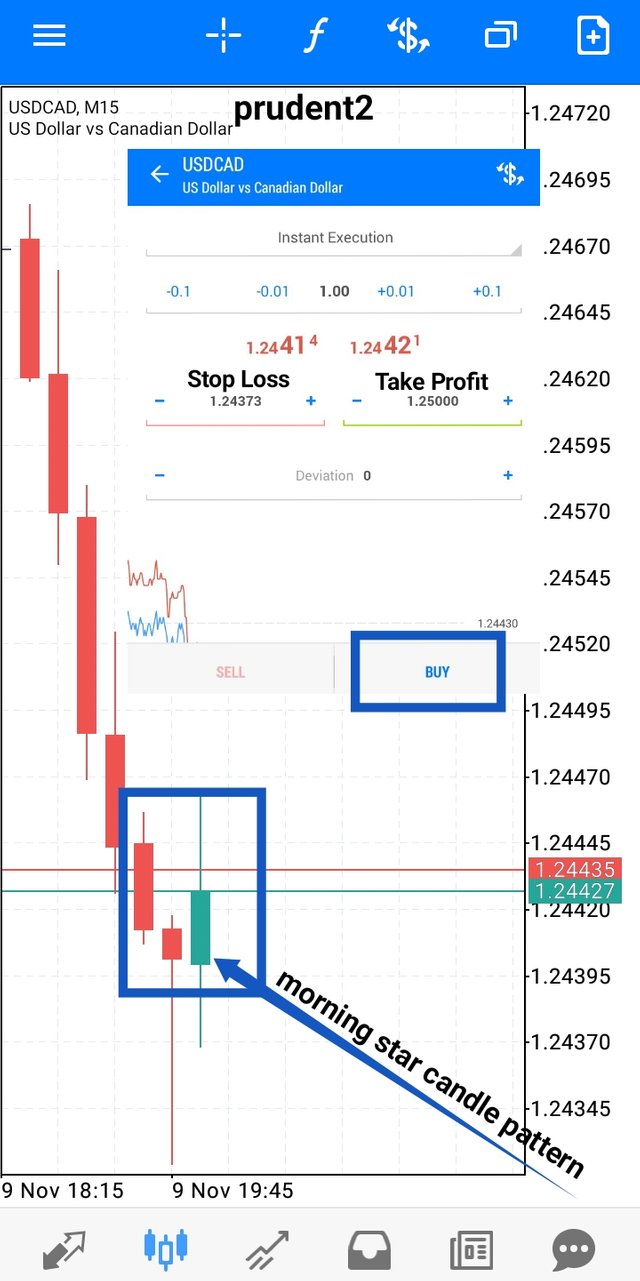
The morning star candlestick pattern is said to occur where there is a simultaneous formation of a bearish, doji and bullish candlestick. It signifies a bullish reversal.
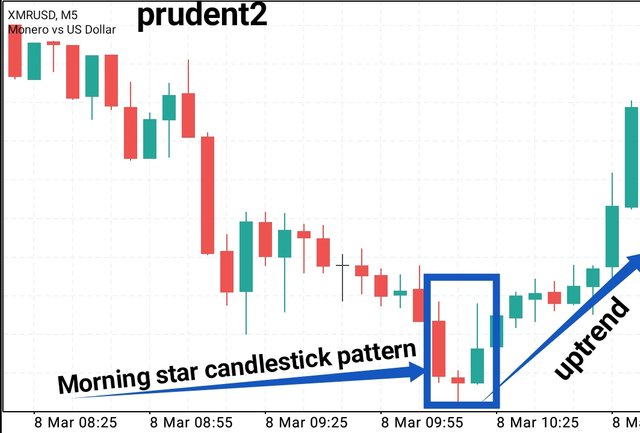
As you can see on the screenshot above, this is an XMR/USD pair chart, using a 5 minutes timeframe. And a morning star candlestick pattern was formed where a bearish, doji and bullish candlestick occur simultaneously. When the morning star candlestick pattern was formed, a bullish reversal followed immediately as the price began to go up.
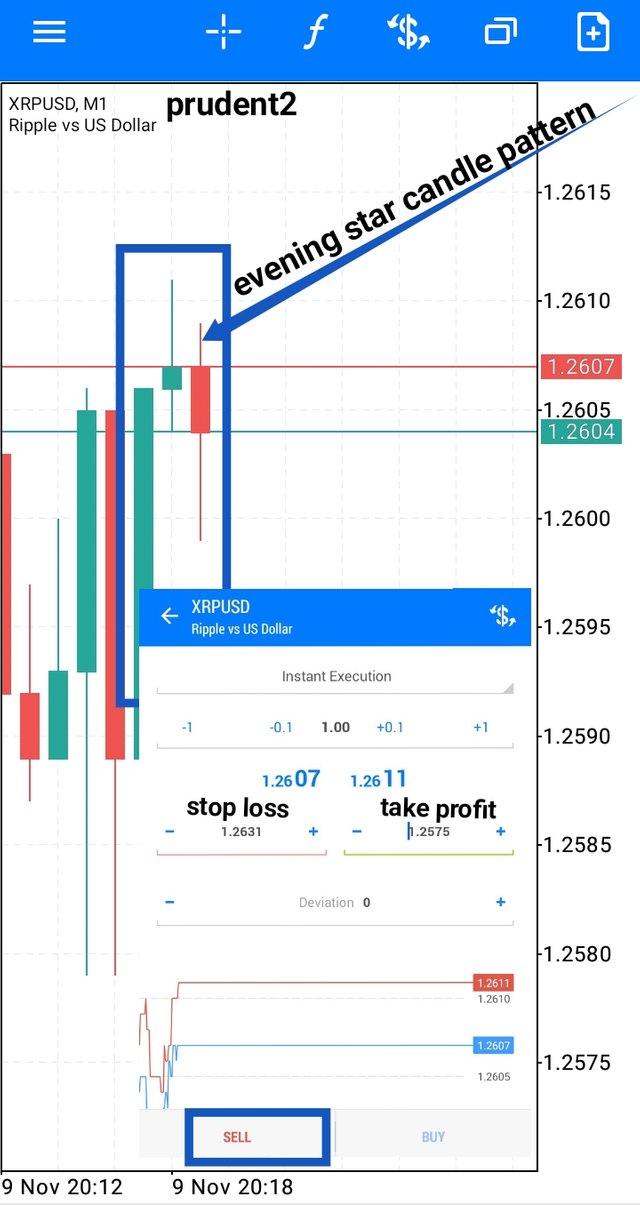
The evening star candlestick pattern is said to occur when there is a simultaneous formation of a bullish, doji and bearish candlestick. It signifies a bearish reversal.
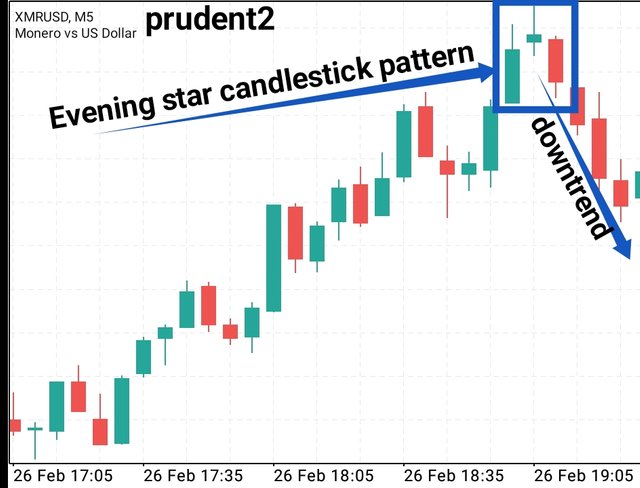
As you can see on the screenshot above, this is an XMR/USD pair chart, using a 5 minutes timeframe. And an evening star candlestick pattern was formed where a bullish, doji and bearish candlestick occurred simultaneously. When the evening star candlestick pattern was formed, a bearish reversal followed immediately as the price began to go down.
- The Harami Candlestick Pattern: The Harami Candlestick Pattern can exist in either a bearish or bullish form.
The bullish Harami candlestick pattern is said to occur when a bearish candlestick completely covers the next bullish candlestick. It is usually located at the bottom of a downtrend in the market price.
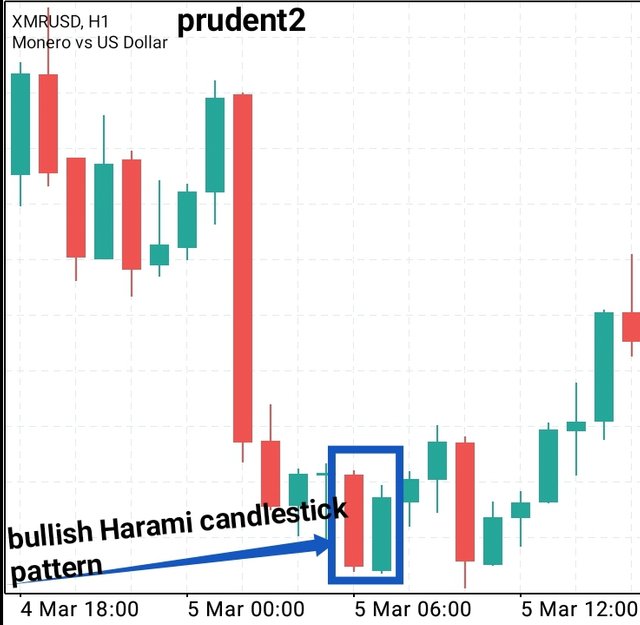
As you can see on the screenshot above, this is an XMR/USD pair chart, using a 1 hour timeframe. And a bullish Harami candlestick pattern was formed where a bearish candle (red) completely covered the bullish candle (green) next to it. After this formation there was an upward movement in the market price.
The bearish Harami candlestick pattern is said to occur when a bullish candlestick completely covers the next bearish candlestick. It is usually located at the top of an uptrend in the market price.
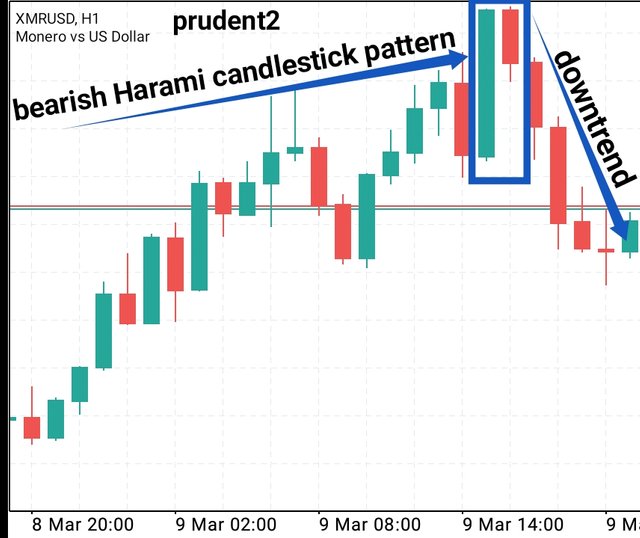
As you can see on the screenshot above, this is an XMR/USD pair chart, using a 1 hour timeframe. And a bearish Harami candlestick pattern was formed where a bullish candle (green) completely covered the bearish candle (red) next to it. After this formation there was a downward movement in the market price.


Candlestick patterns can easily help traders to identify the current state of the market, as well as how the market closed for the previous day. But it is important to note that the candlestick is best reliable when combined with other indicators. So there are some measures a trader ought to take before trading a candlestick pattern. Some of these measures includes:
Observe the changes in the body of the candlestick:
The size of a previous candlestick is used to identify how high or low the price went in the previous market. So before a trader trades with a candlestick pattern, he ought to observe through the body of the previous candle, whether the market closed in an up or downtrend. The reason why it is important to observe the changes in the body of the candlestick is because candlesticks with small bodies Indicates low momentum (buying/selling pressure), while candlesticks with large bodies Indicates high momentum (buying/selling pressure).Observe the anatomy of the candlestick:
The anatomy here refers to the highs and lows, as well as the open and close. So a trader ought to observe the highs, lows, up and down of the current and previous candlesticks to be able to know whether buyers or sellers are in control of the market.Observe if the candlestick pattern is formed within your support and resistance line:
Support and resistance line here refers to the point where the market price usually bounce off, and depending on the strategy of the trader it is important for the candlestick pattern to be formed in respect to your support and resistance line.


I will perform this task using my Meta Trader 5 Demo account
Firstly, I placed a buy order on a USD/CAD crypto pair using a 15 minutes timeframe. As you can see on the screenshot below, here is the crypto chart as well as the position.
And as you can see on the screenshot below, my profit started from -1.61 and was currently at 26.52.
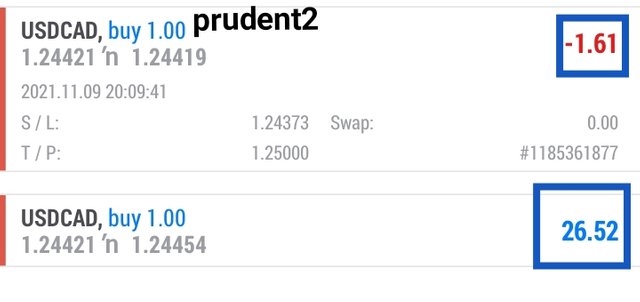
The reason why I decided to place a buy order on this crypto pair was because I discovered that a morning star candlestick pattern was formed and it's formation signifies that a bullish reversal is coming. So I placed a buy order to make profit in this bullish run.
Secondly, I placed a sell order on an XRP/USD crypto pair using a 1 minute timeframe. As you can see on the screenshot below, here is the crypto chart as well as the position.
And as you can see on the screenshot below, my profit started from -2.20 and was executed at 3.10.
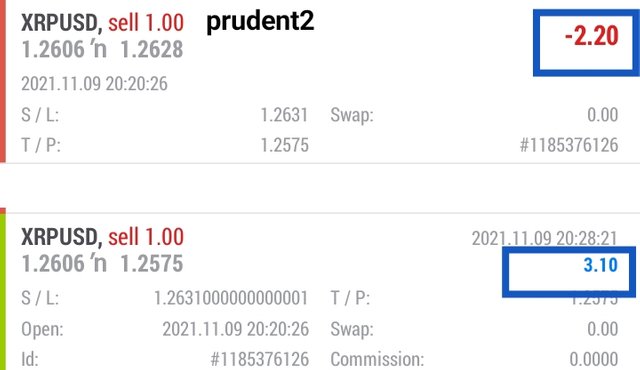
The reason why I decided to place a sell order on this crypto pair was because I discovered that an evening star candlestick pattern was formed and it's formation signifies that a bearish reversal is coming. So I placed a sell order to make profit in this bearish run.


The Japanese candlestick is used by almost every crypto trader because it clearly tells us the state of the market, and one of the most important aspect of of this candlestick is the formation of it's pattern. The candlestick pattern helps traders to make profitable decisions, such as when to enter and exit the market. Best regards to @reminiscence01 for this interesting topic.
Note: All the screenshot were taken from my MetaTrader 5 DEMO account.