1a) Explain the Japanese candlestick chart? (Original screenshot required). b) In your own words, explain why the Japanese Candlestick chart is the most used in the financial market. c) Describe a bullish and a bearish candle. Also, explain its anatomy. (Original screenshot required)
1a) Explain the Japanese candlestick chart?(Original screenshot required
The Japanese candlestick chart is a viral chart widely used in all parts of the world by investors; the first innovation of the candlestick by a rice trader called Munehisa Homma in the 1770s was used to prepare a technical analysis of charts and also infer the price change of assets. This concept initiated into rice trading rendered Munehisa Homma to flourish in the rice market, and he’s now deemed a legend in rice trading.
The Japanese candlestick has evolved and is widely recognized due to its service and goal. Thus, it reveals to investors the price trend, whether it’s an upward movement or a downward, with unique colors. These colors are primarily to signal traders the price trends.
This assists traders or investors make good rulings on trades. This is, therefore, because the Japanese candlestick fills in traders on cryptocurrencies by exhibiting the price changes of assets within a period showing the highest and lowest price.
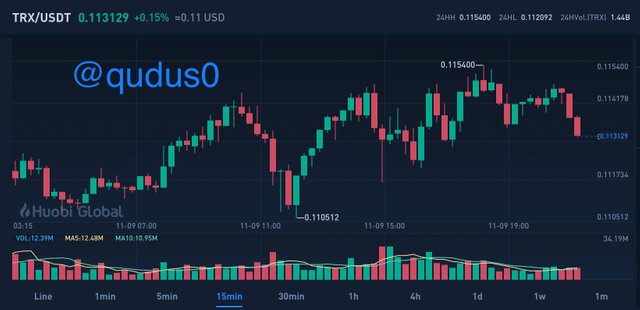
Below is an example of the Japanese candlesticks from HUOBI exchange.
 Screenshot taken from HUOBI exchange
b) In your own words, explain why the Japanese Candlestick chart is the most used in the financial market.
Above, I stated earlier that the Japanese candlestick is a primarily used tool worldwide. Precisely these candlesticks illustrate an accurate analysis of price trends of assets within a particular period. Nevertheless, the candlestick is exhibited in a graphical form which, however, shows with the aid of different colors a bullish and a bearish candlestick at a given period.
The graphical representation illustrating the highest and lowest price of an asset at a period aids investors in decision-making.
c) Describe a bullish and a bearish candle. Also, explain its anatomy. (Original screenshot required)
Bullish candle
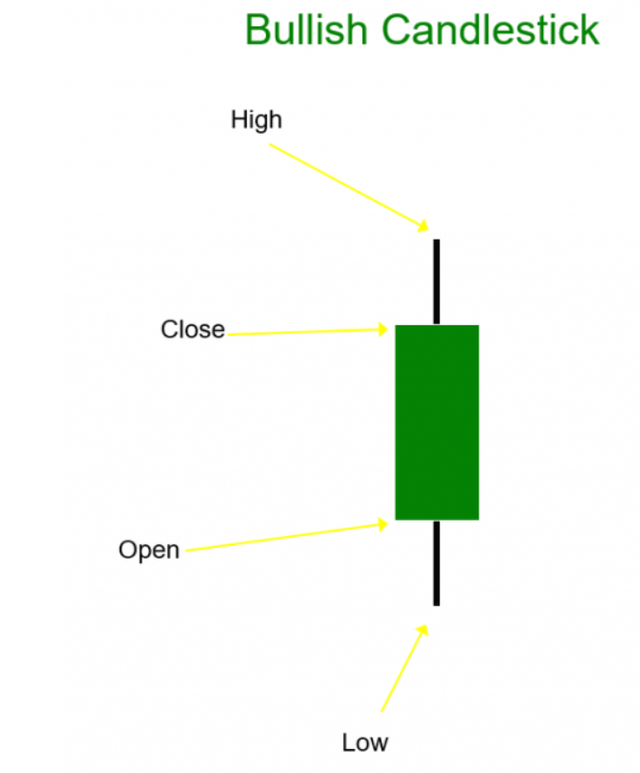
A bullish candle naturally implies an uptrend in price movements. It notifies investors that the asset price is indeed soaring due to buyers' dominance in the market. For a bullish candle, the open price is constantly below the close price of the asset because a bullish candle is said to be rising
For a bullish candle, primarily, it's represented at default green color.
Anatomy Of A Bullish Candle.
The bullish candlestick comprises the components High, Low, Open, and Close. Hence I will clarify its purposes accordingly.
High
- It shows the ultimate price the asset has attained in a given period.
Low
- It indicates the poorest price the asset attained in a given period.
Open
- It tells the starting price movements of an asset in a given time; here, it’s an upward movement for a bullish candle.
Close
- It tells the final price of an asset in a given period.
Bearish candle
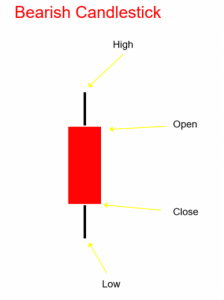
A bearish candle implies a downtrend in price movements. It informs investors that the asset price is falling due to sellers dominating the market. Assuming a bearish candle, the open price is precisely above the close price of the asset because a bearish candle is known to be receding.
For a bearish candle, primarily, it's represented at default red color.
Anatomy Of A Bearish Candle.
The bearish candlestick also comprises the components High, Low, Open, and Close. Hence I will equally clarify its purposes accordingly as well.
High
- It reveals the ultimate price the asset attained at a given time.
Low
- It discloses the lowest price the asset attained in a provided period.
Open
- It tells the starting price movements of an asset in a given time; here, it’s a downward movement for a bearish candle.
Close
- It shows the final price of an asset in a given period.
Thank you. @qudus0


#club5050 😀
Downvoting a post can decrease pending rewards and make it less visible. Common reasons:
Submit