
Hello everyone !
Greetings to you all and welcome to the season 20 of the steeemit engagement challenge. Last season we had a lot of interesting topics to discuss on and this week is beginning just the same as previous time.
Trading is the act of the buying and selling of stocks, cryptocurrencies And others with the the primary aim of making profit. This involve using spatial techniques which are known as fundamental analysis and technical analysis. To be more effective in trading, we employ the use of indicators which help Give us a sense of direction of the market overall.
The Wyckoff Method Is the use of the technical analysis approach to focuses on identifying market cycles and potential turning points. It was first developed by Richard Wyckoff, a renowned Wall Street trader in the early 20th century.
His method is based on the ideology that market behavior is influenced by the actions of large institutions and professional traders, who often manipulate prices to either accumulate or distribute positions.
1
The Three Fundamental Laws of the Wyckoff Method
The Law of Supply and Demand:
The law of supply and demand states that the price of a commodity is determined by the interaction of supply and demand. In case where demand exceeds supply, prices tend to rise. Counter wise, if supply exceeds demand, prices tend to fall equally.
Wyckoff applied volume analysis to identify variation in supply and demand. For instance, increasing volume on up days indicate that demand is surpassing supply, whereas increasing volume on down days May indicate that supply is Out running demand.
The Law of Cause and Effect:
The law of cause and effect states that for every action there's a reaction. In the application of the Wyckoff Method, this means that changes in price are often preceded by changes in volume or other indicators. For For instance, a significant increase in volume before a price breakout suggests that a large accumulation phase is likely to have I'm been observed.
The Law of Effort versus Result:
The law of effort versus results states that the relationship between effort that is price movement and result (volume) is not always linear In most cases. To explain this, a significant price movement may not always be accompanied by a varying volume, and vice versa.
Wyckoff used this law to identify potential turning points in the market. For instance, a large price movement with relatively low volume may suggest that a trend is getting exhausted.
Explain how each law can help predict the price movements of the Steem token within the cryptocurrency market.____
Applying Wyckoff's Laws to Steem Token
The Wyckoff Method, with its three fundamental laws, can be applied to analyze the price movements of the Steem token within the cryptocurrency market.
Law of Supply and Demand
Accumulation and Distribution: In the Steem market, when large holders or institutions are quietly buying Steem, it creates a demand imbalance. This can lead to a gradual price increase during the accumulation phase. Conversely, when these holders start selling, it increases supply, potentially causing a price decline during the distribution phase.
Volume Analysis: cross-checking the trading volume of Steem, traders can spot potential drift in supply and demand. For instance, increasing volume on up days might indicate strong demand, while increasing volume on down days could indicate increased selling pressure.
Law of Cause and Effect
Price and Volume Relationship: The Wyckoff Method stresses on the relation between price and volume. For Steem, a significant increase in volume before a price breakout could signal a potential accumulation phase. Similarly, a decrease in volume during a price decline might suggest that selling pressure is waning.
Indicator Analysis: employing indicators such as the Relative Strength Index (RSI) or moving averages, can be used in combination with volume to identify potential reversal points.
The Law of Effort versus Result
Price Movement and Volume: A large price movement in Steem without a corresponding increase in volume might suggest that the momentum behind the move is weakening. Controversial, a small price movement with a significant increase in volume could suggest that a more substantial move is imminent.
Identifying False Breakouts: the law can help traders tell the difference between actual price reversals and false breakouts signals. A false breakout often are observed when a price breaks through a support or resistance level but fails to maintain the movement due to relatively low volume.
In a more practical sense, the Wyckoff Method gives us a structure for analyzing the Steem market by focusing on the relationship between price, volume, and market structure.
By understanding these three fundamental laws, traders can potentially spot potential turning points, accumulation and distribution phases, and make more informed decisions about their Steem positions while trading.
2
Cause and Effect in the Wyckoff Method
Explain briefly how the Wyckoff Method uses the principle of cause and effect to anticipate price actions
The Wyckoff Method says that every action in the market has a corresponding reaction to it . This principle is fundamental to anticipating price actions In the market. By understanding the Principal causes of price changes, traders can make more informed predictions about future price behavior of a given commodity.
Here's how the Wyckoff Methopredictions applies this principle:
Volume as a Leading Indicator: Volume is often seen as a top notch indicator in applying the Wyckoff Method. When large institutions accumulate or distribute positions, they typically do so in large quantities, which can be noticeable in the trading volume.
Accumulation Phase: A change in volume of a commodity during a period of price stability or a slight decline can interpret that whales are quietly buying, creating a layout for a potential uptrend.
Distribution Phase: A surge in volume during a period of price stability of a commodity or a slight increase can indicate that whales are quietly selling off their stocks, creating the scenario for a potential downtrend.
Price Action Patterns: The Wyckoff Method recognizes various price action patterns that can Give us a clue about underlying supply and demand changes. These patterns often involve a combination of price and volume behavior of a given commodity.
Cup and Handle: This pattern, often associated with accumulation, involves a rounded bottom formation In a cup like shape followed by a brief consolidation period Which gives the handle of the cup. A breakout from the handle, accompanied by increasing volume, can indicate a potential uptrend In the market.
Flag and Pole: This pattern, often associated with distribution, involves a rectangular consolidation period (the flag) following a sharp price move (the pole). A breakdown from the flag, accompanied by increasing volume, can signal a potential downtrend.
Support and Resistance Levels: Traders who use Wyckoff method pay close attention to support and resistance levels. These levels are often areas where supply and demand forces are in balance. When a price breaks a support or resistance level with A noticeable volume, it can indicate a drift in the underlying balance of forces and potentially lead to a trend reversal point.
Market Cycle Analysis: The Wyckoff Method stresses on the cyclical nature of markets. By identifying the different phases of a market cycle that is the accumulation, markup, distribution, markdown phase, traders can anticipate potential price actions based on historical patterns. For instance, if a market has been in a prolonged accumulation phase, a breakout to the upside is more likely to occur.
By understanding the relationship between cause that's changes in supply and demand, and effect such as price movements, Wyckoff traders are more likely to make more informed predictions about future price action In the market and spot potential trading opportunities.
Give an example of how 'cause' can be quantified (such as accumulation/distribution) and how 'effect' can be expected, using Steem’s historical price data to illustrate your point.
Quantifying Cause and Effect in Steem's Price Movements
Quantifying Cause, Accumulation/Distribution
One of the primary methods to quantify accumulation and distribution in the Wyckoff Method is through volume analysis. Volume highlights the number of shares( tokens ) being traded within a specific period in time. By analyzing the relationship between price and volume, we can gain insights into the Basic concept of supply and demand dynamics.
Accumulation:
Increasing Volume on Up Days: When the price of Steem is rising and the trading volume is also increasing, it suggests that buyers are actively accumulating the token. This could indicate that a significant accumulation phase is underway.
Consolidation with Increasing Volume: A period of price stability or a slight decline accompanied by increasing volume can also signal accumulation. This suggests that buyers are gradually accumulating Steem at relatively lower prices.
Distribution:
Increasing Volume on Down Days: If the price of Steem is falling and the trading volume is increasing, it might indicate that sellers are actively distributing their holdings. This could suggest a distribution phase is in progress.
Consolidation with Increasing Volume: A period of price stability or a slight increase with rising volume could also signal distribution. This suggests that sellers are gradually distributing Steem at relatively higher prices.
Quantifying Effect: Expected Price Movement
Once we've quantified accumulation or distribution, we can make educated guesses about the expected price movement.
Accumulation:
Upward Breakout: A significant accumulation phase often culminates in a breakout to the upside. As more buyers enter the market, demand increases, pushing the price higher.
Price Target: Based on the magnitude of the accumulation phase, we can estimate potential price targets. For example, a large accumulation phase might suggest a substantial price appreciation.
Distribution:
Downward Breakdown: A distribution phase often leads to a breakdown to the downside. As sellers increase their activity, supply exceeds demand, causing the price to decline.
Price Target: Similar to accumulation, we can estimate potential price targets based on the extent of the distribution phase. A large distribution phase might suggest a significant price decline.
Using Steem's Historical Data
Let's imagine analyzing Steem's historical price data. We observe a period of price stability with increasing volume. This could suggest a potential accumulation phase.
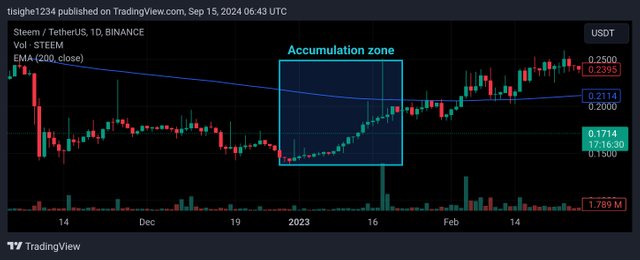
Let's consider the case of steem price in the month of Jan, If Steem subsequently breaks out to the upside with strong volume, it aligns with the expected outcome of an accumulation phase. Conversely, if the price breaks down with increasing volume, it might indicate a distribution phase.
As we can observe steem price was currently trending at .17$ and when the accumulation phase begun, I surge from .17$ to .28$. this is being confirmed with a strong increase in volume. All this aline with our criteria of Accumulation phase.
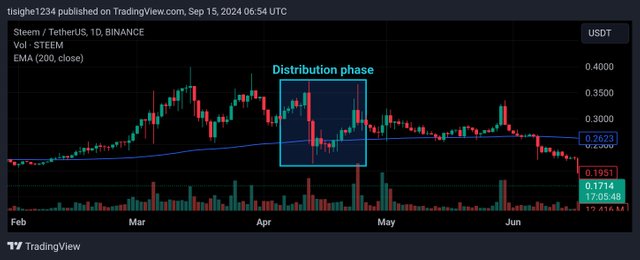
Going to the distribution phase, We see that the price of steem was currently trending at .30$, After that, there is a strong breakout in the downward direction. Followed by a strong increase in volume. We observe that the price of steem dropped to 0.20$. This is an indication that a distribution is being taken place.
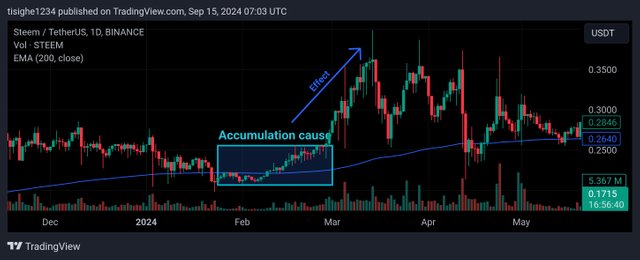
Whether in accumulation or distribution, there's always some effect to that. Once an accumulation of course, there's a sudden surge in Price uptrend. With the wyckoff method It is possible to predict Future price movement.
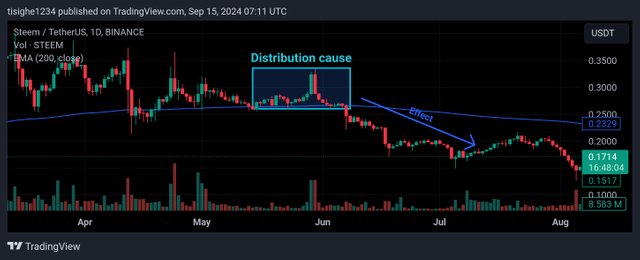
By consistently monitoring these indicators and applying the principles of the Wyckoff Method, traders can make more informed decisions about potential price movements in the Steem market.
3
The Law of Effort vs. Result
Explain how the Law of Effort vs. Result can be observed in the trading volume and price movements of the Steem token
The Law of Effort vs. Result in the Wyckoff Method states that there isn't always a direct correlation between the magnitude of price movement and the volume accompanying it. This principle can be observed in the trading volume and price movements of the Steem token.
Example.
Large Price Movement with Low Volume:
False Breakouts: Sometimes, Steem might experience a significant price surge or decline, but the trading volume remains relatively low. This could indicate a false breakout or a lack of conviction behind the move. Large players might be testing the market or manipulating prices without substantial commitment.
Trend Exhaustion: A large price movement with low volume can also signal that a trend is nearing its end. As participants become less enthusiastic, the volume decreases, even as the price continues to move.
Small Price Movement with High Volume:
Accumulation or Distribution Phase: A small price movement accompanied by a significant increase in volume could suggest that large players are quietly accumulating or distributing Steem. The lack of substantial price movement might be due to their efforts to avoid attracting attention.
Hidden Strength or Weakness: High volume with minimal price movement can also indicate hidden strength or weakness. For example, if buyers are accumulating Steem at a relatively stable price, it might suggest that they are confident in the token's future.
In essence, the Law of Effort vs. Result highlights the importance of considering both price and volume when analyzing Steem's price movements. By understanding that a large price change doesn't always imply strong underlying momentum, traders can avoid getting caught up in impulsive decisions and make more informed trading decisions.
Use a real chart example where this law was evident in the Steem market, and discuss what insights a trader can derive from this analysis.
Imagine a period in Steem's market where the price had been steadily declining. Then, suddenly, there's a sharp spike upwards, but the volume accompanying this move is relatively low.
Analysis:
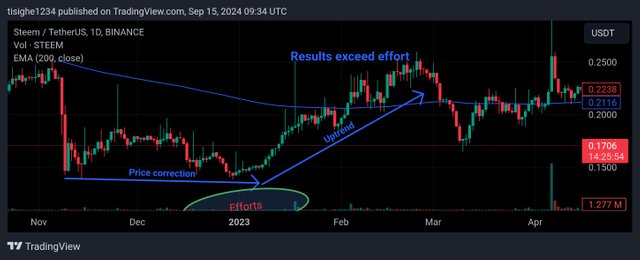
Price move from 0.15$ to 0.25$
It is observed that the price of steem From, 0.15$ to 0.25$ but there is little to no increase in volume. Here is why.
Possible Explanation: This scenario aligns with the Law of Effort vs. Result. Despite the significant price increase, the lack of accompanying volume suggests that the move might be driven by factors other than strong underlying demand.
Potential Implications:
Short-Term Manipulation: The low volume could indicate that the price spike might be the result of short-term manipulation or market noise.
Lack of Sustaining Demand: A lack of volume suggests that there might not be enough underlying demand to sustain the upward move.
Potential Reversal: Traders might be cautious about chasing the uptrend, as the lack of volume could signal a potential reversal.
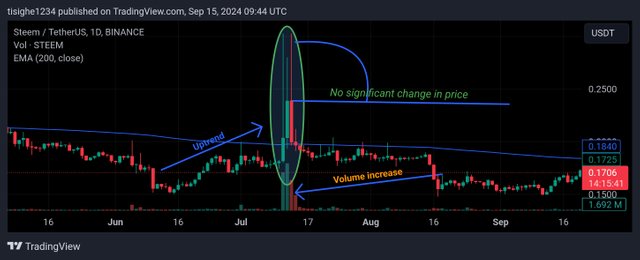
Also observing the chat. We see that there is a sudden spike in volume by the price increase. Just a little bit. Prices is seen to move from 0.25$ to 0.28$ And follow us back at the same level. Before finally getting into a downtrend. This is an indication that effort exceeds result.
Insights for Traders:
Avoid Impulsive Decisions:
When observing a significant price movement without corresponding volume, traders should be cautious about making impulsive buy or sell decisions.Look for Confirmation: To confirm the validity of a price movement, traders should wait for additional evidence, such as increased volume or a retest of a support or resistance level.
Consider Underlying Fundamentals: While technical analysis can provide valuable insights, it's also essential to consider the underlying fundamentals of Steem. Positive news or developments could support a price increase, even if the volume is low.
Diversify Trading Strategy: Relying solely on price and volume analysis can be risky. A diversified trading strategy that includes other technical indicators and fundamental analysis can help mitigate risks.
By understanding the Law of Effort vs. Result and applying it to real-world scenarios, traders can make more informed decisions and avoid potential pitfalls in the Steem market.
4
Key Phases of the Wyckoff Method___
Discuss the key phases of the Wyckoff Method: accumulation, markup, distribution, and markdown.
The Wyckoff Method divides market cycles into four primary phases: accumulation, markup, distribution, and markdown. Understanding these phases is crucial for identifying potential turning points and trading opportunities.
Accumulation
Definition: This phase is characterized by the gradual accumulation of a security by large institutions or professional traders.
** Characteristics:**
Consolidation: Often involves a period of price stability or a slight decline.
Increasing Volume: Volume tends to increase on up days as buyers accumulate the security.
Narrowing Price Range: A tightening of the price range, indicating a lack of selling pressure.
Testing Support: Prices may test support levels to gauge buying interest.
Markup
Definition: This phase represents the upward movement of the price as accumulated positions are liquidated for profit.
Characteristics:
Rising Prices: A sustained upward trend.
Increasing Volume: Volume continues to increase on up days, indicating strong demand.
Widening Price Range: A widening of the price range as prices move higher.
Retesting Support: Prices may retest previous support levels as a buying opportunity.
Distribution
Definition: This phase is characterized by the gradual distribution of a security by large institutions or professional traders.
Characteristics:
Consolidation: Often involves a period of price stability or a slight increase.
Increasing Volume: Volume tends to increase on down days as sellers distribute the security.
Narrowing Price Range: A tightening of the price range, indicating a lack of buying pressure.
Testing Resistance: Prices may test resistance levels to gauge selling interest.
Markdown
Definition: This phase represents the downward movement of the price as distributed positions are liquidated for profit.
Characteristics:
Falling Prices: A sustained downward trend.
Increasing Volume: Volume continues to increase on down days, indicating strong selling pressure.
Widening Price Range: A widening of the price range as prices move lower.
Retesting Resistance: Prices may retest previous resistance levels as a selling opportunity.
Key Points:
The Wyckoff Method emphasizes the importance of understanding the underlying supply and demand dynamics in the market.
Each phase is typically followed by its opposite phase, creating a cyclical pattern.
Identifying these phases allows traders to anticipate potential turning points and make informed trading decisions.
It's essential to use additional technical analysis tools and indicators to confirm the identification of these phases.
By understanding these key phases and their characteristics, traders can apply the Wyckoff Method to analyze market trends and make informed trading decisions.
Give a historical price actions for the Steem token as examples of each phase and explain briefly how a trader can spot the current phase of the market.
Hypothetical Example:
Accumulation:
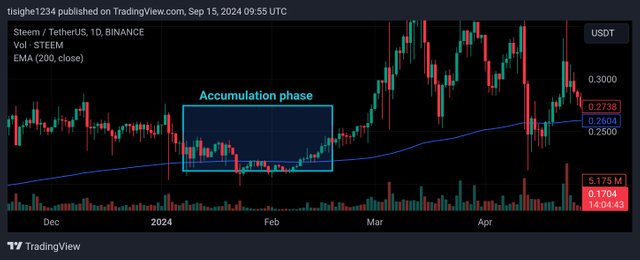
Scenario: A period of price stability or a slight decline in Steem's price, accompanied by increasing volume on up days.
Identification: Traders can identify this phase by observing a consolidation pattern with a narrowing price range and increasing volume on up days. This suggests that buyers are gradually accumulating Steem at relatively lower prices.
Markup:
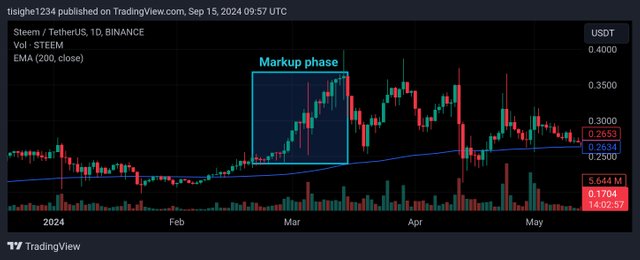
Scenario: A sustained uptrend in Steem's price, with increasing volume on up days and a widening price range.
Identification: Traders can identify this phase by observing a clear upward trend, accompanied by increasing volume and a series of higher highs and higher lows.
Distribution:
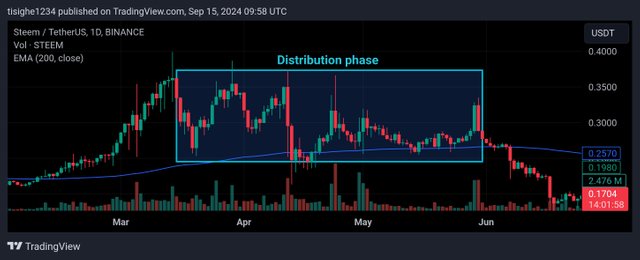
Scenario: A period of price stability or a slight increase in Steem's price, accompanied by increasing volume on down days.
Identification: Traders can identify this phase by observing a consolidation pattern with a narrowing price range and increasing volume on down days. This suggests that sellers are gradually distributing Steem at relatively higher prices.
Markdown:
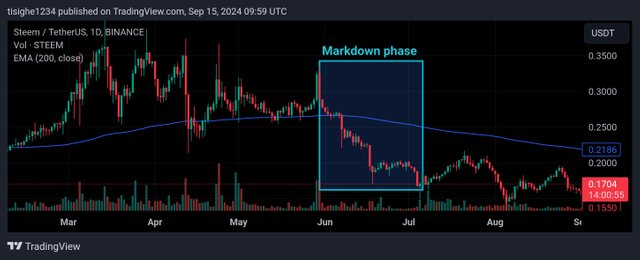
- Scenario: A sustained downward trend in Steem's price, with increasing volume on down days and a widening price range.
- Identification: Traders can identify this phase by observing a clear downward trend, accompanied by increasing volume and a series of lower highs and lower lows.
Identifying the Current Phase
To identify the current phase of the Steem market, traders can use a combination of the following techniques:
Price Action Analysis: Examine the overall price trend, looking for patterns such as consolidation, uptrends, or downtrends.
Volume Analysis: Analyze the trading volume to identify changes in supply and demand. Increasing volume on up days suggests accumulation, while increasing volume on down days suggests distribution.
Support and Resistance Levels: Identify key support and resistance levels to gauge the strength of price movements. A break above resistance or below support can signal a change in phase.
Wyckoff Patterns: Look for specific patterns, such as the cup and handle, flag and pole, or spring, that are associated with different phases.
Indicator Analysis: Use technical indicators like the Relative Strength Index (RSI) or Moving Averages to confirm the phase and identify potential turning point.
Bear in mind that Identifying the current phase requires a combination of technical analysis skills and experience. It's essential to continuously monitor the market and adjust your analysis as conditions change.
5
Applying the Wyckoff Method
Give the detail step by step process for implementing the Wyckoff Method in trading the Steem token
Applying the Wyckoff Method to Steem Trading
The Wyckoff Method employs the systematic approach to analyzing market cycles and spotting potential trading opportunities. Below is a detailed approach for
applying this method to Steem trading:
Identify the Market Phase:
Price Action: Analyze the overall price trend of Steem. Is the token in an uptrend, downtrend, or sideways consolidation period?.
Volume: Observe the trading volume. Increasing volume on up days suggests accumulation, while increasing volume on down days suggests distribution.
Support and Resistance: Identify key support and resistance levels. Breakouts or breakdowns through these levels can signal changes in market phase.
Analyze Accumulation Phase:
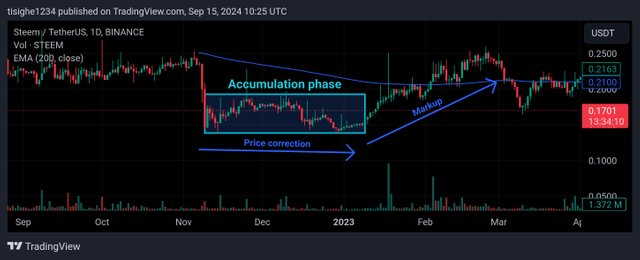
Consolidation: Look for a period of price stability or a slight decline.
Increasing Volume: Observe increasing volume on up days.
Narrowing Price Range: Identify a tightening of the price range.
Testing Support: Watch for price tests of support levels.
Identify the Markup Phase:
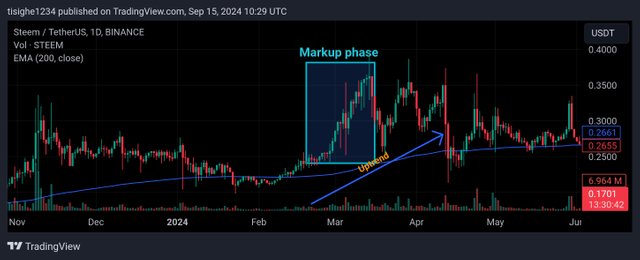
Upward Trend: Observe a sustained uptrend.
Increasing Volume: Note increasing volume on up days.
Widening Price Range: Identify a widening price range.
Retesting Support: Watch for price retests of previous support levels.
Analyze Distribution Phase:
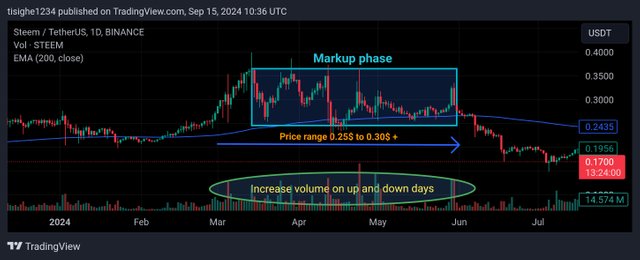
Consolidation: Look for a period of price stability or a slight increase.
Increasing Volume: Observe increasing volume on down days.
Narrowing Price Range: Identify a tightening of the price range.
Testing Resistance: Watch for price tests of resistance levels.
Identify the Markdown Phase:
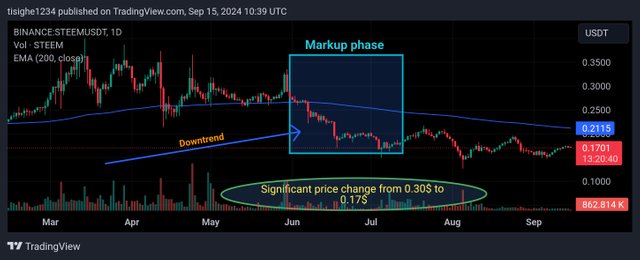
Downward Trend: Observe a sustained downward trend.
Increasing Volume: Note increasing volume on down days.
Widening Price Range: Identify a widening price range.
Retesting Resistance: Watch for price retests of previous resistance levels.
Use Wyckoff Patterns:
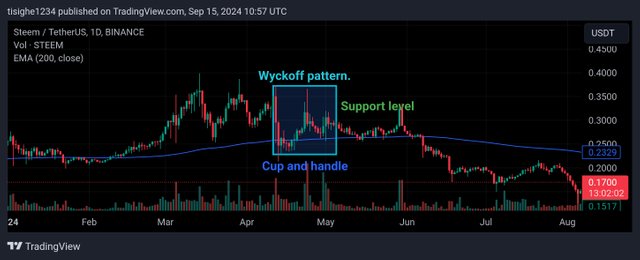
Cup and Handle: Identify this pattern, which often signals accumulation.
Flag and Pole: Identify this pattern, which often signals distribution.
Spring: Identify this pattern, which can signal a reversal of a trend.
Confirm with Indicators:
Relative Strength Index (RSI): Use the RSI to confirm cases of overbought or oversold conditions of the given commodity.
Moving Averages: Apply moving averages to spot potential trends and turning points.
Set Entry and Exit Points:
Entry: Determine entry points based on support and resistance levels, breakout or breakdown signals, and indicator readings.
Exit: Set exit points based on profit targets, stop-loss levels, or changes in market conditions.
Risk management:
Stop-Loss Orders: Use stop-loss orders to limit potential losses.
Position Sizing: Manage your position size to avoid excessive risk.
Bear in mind that The Wyckoff Method need a lot of patience, discipline, and a deeper understanding of market dynamics. It's necessary to practice and Get acquainted with your skills through consistent analysis and backtesting. Always conduct thorough research and consider your risk tolerance bound before taking any trading decisions.
explain detailed on how to spot the accumulation phase, Conditions of supply/demand tests, and the transition to a markup phase.
Identifying Accumulation Phase and Signs of Supply/Demand Tests
The accumulation phase is characterized by the gradual accumulation of a security by large institutions or professional traders. Here are key signs to look for:
Consolidation: A period of price stability or a slight decline.
Increasing Volume: Volume tends to increase on up days as buyers accumulate the security.
Narrowing Price Range: A tightening of the price range, indicating a lack of selling pressure.
Testing Support: Prices may test support levels to gauge buying interest.
Signs of Supply/Demand Tests
Supply and demand tests are crucial for understanding the market's balance. Look for these signs:
Support Tests: When the price approaches a support level, observe the volume. Increasing volume on a test of support can indicate strong buying conditions, suggesting that demand is overtaking supply.
Resistance Tests:* When the price approaches a resistance level, look at the volume. Increasing volume on a test of resistance can notify a strong selling pressure, suggesting that supply is overtaking demand.
Volume Breakouts: A breakout of a support or resistance level with increasing volume can indicate a significant change in supply and demand dynamics.
Transition to Markup Phase
The transition from accumulation to markup often involves these signs:
Breakout: A strong breakout above resistance, accompanied by increasing volume.
Higher Highs and Higher Lows Conditions: A repeat of higher highs and higher lows indicates that an uptrend is developing.
Widening Price Range: We notice that the price range starts to change rapidly as the uptrend gears momentum.
Increased Participation: More traders and investors start to join the uptrend, driving the price higher.
Example:
Imagine Steem's price has been consolidating for several weeks. The volume on up days starts to increase, and the price range narrows. This could indicate an accumulation phase. If Steem then breaks above a key resistance level with strong volume, it could signal a transition to a markup phase.
Reacall: Identifying these phases requires a combination of technical analysis skills and experience. It's essential to continuously monitor the market and adjust your analysis as conditions change.
implement a real example of the Steem token to illustrate how entry and exit points apply with bases on the Wyckoff Method of trading.
Imagine Steem's price has been consolidating for several weeks, forming a cup-and-handle pattern. The handle phase is characterized by a period of price stability or a slight decline, accompanied by increasing volume on up days.
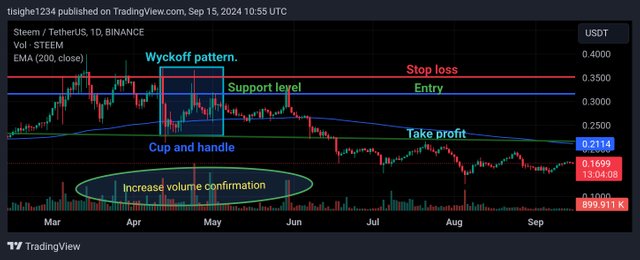
Entry Point
Breakout: When Steem breaks above the handle's high with strong volume, it could signal the start of a markup phase. This breakout could be an opportunity for an entry point.
Stop-Loss: A stop loss order can be placed directly below the handle's low to limit funds losses in case the price reverses.
Exit Point
Profit Target: A profit target can be implemented based on the height of the cup and handle formation. For instance, if the cup is 50% level of the previous price swing, our target could be 50% above the breakout point of the commodity.
Trailing Stop: A trailing stop can be used to secure
profits as the price increases. This is brought about by re-adjusting our stop-loss order to follow the price, making sure a certain amount of profit is secured.
Key Considerations:
Risk Management: Always consider using stop orders to limit funds losses.
Volume Analysis: Pay attention to volume during the breakout and subsequent price movement. Increasing volume confirms the strength of the uptrend.
Market Conditions: Consider broader market trends and factors that could impact Steem's price.
In conclusion, The Wyckoff Method is a technical analysis approach directed toward market cycles and turning points. It identifies accumulation, markup, distribution, and markdown phases. Key principles include supply and demand, cause and effect, and effort vs. result. Traders use it to anticipate market trends and make informed decisions.
I would like to invite the following persons. Join me participate in this contest. @wirngo, @sahmie and @simonnwigwe
Credit to: @rafk
This is very nice informative post on wyckoff method. Especially the way you used to explained the points by chart example is really helpfull for the readers.
Downvoting a post can decrease pending rewards and make it less visible. Common reasons:
Submit
Upvoted! Thank you for supporting witness @jswit.
Downvoting a post can decrease pending rewards and make it less visible. Common reasons:
Submit
The effect and the effort goes hand in hand in wyckoff method. And these are interlink with each other.
If the effort is large then the result is also large. Greater the potential of effort greater the result potential. Wyckoff method helps us to spot the markup as well as markdown phase. We can easily enter and exit the market.
Downvoting a post can decrease pending rewards and make it less visible. Common reasons:
Submit
Thanks so much for stopping by sir. You are right. The wyckoff method helps significantly if used properly..
Downvoting a post can decrease pending rewards and make it less visible. Common reasons:
Submit
Yeah you are welcome 🤗
Downvoting a post can decrease pending rewards and make it less visible. Common reasons:
Submit
This post highlights the application of the Wyckoff method in the cryptocurrency market, developed by the famous trader Richard Wyckoff. This method has three basic rules:
These three laws can help better understand the movement of Steem's price.
Downvoting a post can decrease pending rewards and make it less visible. Common reasons:
Submit