Greeting to all the steemians. Before starting the homework task,
Thanks, professor @lenonmc21 for this amazing lecture where I learn more.
Question No.1
Define in your own words what is the Stochastic Oscillator?
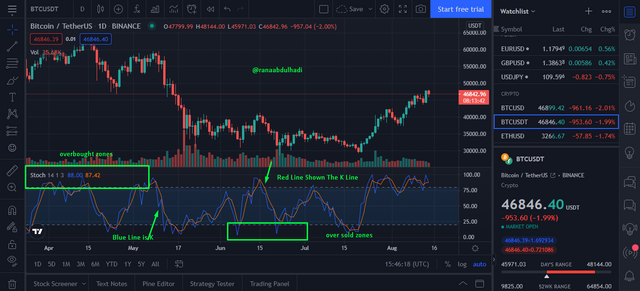
A stochastic oscillator is an indicator that shows the strength of the price movement within a given period. This signal plays an important role in informing traders that when an asset has been bought or sold, this signal uses past market history to signal. Similarly, it uses price accidents to a certain extent and within a certain time. This indicator was made by George Land in 1950. This indicator uses the %k line and %D line to show whether an asset is in an overbought zone or an oversold zone.
Question No.2
Explain and define all components of the stochastic oscillator (% k line,% D line + overbought and oversold limits).
%K line
The line usually represents the current value of the price momentum. K line trade rules would be based on the movement of the D line. The stochastic index is represented by a line. A fast-moving stochastic line.
it is known to be a lot quicker than the D line. It is typically displayed as a strong line, just as an enormous line. It is likewise used to ascertain the end date of a day and contrast it and an authentic informational index. This line is additionally used to make line D. It can likewise cross and cross the subsequent line (D line), demonstrating that the market is acquiring force rapidly.
% D Line
This is the second line of the stochastic pointer. It's not as fast as line by line. It is based on a line worthy. It is based on the merits of the line. It has a continuous running line in the middle. This line is seen as status because it signals traders.
Traders look at the cross of both the% k line and the% D line to take a possible trade.
Overbought Limits
This can be taken to mean that when the signals tell us that an asset has been purchased and its value is likely to decrease. It is formed when the value of %k crosses the 80 lines. When the reading goes above 80 and below 80, a sell signal is given. Over-buying indicates that the price has reached resistance levels and is likely to fall anytime soon.
Oversold Limits
This refers to the time when the signals tell us that it has sold a lot more than it realizes and is likely to increase in price. When the value goes below the 20 marks and comes back above the 20 marks a buy signal is generated.
QUESTION 3
Briefly describe at least 2 ways to use the Stochastic Oscillator in a trade.
stochastic crossover
stochastic crossover usually crosses the K line and the D line. When the KK line crosses the DD line in Sales One, it generates a buy signal. But when it goes below the DD line in the K line and board zone, a cell signal is issued.
Stochastic Overbought and oversold zones
This gives traders a body to know that when an asset has been bought or sold more, the trader decides to buy an asset.. When the signal indicates that the signal has sold out, a buy signal is issued when the price just above 20 reads a moment ago. Traders will also move to sell when an asset is been overbought.
QUESTION 4
Define in your own words what is Parabolic Sar?
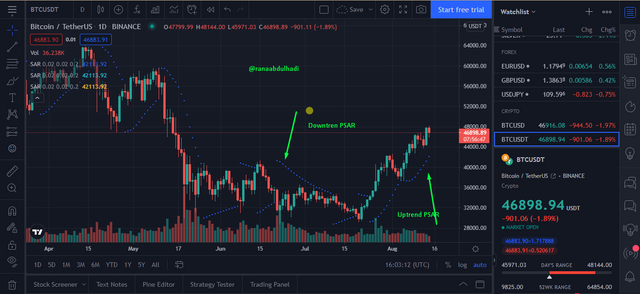
Parabolic SAR would otherwise be known as PSAR. SAR means stop and reverse. This is a signal that traders use in technical analysis. All of these indicators are used to look at the trend reverse or to determine the strength of an existing trend. This can be seen above or below the price depending on the current market trend. The bars above the price show a bearish trend and the bars below the price show a bullish trend.
QUESTION 5
Explain in detail what the price must-do for the Parabolic Sar to change from bullish to bearish direction and vice versa.
As demonstrated before a bullish Parabolic Sar is drawn underneath the value bars or candles for my situation. For an illustrative Sar to adjust from a bullish course to a Bearish heading the value bars in this manner the candle should move to contact the explanatory from bottom up. That is the end cost of a negative candle should contact the explanatory Sar. As shown before a negative Parabolic Sar is drawn over the candlestiks. For an explanatory Sar to alter course from negative to bullish the candles should contact move to contact the allegorical Sar from top to buttom. That is the end cost of a bullish candle should contact the Parabolic Sar.
QUESTION 6
Briefly describe at least 2 ways to use Parabolic Sar in a trade?
Entry Points
The Parabolic Sar can be utilized to make section focuses in an exchange by following its signs. At the point when you apply the Parabolic Sar to an outline and you screen, it spots when there will be a pattern inversion in a negative pattern. Now, costs are some way or another modest. Following its sign means you will purchase toward the start of a bullish pattern consequently you could make a benefit inside a brief time frame.
Exist Points
The parabolic Sar Is used in spotting when a bullish trend is being reversed to a bearish trend. At this stage prices of the assets are about falling hence it gives a sell signal. Traders sell at this point either to take profit or stop loss

PRACTICALS
QUESTION 1
1. It shows a step-by-step on how to add the Stochastic Oscillator to the chart (Indicating the% k Line and the% D Line, the overbought and oversold zone.
- I will be using the TradingView chart so I will open to the TradingView home page. then click on the chart and then select my preferred trading pair. I chose BTC/USDT pair.

- Click on the indicators and strategies icon denoted as (fx)

- From the search box search for Stochastic and click on it to add to the chart.

- From the search box search for Stochastic and click on it to add to the chart.

- Below is a chart with the Stochastic Oscillator added.


QUESTION 2
Show step by step how to add Parabolic Sar to the chart and how it looks in an uptrend and in a downtrend.
- I will be using the TradingView chart so I will open to the TradingView home page. then click on the chart and then select my preferred trading pair. I chose BTC/USDT pair.

- Click on the indicators and strategies icon denoted as (fx)

- From the search box search for parabolic and click on it to add to the chart.

- Below is a chart with the parabolic Sar added.

Conclusion
this lesson has been very impactful on my trading skills, I learned how the Stochastic Oscillator can be used to create entry and exit plans in a trade. same for the Parabolic Sar.
Hi @lenonmc21 please.check my homework
Thank You
Downvoting a post can decrease pending rewards and make it less visible. Common reasons:
Submit