Hi,
Greetings to you all.
I would like to say thank you to @stream4u for this great lesson.
Before I proceed with the home work task, I would like to express my opinion about my understanding of forecast.
In my opinion, forecast implies prediction about the future or statement corresponding to future occurance.
Definition of Price forecasting in relation to crypto market,is the prediction of the future price of cryptocurrency considering the market nature of the currency.
Why price forecasting is needed
Price forecasting plays an important role in driving trader's investment to success or failure in a sense that, it enable them know when to do multiple trading and when to sell at resistance and wait for the price to go down so they can start now trading.
Also, price forecasting enable trader's understand the nature of the market so as to know when to take risk in the trading process.
Chosen appropriate method for price forecasting requires consideration of the span of the forecast. ie long term or short term. The methods are categorized base on qualitative and quantitative.
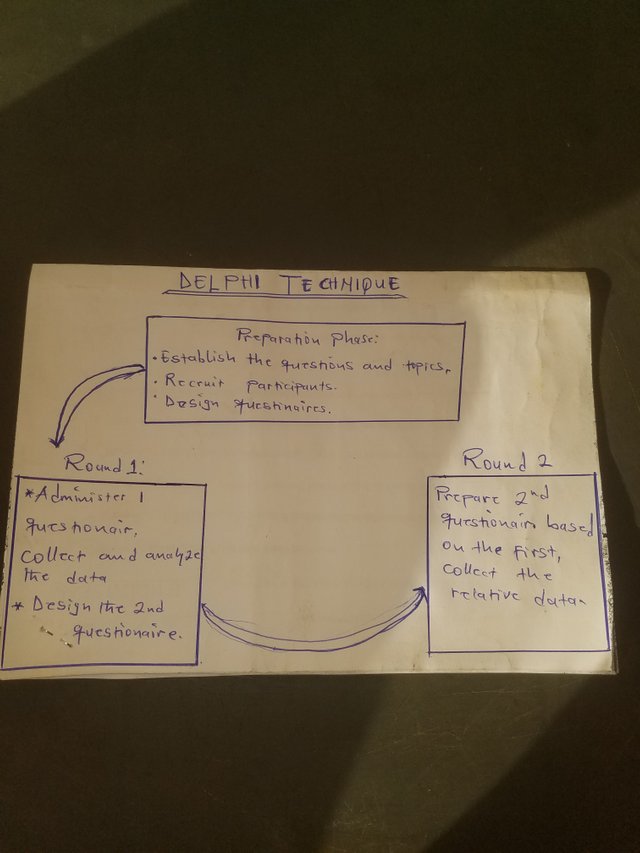
I prefer the Delphi method.
Delphi method is a quick way to reach consensus and make decisions.
This is because, in the Delphi approach dealing with price forecasting, you pose a question as a moderator and expect different forms of answer.
Collect the feedback and summarize.
Again pose a second question based on the first question and still expect a second round answers.
As you continue for some time, you will start receiving similar answers.
Summarize them for your conclusion.

Based on this step by step procedures, I feel the delphi method is the best approach dealing with price forecasting.
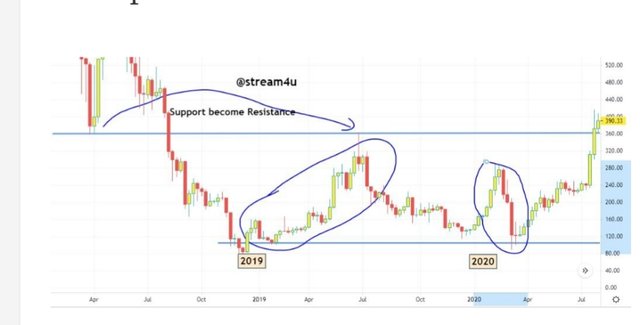
Crypto Asset Chart Graph

The above graph is a candle sticks chart.
The red and green candles lying next to each other signifies movement of an asset in specific time interval.
Before I proceed I will like to define resistance and support.
Resistance level is the point at which price of an asset stop rising.
Support level is the point at which price of an asset stop falling.
From the graph you can see that the green candles keep moving upward early 2019 to This indicate long term support even though there was some resistance points which was very short.
Again from July 2019 to late2019 there was a long resistance and some short period of supporting level.
This indicate long time support and long time resistance.
Again, ending 2019 to ending of March 2020; there was a continue support which tend to resist again in a very short period of time.
This nature of the graph tells you that, resistance can occur in a long period of time and same time short period of time. The same applies to the support.
With this nature of the graph, I think it is very important you monitor the account frequently so that when the price rise to some level you quickly sell.
Sometimes the price continue to rise after you sell your asset but consider it normal. This is because, it can also fall very fast and when it falls to the lowest, you have worked for nothing.
Thank you.
Hi @rashidfu
Thank you for joining The Steemit Crypto Academy Courses and participated in the Week 10 Homework Task.
Your Week 10 Homework Task verification has been done by @Stream4u, hope you have enjoyed and learned something new.
Thank You.
@stream4u
Crypto Professors : Steemit Crypto Academy
Downvoting a post can decrease pending rewards and make it less visible. Common reasons:
Submit