Hi Everyone,
I want to thank you all for working hard to prepare lessons and contests in this community. There is a good guidance for the people who are interested about crypto currencies. Even I am at beginner level of trading, I have learnt a lot from these lessons. For this week I am joining with Fredquantum-Kouba01 Traders Team.
.png)
Since I am new to trading, I’m doing trading with little amount. After I gain more and more experience, I will be able to invest more and go for bigger trades in the future.
.png)
BTC is a digital currency, which means it is intangible currency stored as a computer file. This currency is decentralized. Means of decentralized is, there is no single or central authority that will control the BTC. Hence it is decentralized. Authority is divided. Bitcoin is a digital currency based on a blockchain. If I explain what a blockchain is, blockchain records information as blocks in a chain, where they will have security. we can transfer Bitcoin from one to another, if there is a digital wallet for us. Since Bitcoin is decentralized, this is acting as a peer-to-peer network. That’s why I said we can transfer among wallets. I am using the “Binance” for my trading activities.
The begging of the BTC is noted as it was generated as a reward for mining. Currently Bitcoin is the number one among the crupto currency world. The huge amount of BTC is one reason for it. Not only that, Bitcoin is the first digital currency that is created.
.png)
Since Bitcoin is the number one among the crypto currencies as well as BTC has a good liquidity I got interested in investing on BTC. Because of the market rating, BTC is very easy to trade. If we choose correct time for trading this will benefit a big amount. Another reason for choosing BTC is it is a reliable coin. And Bitcoin is a good investment when it comes to short term investment, where you don’t want to wait longer to take the profit.
.png)
Before entering into the market for trading, we need to carefully analyse the past data for the purpose of doing predictions. Entering into the market at the correct time will give a greater benefit on trading. Unless the trading will make you a loss instead of giving a profit. I have used the knowledge I have gained throughout this lesson series to decide my entering point for the trade.
I have used Exponential Moving Average, Parabolic SAR and Relative Strength Index indicators for my analysis in 5min Candle stick chart of BTC/USDT coin pair.

EMA is an indicator that gives more weight to the more recent periods when calculating the Moving average. The weight for periods are given according to the Exponential Distribution. That is why this indicator calls Exponential Moving Average. Normally, the length of the EMA is used as 50,100,200 by the traders. I have used the 100 as the length for my analysis. Since I didn’t plan to stay in the trade for a long time, I selected 100 instead of 200. EMA is more responsive than other Moving Average types because of the givinh the weights for recent periods.
To enter int a sell/short position, EMA should be above the price and If we want to enter into a buy/long position, the EMA should appear below the price.
.png)
This indicator is an indicator which helps to identify market upcoming trends which can be the continuation of current trend or may be the change of current trend. Parabolic SAR is represented by a dotted line above the price range or the below the price range.
The theory of using Parabolic SAR is, if it appears above the price chart, we can enter into a sell/short position where a market down trend is happening. If it appears below the price chart, we can enter into a buy/long position which is considered a market uptrend at the moment. We can Identify the market exit when the direction of the Parabolic SAR changes. To be sure that the trend continues, we can wait for two or three dots to appear in that direction.
Ex: we enter into the market when the parabolic SAR is above the price, so we can identify the exit when the two or three dots start to appear below the price.
.png)
When the buying pattern of the market derives, we can Identify it using the RSI indicator. Sometimes MArket can be overbought and sometimes it can be oversold. Overbought(above level of 70) means when the market is above the price it actually should be and oversold(below level of 30)market is below it actually should be.
I have also used the knowledge of RSI for this analysis. It is simple to configure this indicator. We can decide it by looking at whether the indicator is below 50 or above 50. If the value is below 50, it is good to enter into a buy/long position and if it is above 50, it is good to enter into sell/short position.
I have also used the knowledge of RSI for this analysis. It is simple to configure this indicator. If the value is below 50, it is good to enter into a buy/long position and if it is above 50, it is good to enter into sell/short position.
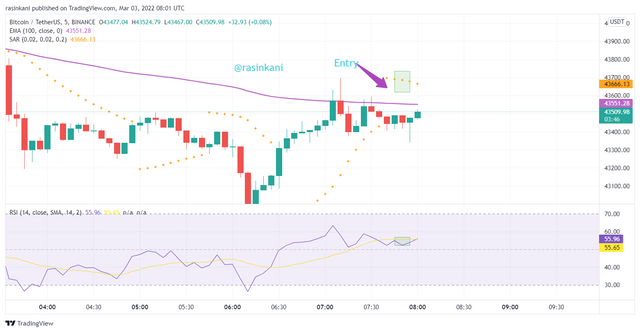
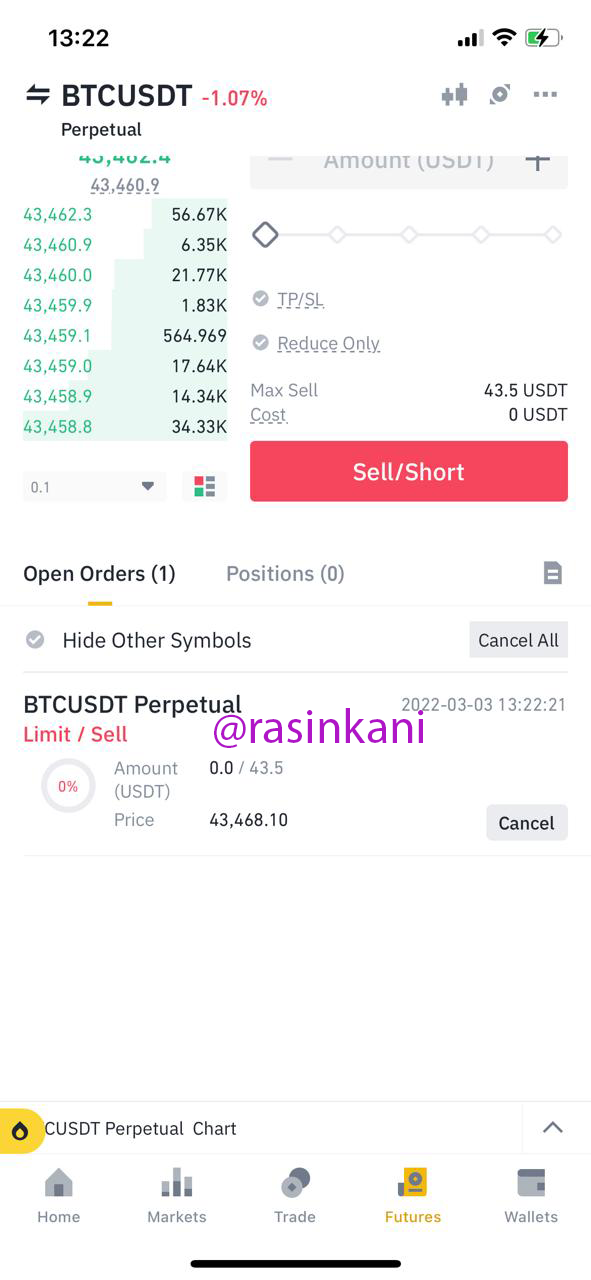
In my analysis, I have waited for a matching scenario for a sell/short or buy/long and I got a Sell/short opportunity where all three indicators matched with the conditions they request. EMA was above the price at the moment and the RSI has been above the value 50. When three dots of Parabolic SAR appeared above the price chart, I have entered into the market with $45 with the leverage of 20X. Last time, I have used $50 with 10X leverage for ETH/USDT coin pair.
 Screenshots taken from tradingview.com
 Screenshots taken from my Binance application
Since I don’t have a big amount of capital, using leverage helped me to increase the capital I can invest. So, I sued 20X to reach $45 for investing. I could get a $0.29 profit from this trade. I need to gain more experience before going for larger trades.
Leverage trade can give a greater benefit as well as greater risk. That is why we need to have a good knowledge before we start trading.
.png)
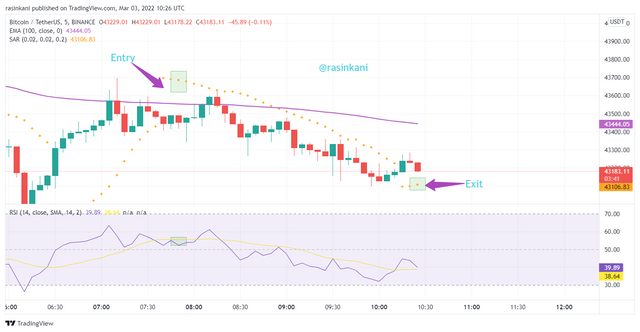
As for the analysis knowledge I have, when the direction of the parabolic SAR starts to change, it is the time to make the decision for exiting the market. Before exiting the market I have waited for three dots of Parabolic SAR to appear. So I can confirm that this trend is continuing. After three dots appeared in the opposite direction, I have decided to exit the market closing my trade. And you can see how the EMA, Parabolic SAR and RSI are represented at the moment of closing the trade. When I was closing it had the profit of $0.29 for the $45 investment I did with the 20X leverage.
Always, we need to be careful about leverage trading because it can bring good interest or it can make you loss everything. We need to decided the best entry point and exit point because of this.
 Screenshots taken from tradingview.com
.png) Screenshots taken from my Binance application
Screenshots taken from my Binance application
.png)
As I am new to trading, I haven’t done much of real trading yet. Therefore the knowledge I have gained through the lessons of Steemit Crypto Academy was a greater help for me to use in the real situation here. . And there will be more to learn and gain experience in the future. As far as I have learnt by the knowledge and the experience, it is safer to do trades with the correct knowledge. It will lead for profit not the loss. So we can enter into the market at the correct timing and take the profit at the correct time and exit the market at a better point. With the fine knowledge, we can use more leverage on trades knowing how to gain the profit as well as how to manage the potential risks. I have tried 10X leverage and 20X leverage so far for my trading. The coin part of BTC/USDT is a good coin pair to invest in with the trading knowledge.
.png)
For any trader, they can be new or experienced, if they have proper knowledge, they can gain profit from the crypto trading. As well as the profit, there can be risks. That is why we need to learn from past data and analyse the market behaviour and trends. So the predictions can be made based on information instead of just predicting by the price up and down. Better decisions are made when the better knowledge and information are there.
I am thankful for everyone who worked hard to give these trading knowledge to all the Steemians ❤. Thank you everyone for reading.