
Traders and investors use lots of trading tools like candlesticks and indicators when trading to enable them to get a clearer picture and insight into the movements of market trends. One of such indicators is the Vortex Indicator. Professor @asaj has given a detailed lesson on Vortex indicator and I will be performing my homework task in this post.
Vortex Indicator
A vortex indicator is an indicator made up of two lines used to predicts trends reversals and confirm current trends, these lines represent a downtrend and an uptrend (VI- and VI+), and they are usually given the color green for uptrend and red downtrend.
Vortex indicator was built by Etienne Botes and Douglas Slepman in 2010 using the True Range developed by Welles Wilder. The vortex indicator works by calculating the distance from the highs and lows at a particular time.
The positive trend is determined by the distance from the current high to the previous low and this will mean an upward movement in the positive or buy line (denoted with the color blue and symbol VI+) and the downward movement of the negative line
The length of the previous high and the current low is used to determine the negative trend and the upward movement of the negative line (denoted with the color red and symbol VI-) and the downward movement of the positive line.
When the positive blue line crosses over the negative line upwards it indicates a buy-in by investors and traders and a bullish reversal in the current trend also when the negative red line crosses above the positive line it indicates a sell-off and a bearish reversal in the current trend.
When the negative line and positive line move in the same direction or in parallel then there the market is in a range. The distance between both lines or divergence indicates strength in trend. Vortex Indicators works better when paired with other indicators to get an accurate reading of the market like MACD (Moving Average Convergence Divergence).
How The Vortex Indicator is Calculated
Vortex signals can be calculated using the following steps
Get The Trend : This is gotten by determining the distance from the current high to the previous low for a positive trend or an uptrend and vice versa for a negative trend. This determines the current trend of the market.
Select a Parameter Length : A period of time is selected, Welles Wilder advises the use of 14 periods be it in minutes, hours, or days as they give more accurate reading of the market trends than other periods. The period of 14 is only a suggestion and not a rule.
Calculate True Range : The True Range can also be calculated by getting the distance from the current high from the previous close and current low from the previous close.

Is The Vortex Indicator Reliable
The vortex indicator is the measure of previous low/high to current high/low and current high/low to previous close meaning that it is a clear representation of the traders or investor sentiment at a given period making it reliable to confirm trends and easily spots reversals in trends.
The Vortex Indicator is pretty reliable, the reliability of all indicator tools are tested on the point of a trend reversal or change and the vortex indicator shows great strength in such case as it is effective in identifying such change in the market trends. The only setback of the vortex indicator is that it shows a lot of false signals when set to a shorter time and that can be remedied with a longer time.
The vortex indicator works better when paired with other indicators e.g. MACD, this also helps filter most false signals even in a short time.

How the Vortex Indicator is Added to the Chart and its Recommended Parameters
I will be using Trading View for the purpose of this illustration. To add vortex indicator to the chart we will have to follow the steps stated below.
- Open the trading view platform by searching it from google and click on chart to open the chart.
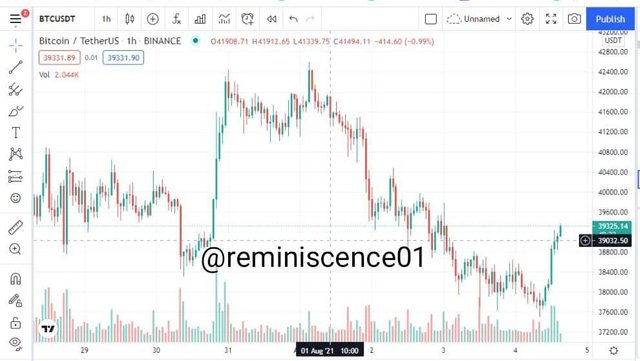
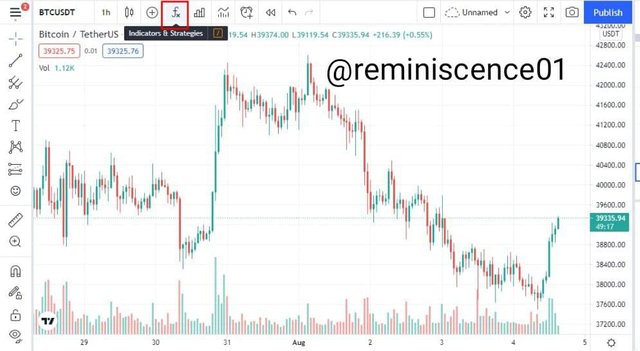
- Click on the indicators and strategies button on the top menu
- A drop menu will show and search for vortex indicator and double click.
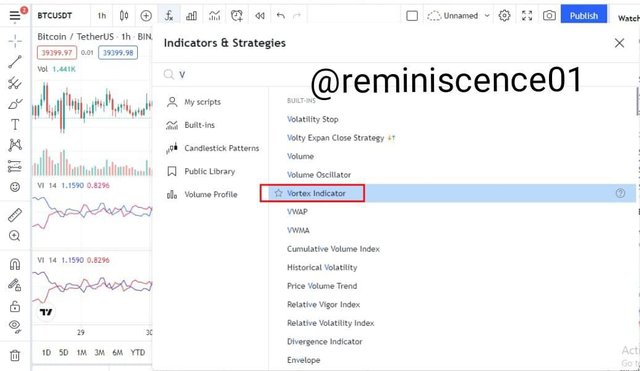
- The Vortex Indicator will appear on the chart as shown below.
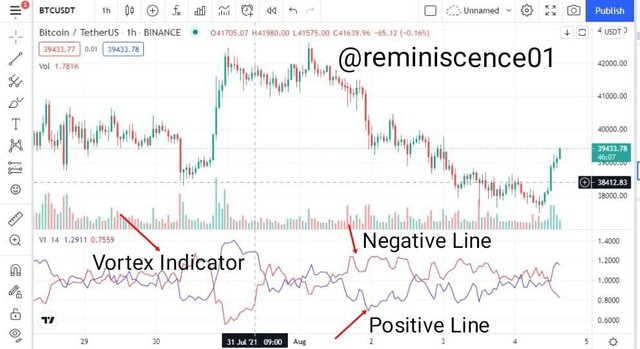
The recommended parameters are shown as follows
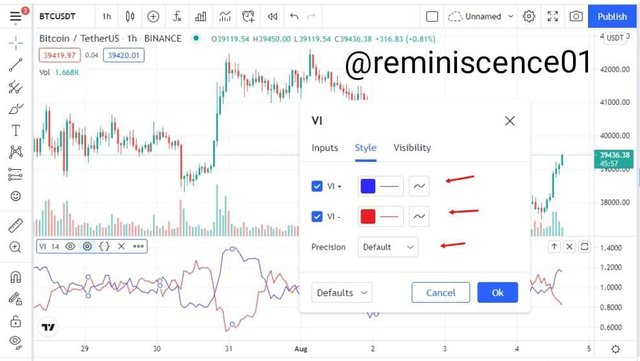
- Click on the settings located on the Vortex Indicator and a pop-up display will appear. On the display under style, the default settings shows the positive line is denoted with color blue and the negative line color red. As shown below
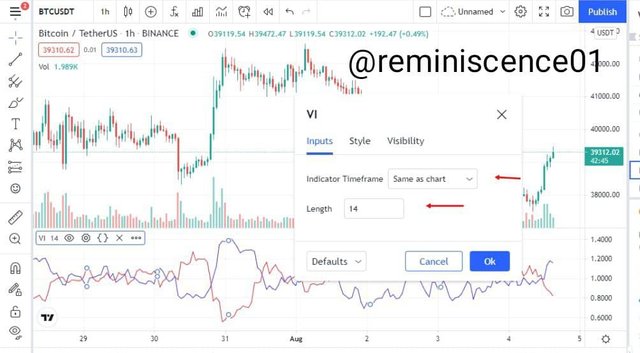
- On the pop-up display click on inputs to check for parameter length (14 is the default) and make sure the indicator time-frame is set as “same as chart”
- Finally on the display the visibility settings should be left on default.
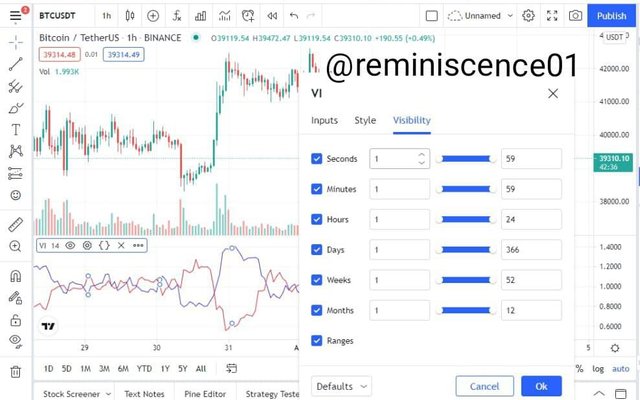
That is how the Vortex Indicator is added to the chart and set the parameters.

The Concept of Vortex Indicator Divergence with Examples
The Vortex Indicator Divergence is the distance between both trend lines, the vortex indicator divergence can be categorized into two types namely;
- Bullish Divergence
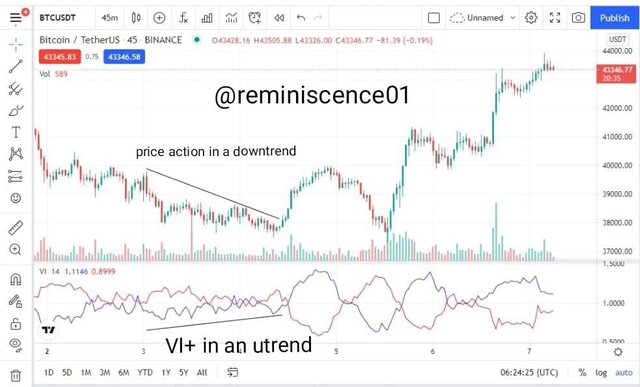
A bullish divergence occurs when the positive line VI+ draws a higher high and the price action draws decreasing lows. This is a buy signal and the higher the divergence the stronger the buy signal. An example is shown below where a very strong bullish divergence is shown in the vortex indicator and we can see an uptrend spike in the market.
- Bearish Divergence
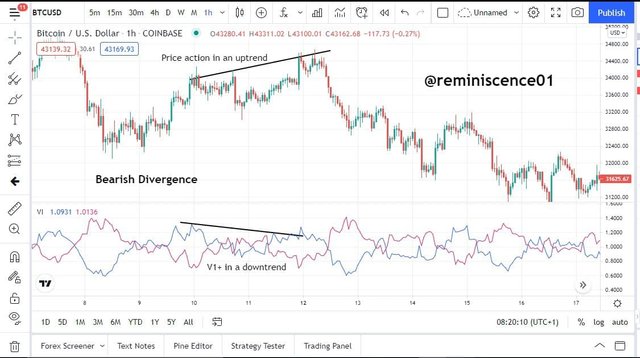
A bearish divergence occurs when the negative line VI- draws a lower high and the price action draws rising highs. This is a sell signal and the higher the divergence the stronger the sell signal. An example is shown below where a bearish divergence is shown in the vortex indicator and we can see a downtrend movement in the market.
Bullish and Bearish divergences are a good buy and sell signals respectively.

Use the signals of VI to buy and sell any two cryptocurrencies
To make this purchase using the VI signals I will be using the Trading view paper trading tool.
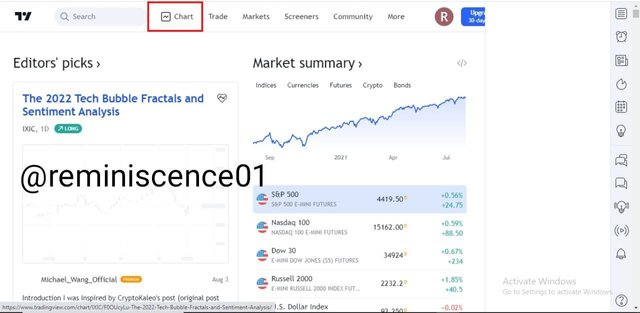
I will be using two cryptocurrencies for the sake of this task. Buying Doge or going Long on DOGE and selling ALICE or going Short on ALICE
Buying DOGE
I clicked on the DOGE/USDT chart with my vortex indicator tool configured with the recommended parameters already so I waited for a buy signal.
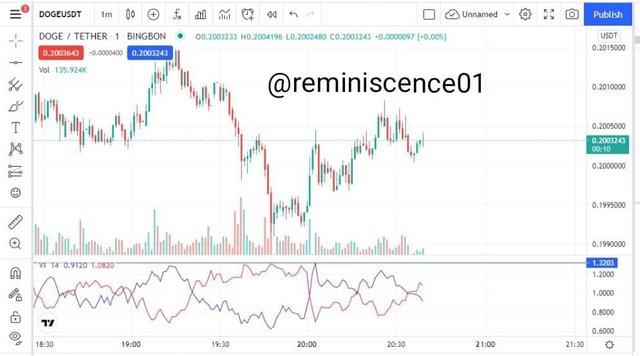
After few minutes a buy signal emerges when the positive trend line VI+ crosses above the negative trend line VI- and I placed a buy order as shown below
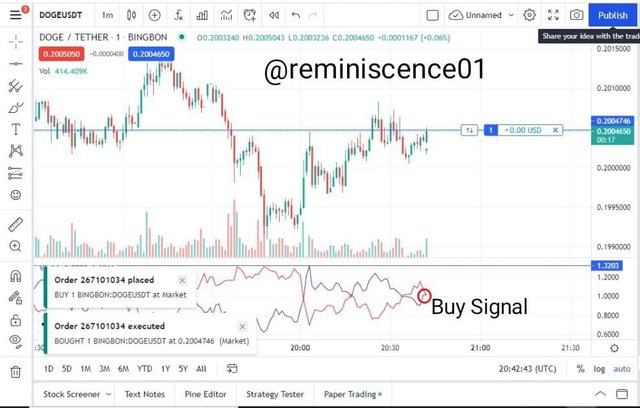
Details of the ongoing trade are shown below

Selling ALICE
On the ALICE/USDT chart, the vortex indicator was configured with the recommended parameters. I waited for a sell signal
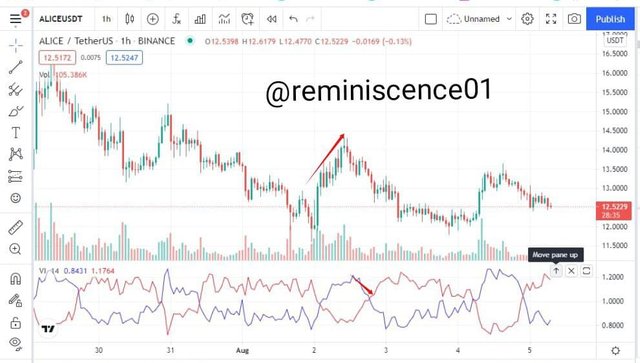
After a while, a sell signal appeared when the positive trend line VI+ hit the resistance line set. A sell order was placed.
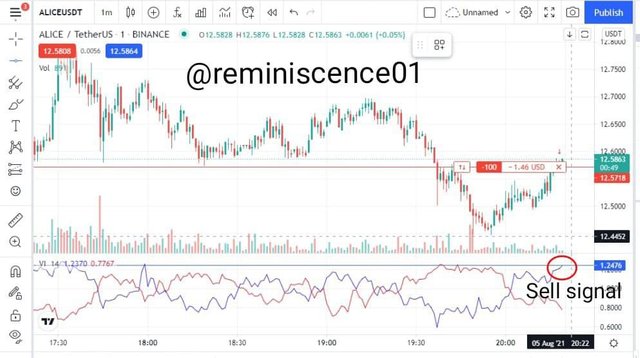
Details of the ongoing trade are shown below and we are on profit as shown below.


Conclusion
The Vortex Indicator is a relatively easy and very helpful tool for trading cause it helps give a clear picture of the market in regards to its current trend and reversals. It is very efficient and accurate when paired with other trading tools or indicators like MACD to help reduce false signals.
Thank you professor @asaj for this wonderful lesson.
Superb performance @reminiscence01!
Thanks for performing the above task in the sixth week of Steemit Crypto Academy Season 3. The time and effort put into this work is appreciated. Hence, you have scored 8 out of 10. Here are the details:
Remarks
You displayed a good understanding of the topic. Your response to the second and last task was particularly unique and logical. However, task 4 could use a bit of more originality. Bitcoin isn't the only existing cryptocurrency. Quite a majority of participants have already used Bitcoin in their examples.
Downvoting a post can decrease pending rewards and make it less visible. Common reasons:
Submit