What is the meaning Support can become resistance and resistance can become support, when and where set by trade?
In the previous lessons, we discussed support and resistance and how an investor/ trader can capitalize on the market when prices come to a support and resistance level. The basic explanation is to buy when the price is at support and also to sell when the price at a resistance. Traders normally fall for this trap to buy at support and sell at resistance without proper technical analysis and market structure.

The truth is that support can be broken as well as resistance. For example, in an uptrend, the price makes higher highs and higher lows and when this chart pattern is formed, resistance tends to be broken and retested during retraced of the uptrend. This retracement is known as "retest of the previous resistance now turned support".

For a downtrend, the price creates lower highs and lower lows, during this chart pattern formation, support is being broken and retested during the retracement. This retracement retest the previous support now turned resistance.
Where to set buy trade?
Break out traders can take an impulse entry (buy trade) when the price starts breaking the resistance. But this approach is very risky so as not to get caught up in a false breakout. The best approach to take a buy trade is to wait for a break and retest of resistance now turned support, once the resistance is now turned support, wait for a candlestick pattern may be a bullish engulfing pattern or a hammer to be formed at the newly found support before taking a buy trade. The example is shown in the picture below.

Technical indicator
Technician indicators are tools that help a trader to make better trading decisions in his technical analysis. There are more than 200 technical indicators. It is required for a trader to find the indicators that suit his trading pattern. These indicators can be trend-based, volatility-based and momentum-based
Trend-based indicators
These indicators help a trader to know the current trend of the market. Either uptrend or downtrend. Examples of trend-based indicators are the moving average, average directional movement index (ADX), Ichimoku Kinko Hyo, etc.
Volatility-based indicators
The volatility-based indicators help a trader to know the degree of an upswing and a downswing. These indicators are most suitable in a ranging markets where prices bounce off support and resistance. Examples of these indicators are Bollinger bands and the Average True range (ATR).
Momentum-based indicators also called Oscillators
The momentum-based indicators help to know how far price has traveled in a particular currency pair. These indicators move with the currency price giving a trader an idea when a price of a particular asset is overbought or oversold. Traders can use these indicators to know the potential price reversal of a market. A good example is when an oscillator is in an overbought region and the chart pattern formed a double top, these two technicals analysis can be combined to take a sell position. Examples of momentum-based indicators are Relative strength index (RSI), Stochastic indicator, Moving average convergence divergence (MACD), etc.
Bollinger Band

The Bollinger is a volatility indicator that is made up of 3 lines. The middle line is the 20-period moving average with upper and lower bands. The Bollinger bands expand depending on the volatility of the price of an asset. The price of an asset is assumed to be overbought when it approaches the upper band and oversold when it approaches the lower band.
When there is a squeeze in Bollinger bands, it indicates low volatility in the price of an asset. The squeeze in Bollinger bands isn't an indication to open a position.

Similarly, the price can breakout out of the upper or lower Bollinger bands. This breakout can be caused by big news events or a partnership of a coin. Bollinger bands just provide information about the volatility of an asset. Bollinger bands can be used together with two or three more indicators to confirm whether to buy or sell.

TradingView
Trading View is an advanced charting and social platform for beginners and advanced traders to explore and make trading decisions. Tradingview provides traders and investors with basic charting, drawing tools, and numerous indicators to aid them in making trading analysis.
The picture above is the home page of Tradingview. The red zone is the editor’s pick where traders and investors share their opinion of a particular asset using the chart. The blue zone shows the market summary and watchlist of different assets which can be a commodity, forex, indices, or cryptocurrency. Clicking the chart (yellow area) will take us to the chart where technical analysis is carried out using various drawing tools and indicators to make trading decisions.
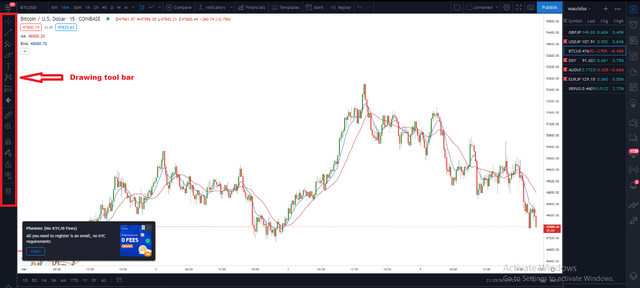
The left panel shows the drawing toolbar on Tradingview. These drawing tools are provided for a trader to play around with the chart and make technical markups.
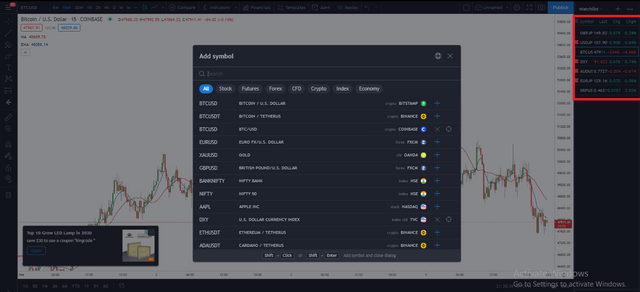
The red zone is the watchlist which can be any type of market depending on the type of market. Tradingview provides a lot of watchlists for investors and traders from the stock market, forex market, CFD, Indices, and Cryptocurrency.
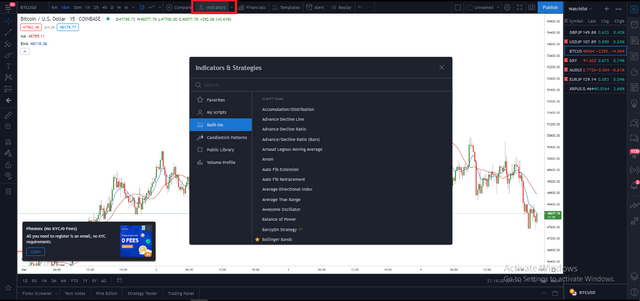
Tradingview provides more than 200 indicators for making trading decisions. The picture above shows the indicator built-in in Tradingview. Similarly, traders are also allowed to import an indicator from a public library.
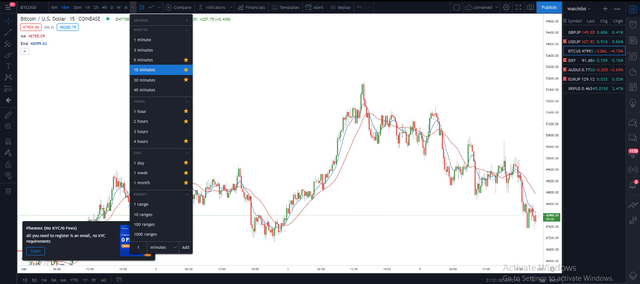
The picture above shows the various timeframes in Tradingview. These multiple time frames can help traders to switch to various charts for multi-timeframe analysis. Similarly, traders can also be allowed to customize their timeframe to suit their trading style.
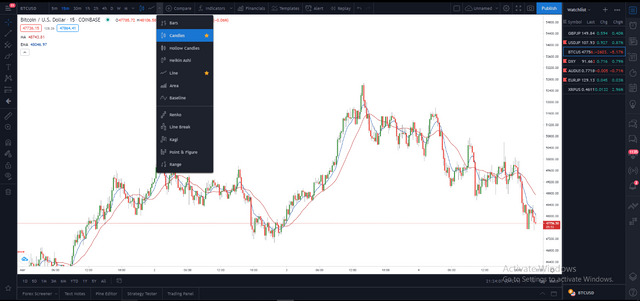
Tradingview Chart patterns
There are so many chart patterns in Tradingview. The picture above shows the various chart pattern available in Tradingview. The most used chart pattern is the candlestick pattern because it is simple and easy to understand.
What is the 200 moving average?
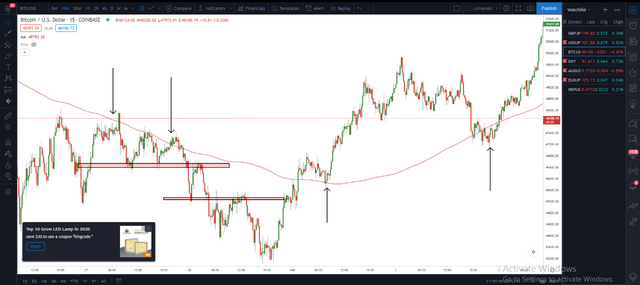
The 200 moving average is a trend-based technical indicator that enables traders to follow the trend of a particular asset. The 200 moving average represents the average closing price of an asset for the last 200 days. Price is considered to be in an uptrend when it is trading above the 200 moving average and in a downtrend when it is trading below the 200 moving average.
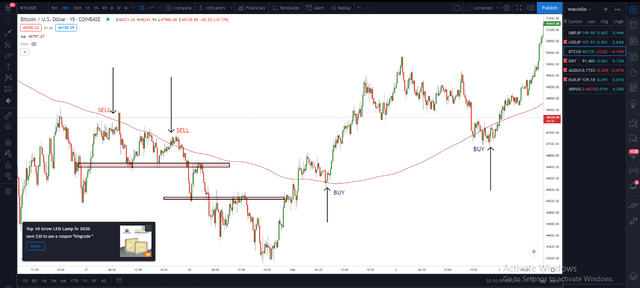
From the picture, we can see how price tends to bounce back when it hits the 200 moving average, these can be a potential buy or sell opportunity using this indicator.
How and when we can trade/invest with the help of 200 Moving Average?
Moving average is a good indicator for technical analysis. The 200-day moving average can serve as dynamic support and resistance levels as the price always bounces back when it touches the 200 moving average. Traders can take a buy position in an uptrend (price trading above 200 MA) when the price touch the 200 moving average or a sell position in a downtrend (price trading below the 200MA) when the price touch the 200 moving average.
Indicators are not confirmations to open a buy or sell position. They serve as a signal to traders on the next plan of action. Similarly, it is advisable to use two or three indicators for an accurate signal as some of these indicators either lag or go against the current price.
Note: All pictures used in this post are screenshots from my Tradingview account.
Thank you professor @stream4u for this wonderful lesson.
Cc: @stream4u
Cc: @steemcurator01
Cc: @steemcurator02
Cc: @steemitblog

Hi @reminiscence01
Thank you for joining Steemit Crypto Academy and participated in the Homework Task 4.
Your Homework task 4 verification has been done by @Stream4u.
Thank You.
@stream4u
Crypto Professors : Steemit Crypto Academy
Downvoting a post can decrease pending rewards and make it less visible. Common reasons:
Submit
Thank you Professor @stream4u.
Downvoting a post can decrease pending rewards and make it less visible. Common reasons:
Submit
Twitter promotion
Downvoting a post can decrease pending rewards and make it less visible. Common reasons:
Submit