
Hello Steemians, greetings to all members of the Crypto Academy. I welcome all to week 1 of the 4th season, prof @sapwood lesson for this week focused on Onchain Metrics, and he did an excellent job in explaining on-chain metrics and how to apply them in analysis. I will be doing the homework task from the lesson.

Question 1: What is a HODL wave, how do you calculate the age of a coin(BTC, LTC) in a UTXO accounting structure? How do you interpret a HODL wave in Bull cycles?

HODL Wave
Hodl wave is a type of on-chain metrics that uses a different color variant chart to represent a macro view of the age distribution of the coin supply. Hodl wave shows how long an asset has stayed in a wallet without being moved based on UTXO (Unspent Transaction Outputs).
Using the Bitcoin HODL Wave chart as an example
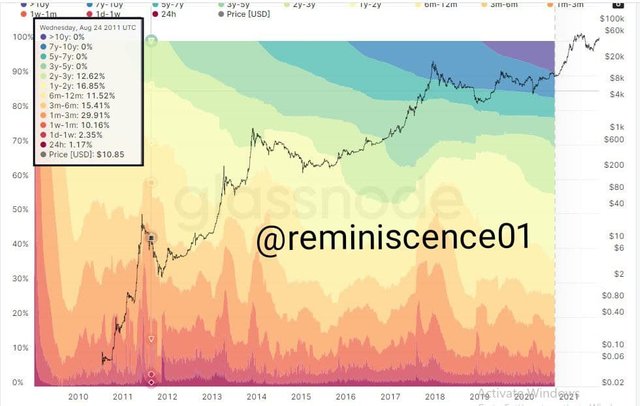
HODL Wave takes the total coin supply and categorizes them by lifespan, creating age bands of 1 day, 1 day-1 week, 1 week-1 month, I month-3 months, 3 months-6 months…….7 years-10 years, and greater than 10 years, as shown above.
The HODL Wave has two primary forms of colors, namely;
Hot Colours: the hot colors are seen at the lower section of the charts, and they represent younger coins
Cool Colours: the cool colors are seen in the upper section of the charts, and they represent older coins or more dormant coins.
How To Calculate The Age Of A Coin
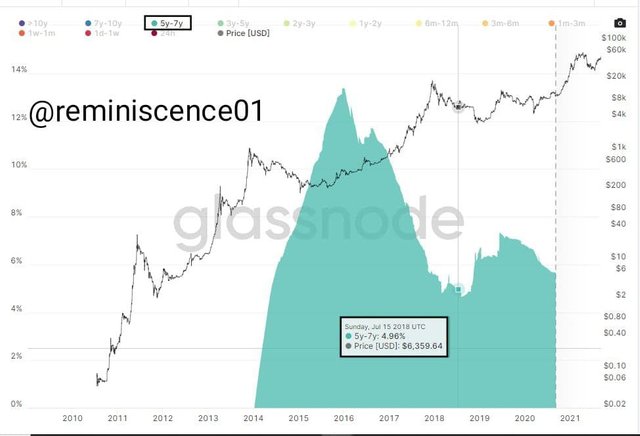
In calculating the age of a coin in a UTXO accounting structure, color variations in the HODL Wave are used to separate older or dormant coins into younger or hot coins.
For example, to show 5 years to 7 years old coins, we isolate the 5-7 years color by switching off all other color bands to get a graphical representation of the coins 5-7 years old.
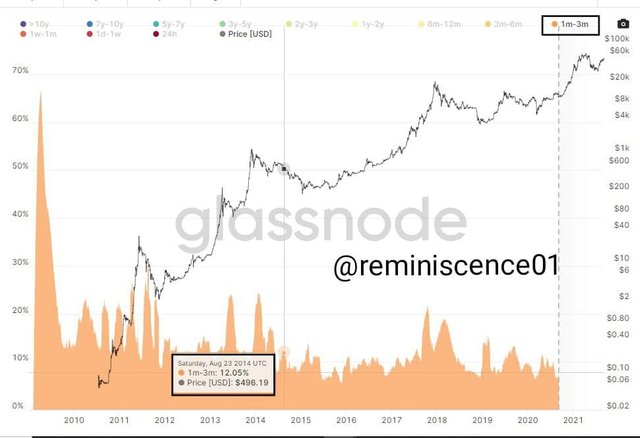
In the same way, if I am to check for coins aged 1-3 months, I switch off all other age color bands, and I'll get a graphical representation of the coins age 1-3 months.
HODL Wave in Bullish Cycle
The older bands in the HODL Wave that is coins categorized between the age groups of 1-10+ years tend to expand during a bull cycle cycle, indicating more coins are being HODL.
This can be explained using the economic theory that states that scarcity increases value. Therefore, the older bands expanding during a bullish cycle indicates younger coins are being unspent and are becoming a part of the older bands, showing a decrease in the circulating supply, which leads to an increase in demand.

Question 2: Consider the on-chain metrics-- Daily Active Addresses, Transaction Volume, NVT, Exchange Flow Balance & Supply on Exchanges as a percentage of Total Supply, etc., from any reliable source(Santiment, Coinmetrics, etc.), and create a fundamental analysis model for any crypto[create a model for both short-term(up to 3 months) & long-term(more than a year) & compare] and determine the price trend (or correlate the data with the price trend)w.r.t. the on-chain metrics? Examples/Analysis/Screenshot?

Daily Active Address
This is an On-chain Metrics that indicates the number of active addresses per the price action movements in a set period.
- Short Term Analysis (3 months)
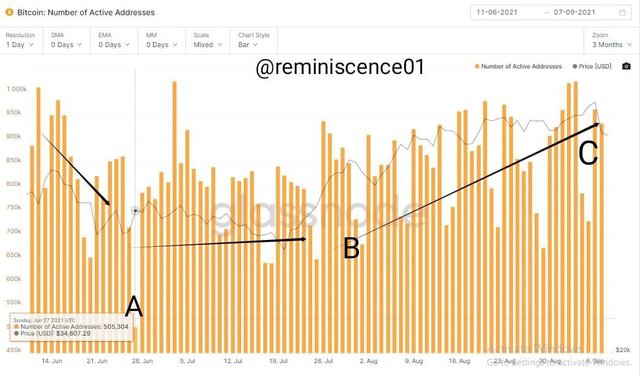
In the short term, the number of Active Addresses dropped from a peak high of 1,009,281 users to 505,000 users at point A, but the price dip was not as drastic as it only dropped from $35,512.90 - 34,607.29.
Furthermore, from point B to C, the price moved in an uptrend recording a rise from $29,783.01 - $52,610.54, while the active addresses went from 823,987 - 963,749.
Observation: An increase in active users leads to a rise in price and vice versa. The short-term scale active-addresses on-chain metrics do not have a good relationship with the price action.
- Long Term Analysis (3 years)
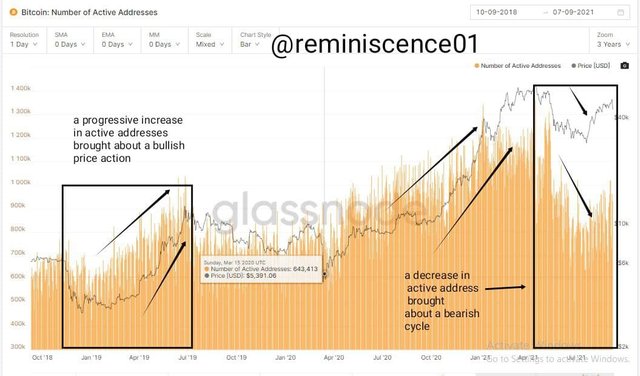
By merely looking at the long-term scale chart, there is an apparent correlation between active addresses and price action. The price moved in a bullish trend with an increase in the active addresses and a downtrend when the active addresses dipped.
Using the long-term on-chain metrics gives an accurate complimenting relationship between the active addresses and the price action.
Transaction Volume
Transaction volume is an on-chain metric that indicates the coin (BTC) exchange volume within a set period. The transaction volume does not correlate with the price action, but a spike in transaction volume may indicate a change in price action.
- Short Term Scale (3 months)
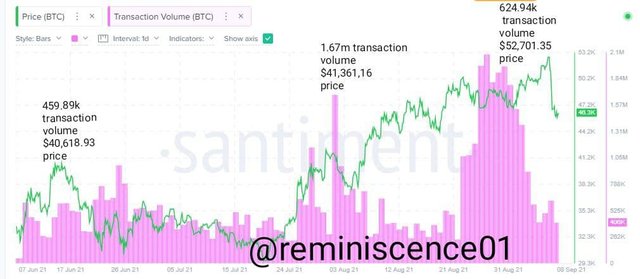
On 15th June, the transaction volume was 459.89k, and the price was at $40,618.93.
On 1st August, transaction volume spiked at 1.67m and the price was at $41,361,16, another transaction volume spike happen on 27th August with a transaction volume of 2.08m. right after the spike price peaked at $52,701.35 with a decrease in transaction volume at 624.94k.
- Long Term Scale
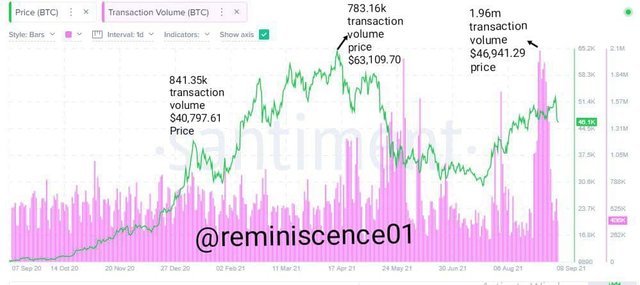
On 7th January 2021, transaction volume was at 841.35k, and the price was at 440.797.61.
A spike in price occurred on 14th April 2021 at $63,109 and transaction volume at 783.16k
A spike in transaction volume occurred on 28th August 2021 at 1.96m and the price at $46,941.29.
- Observation: transaction volume does not correlate with the price action. On the short-term scale, I observed that price went on an uptrend after a transaction volume spike. However, there seems to be little correlation between the price action and the transaction volume in the long term.
NVT Ratio (with transactional volume)
NVT, also known as the network value to transaction, is an on-chain metric that shows the relationship between the transfer volume and market capitalization. NVT offers the actual value of an asset. NVT is calculated by dividing the market cap by the transaction volume.
A high NVT reading indicates an oversold condition, and a low NVT reading indicates an undervalued asset. It is advised that NVT should not be used alone during analysis when trading as it is a lagging indicator.
- Short Term Scale (3 months)
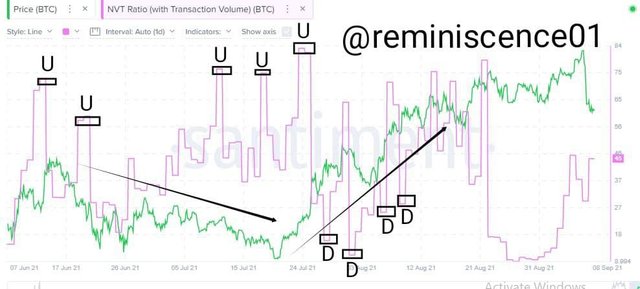
The short-term scale shows that the high NVT readings are denoted as U and low NVT readings represented as D. Thus, the NVT high reading indicates an oversold asset in the market hence the bearish price action, and the NVT low readings indicate an undervalued asset hence the bullish price action.
- Long Term Scale
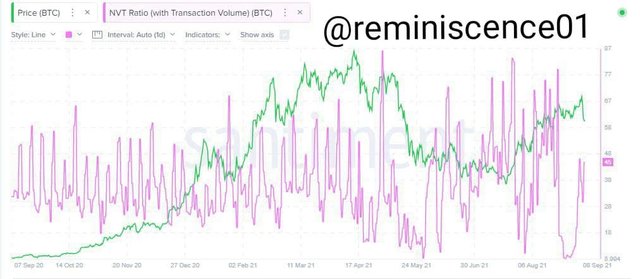
The long-term scale still follows the theory, with high reading indicating an oversold asset and low reading showing a bullish price action or an undervalued asset.
Exchange Flow Balance
Exchange flow balance is an on-chain metric that derives the balance from the ** Inflow** and ** Outflow** of coins into and out of exchanges, respectively. The Inflow of coins into exchanges gives a bearish signal, and the Outflow provides a bullish signal.
- Short Term (6 months)
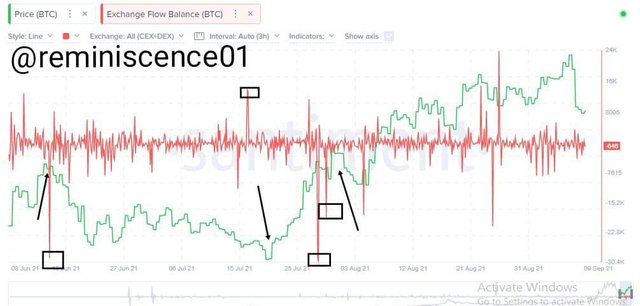
The spikes below represent an outflow from the exchange, and this causes a bullish movement of the price action. Conversely, the upward spikes indicate an inflow of coins into the exchanges leading to a bearish price action movement.
On 15th June 2021, there was an outflow of BTC from exchanges, taking the Exchange flow balance to -34,279.74 and price grew to $40,025.02. On 17th July 2021, there was a high Inflow of BTC into the exchanges pegging the Exchange flow balance at +28,774 and price dropped to $31,7757.
- Long Term Scale
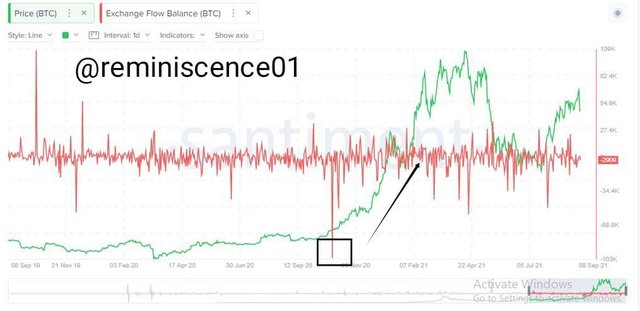
The long term showed a correlation of Exchange Flow Balance on-chain metrics with the price action. The Outflow of assets brought about an uptrend in the movement of the price action. On the other hand, a ranging exchange flow balance on-chain metrics brought about a lateral movement of the price action.
Supply on Exchanges as a percentage of Total Supply
The supply on exchanges as a percentage of total supply is an on-chain metric that shows how the supply of coins into the exchange wallet adds to the total circulating supply. The increase in supply into exchanges increases the supply of coins in circulation, decreasing the coin's value.
Price action moves inversely to the movement of the supply on exchanges.
Short Term Scale
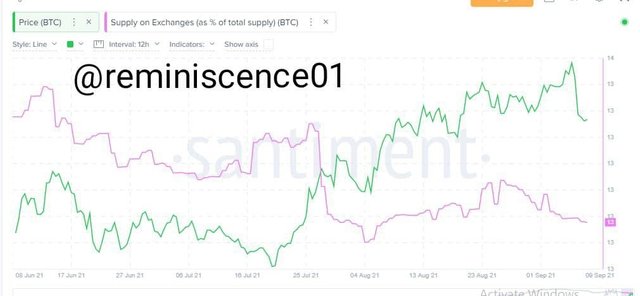
The short term does not show a perfect correlation between the supply on exchanges and price action. On 23rd June 2021 price of BTC was at $33,940.71 and the supply on exchange percentage was 13.68%
On 7th August 2021, the supply on exchanges percentage was 13.25% and the price was at $44,555.80. On 28th August, the supply on exchange percentage was 13.46% and the price was at $46,941
- Long Term Scale
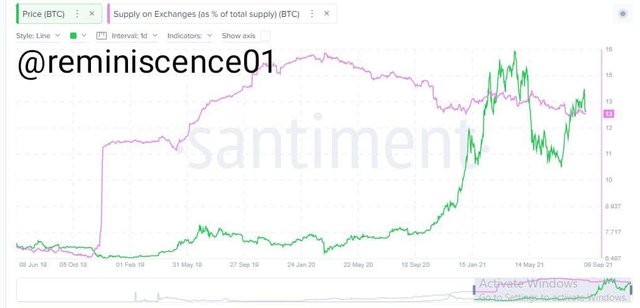
The long-term scale shows a better correlation of price action with supply on an exchange, as their movement is inversely proportional to each other.
On 12th March 2020, the supply on exchange percentage was at 15.95% and the price was at $5, 017.83, and on 13th November 2020, the price was at $16,317.89 nd the supply on exchange percentage was at 13.46%
General Observation
The on-chain metrics (NVT, Active Addresses, Supply on Exchanges, Exchange Flow Balance, Transaction Volume) works on the principle of supply and demand as they affect the value of a coin. Therefore, on-chain metrics can be used as a good trading tool when trading long term.

Are the on-chain metrics that you have chosen helpful for short-term or medium-term, or long term(or all)? Are they explicit w.r.t price action? What are its limitations? Examples/Screenshot?

Onchain Metrics on Short, Medium and Long term
The on-chain metrics showed a good correlation with price actions and clear signals when using long-term projections (1-2year to10+ years).
Most times, the short-term and medium-term projections do not give a perfect correlation with the price actions, which may lead to false signals. Some on-chain metrics show a good correlation with the price action using short-term projections like the Exchange Flow Balance and NVT ratio, but overall it is advisable to use the on-chain metrics on long-term projections when trading.
Also, the addition of other trading tools like fundamental analysis and indicators gives a clear trading signal.
Onchain Metrics to Price Action
The Onchain Metrics correlates with the Price Action, especially when trading using the long term. The Onchain Metrics increases with low supply and high demand, and the Price action works on the same principle. When there is a high buying pressure, the price tends to rice as there is high demand in the market, and when there is high selling pressure, the price drops as demand is low and there is increased supply.

An example is shown below is the Exchange flow balance metrics. This indicates that scarcity in the supply of coins to the exchange brought about a price increase.
Limitations
- Time
The on-chain metrics, as we have learned, work better on long-term projections. However, this is a limitation as daily traders won't benefit from the on-chain metric analysis. Also, many coins are not as old as bitcoin, so data interpreted by the on-chain metrics on much younger coins might not be reliable.
- Diverse Coin Purposes
Unlike in technical analysis, where analysis is focused on the asset's price action, on-chain metrics analyze different aspects of the coin. In addition, other coins are built for various purposes, so different interpretations can be made on an on-chain metric analysis of 2 cryptocurrencies.
- Vague Data
Some of the data analyzed on the on-chain metrics are too broad and do not precisely represent the coins' activities. For example, the transaction volume on-chain metrics do not account for transactions done on the off-chain networks like the Lightning Network. Furthermore, some traders use exchange-provided wallets to store their coins, which does not add to the supply of coins in circulation.

Conclusion

On-Chain Metrics are activities of a coin that influences the value or price action of the coin. The on-chain metrics include NVT ratio, Active addresses, Transaction Volume, Supply on Exchanges, etc.
On-chain Metrics analysis can be used for trade signals, especially on a long-term trading projection, as it has a good correlation with the price action of the coin.
Thanks, prof @sapwood, for an insightful and well-detailed lesson.
Respected Professor,
Please give me marks thànks
https://steemit.com/hive-108451/@naveed15125/steemit-crypto-academy-beginners-level-season-4-week-1-or-the-bid-ask-spread
Downvoting a post can decrease pending rewards and make it less visible. Common reasons:
Submit
Twitter Promotion
Downvoting a post can decrease pending rewards and make it less visible. Common reasons:
Submit